Data Analysis Machine Learning and Applications Episode 2 Part 5 pps
Bạn đang xem bản rút gọn của tài liệu. Xem và tải ngay bản đầy đủ của tài liệu tại đây (512.32 KB, 25 trang )
ADSL customer segmentation combining several SOMs 349
Binary
Profile
Binary
Profile
Binary
Profile
Unknown Down
Customers
Daily Activities Profiles
STEP 1
STEP 2
Global Daily Activity Profile
Typical Applications Days
Concatenation
Typical Days
STEP 3
STEP 4
STEP 5
Typical Customers
log file
Proportion of days spent
in each "typical days" for the month
Web Down
P2PŦup
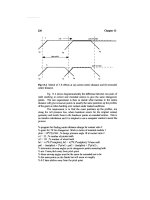
Fig. 6. The multi-level exploratory data analysis approach.
The first step leads to the formation of 9 to 13 clusters of “typical application
days" profiles, depending on the application. Their behaviours can be summarized
into inactive days, days with a mean or high activity on some limited time periods
(early or late evening, noon for instance), and days with a very high activity on a
long time segment (working hours, afternoon or night).
Figure 7 illustrates the result of the first step for one application: it shows the
mean hourly volume profiles of the 13 clusters revealed after the clustering for the
web down application (the mean profiles are computed by the mean of all the ob-
servations that have been classified in the cluster; the hourly volumes are plotted in
natural statistics). The other applications can be described similarly.
350 Francoise Fessant et al.
0 5 10 15 20 25
0
1
2
3
4
5
6
x 10
6
hours
volume (in byte)
Web Down Application
C1
C2
C3
C4
C5
C6
C7
C8
C9
C10
C11
C12
C13
Fig. 7. Mean daily volumes of clusters for web down application
The second clustering leads to the formation of 14 clusters of “typical days".
Their behaviours are different in terms of traffic time periods and intensity. The main
characteristics are a similar activity in up and down traffic directions and a similar
usage of the peer-to-peer and unknown applications in clusters. The usage of the web
application can be quite different in intensity. Globally, the time periods of trafficare
very similar for the three applications in a cluster. 10 percent of the days show a high
daily activity on the three applications, 25 percent of the days are inactive days. If
we project the other applications on the map days, we can observe some correlations
between applications: days with a high web daily traffic are also days with high
mail, ftp and streaming activities and the traffic time periods are similar. The chat
and games applications can be correlated to peer-to-peer in the same way.
The last clustering leads to the formation of 12 clusters of customers which can
be characterized by the preponderance of a limited number of typical days.
Figure 8 illustrates the characteristic behaviour of one “typical customer" (cluster
6) which groups 5 percent of the very active customers on all the applications (with a
high activity all along the day, 7 days out of 10 and very little days with no activity).
We plot the mean profile of the cluster (computed by the mean of all the customers
classified in the cluster (up left, in black). We also give the mean profile computed
on all the observations (bottom left, in grey), for comparison.
The profile can be discussed according to its variations against the mean profile
in order to reveal its specific characteristics. The visual inspection of the left part of
Figure 8 shows that the mean customer associated with the cluster is mainly active
on “typical day 12" for 78 percent of the month. The contributions of the other “typ-
ical days" are low and are lower than the global mean. Typical day 12 corresponds to
very active days. The mean profile of “typical day 12" is shown in the right top part
ADSL customer segmentation combining several SOMs 351
0 10 20 30 40 50 60 70 80
0
0.2
0.4
0.6
0.8
1
typical application day cluster number
Cluster 12, (9%)
Global mean
Unknown
up
Unknown
down
p2p
up
p2p
down
web
up
web
down
0 10 20 30 40 50 60 70 80
0
0.2
0.4
0.6
0.8
1
Typical day 12
0 5 10 15 20 25
0
1
2
3
4
5
x 10
7
0 5
1
0
1
5
2
0
2
5
0
2
4
6
8
10
x 10
6
cluster 6, application: p2p down (12%)
volume (in byte)
global mean
volume (in byte)
1 2 3 4 5 6 7 8 9 10 11 12 13 14
0
20
40
60
80
typical day cluster number
Cluster 6 (5%)
Global
1 2
3
4
5 6
7
8 9
1
0
11 12 1
3
14
0
20
40
60
80
Typical customer 6
Typical day 12
Typical customer 6
Typical day 6 for p2p down application
Fig. 8. Profile of one cluster of customers (up left) and mean profile (bottom) and profiles of
associated typical days and typical application days
of the figure in black. The day profile is formed by the aggregation of the individual
application clustering results (a line delimits the set of descriptors for each applica-
tion). We also give the mean profile computed on all the observations (bottom, in
grey).
Typical day 12 is characterized by a preponderant typical application day on each
application (from 70 percent to 90 percent for each). These typical application days
correspond to high daily activities.
For example, we plot the mean profile of “typical day 6" for the peer-to-peer
down application in the same figure (right bottom; in black the hourly profile of
the typical day for the application and in grey the global average hourly profile; the
volumes are given in bytes). These days show a very high activity all along the day
and even at night for the application (12 percent of the days). Figure 8 schematizes
and synthesizes the complete customer segmentation process.
Our step-by-step approach aims at striking a practical balance between the faith-
ful representation of the data and the interpretative power of the resulting clustering.
The segmentation results can be exploited at several levels according to the level
of details expected. The customer level gives an overall view on the customer be-
haviours. The analysis also allows a detailed insight into the daily cycles of the cus-
tomers in the segments. The approach is highly scalable and deployable and cluster-
ing technique used allows easy interpretations. All the other segments of customers
352 Francoise Fessant et al.
can be discussed similarly in terms of daily profiles and hourly profiles on the appli-
cations.
1 2 3 4 5 6 7 8 9 10 11 12 13 14
0
20
40
60
80
1 2
3
4
5 6
7
8 9
1
0
11 12 1
3
14
0
20
40
60
80
Global mean
Typical customer 10
typical day cluster number
Cluster 10 (3%)
0 10 20 30 40 50 60 70 80
0
0.2
0.4
0.6
0.8
1
0
1
0
2
0 30
4
0 50 60
7
0 80
0
0.2
0.4
0.6
0.8
1
Typical day 1
Cluster 1 (4.5%)
Global mean
typical application day cluster number
unknown
up
unknown
down
p2p
up
p2p
down
web
up
web
down
0 5 10 15 20 25
0
1
2
3
4
5
6
x 10
6
0 5
1
0
1
5
2
0
2
5
0
0.5
1
1.5
2
2.5
x 10
6
Typical day 12 for web down application (8%)
volume (in byte)
Global mean
volume (in byte)
Typical day 1
Typical day 12 for web down application
Typical customer 10
Fig. 9. Profile of another cluster of customers (top left) and mean profile (bottom) and profiles
of associated typical days and typical application days
We have identified segments of customers with a high or very high activity all
along the day on the three applications (24 percent of the customers), others segments
of customers with very little activity (27 percent of the customers) and segments of
customers with activity on some limited time periods on one or two applications,
for example, a segment of customers with overall a low activity mainly restricted to
working hours on web applications. This segment is detailed in Figure 9.
The mean customer associated with cluster 10 (3 percent of the customers) is
mainly active on “typical day 1" for 42 percent of the month. The contributions on
the other “typical days" are close to the global mean. Typical day 1 (4.5 percent of the
days) is characterized by a preponderant typical application day on web application
only (both in up and down directions); no specific typical day appears for the two
other applications. The characteristic web days are working days with a high daily
web activity on the segment 10h-19h.
Figure 10 depicts the organization of the 12 clusters on the map (each of the
clusters is identified by a number and a colour). The topological ordering inherent to
the SOM algorithm is such that clusters with close behaviours lie close on the map
and it is possible to visualize how the behaviour evolves in a smooth manner from
one place of the map to another. The map is globally organized along an axis going
ADSL customer segmentation combining several SOMs 353
from the north east (cluster 12) to the south west (cluster 6), from low activity to high
activity on all the applications, non-stop all over the day.
Customers map
4
1
2
3
5
6
7
8
9
10
11
12
Heavy users
(high traffic on all applications)
Users with
very few activity
Web activity 10hŦ19h
Web activity
P2P Activity,
afternoon and evening
Average activity
Fig. 10. Interpretation of the learned SOM and its 12 clusters of customers
4 Conclusion
In this paper, we have shown how the mining of network measurement data can re-
veal the usage patterns of ADSL customers. A specific scheme of exploratory data
analysis has been presented to give lightings on the usages of applications and daily
trafficprofiles. Our data-mining approach, based on the analysis and the interpre-
tation of Kohonen self-organizing maps, allows us to define accurate and easily
interpretable profiles of the customers. These profiles exhibit very heterogeneous
behaviours ranging from a large majority of customers with a low usage of the ap-
plications to a small minority with a very high usage.
The knowledge gathered about the customers is not only qualitative; we are also
able to quantify the population associated to each profile, the volumes consumed on
the applications or the daily cycle.
Our methodologies are continuously in development in order to improve our
knowledge of customer’s behaviours.
354 Francoise Fessant et al.
References
ANDERSON, B., GALE, C., JONES, M., and McWILLIAMS, A. (2002). Domesticating
broadband-what consumers really do with flat-rate, always-on and fast Internet connec-
tions. BT Technology Journal, 20(1):103–114.
CLEMENT, H., LAUTARD, D., and RIBEYRON, M. (2002). ADSL traffic: a forecasting
model and the present reality in France. In WTC (World Telecommunications Congress),
Paris, France.
CLEROT, C. and FESSANT, F. (2003). From IP port numbers to ADSL customer segmenta-
tion: knowledge aggregation and representation using Kohonen maps. In DATAMINING
IV, Rio de Janeiro, Brazil.
FRANCOIS, J. (2002). Otarie: observation du traffic d’accès des réseaux IP en exploitation.
France Télécom R&D Technical Report FT.R&D /DAC-DT/2002-094/NGN (in French).
KOHONEN, T. (2001). Self-Organizing Maps. Springer-Verlag, Heidelberg.
LEMAIRE, V. and CLEROT, F. (2005) The many faces of a Kohonen Map,. Studies in
computational Intelligence (SCI) 4, 1-13 (Classification and Clustering for Knowledge
Discovery). Springer.
OJA, E. and KASKI, S. (1999). Kohonen maps. Elsevier.
VESANTO, J. and ALHONIEMI, E. (2000). Clustering of the self organizing map. In IEEE
Transactions of Neural Networks.
VESANTO, J., HIMBERG, J., ALHONIEMI, E., and PARHANKANGAS, J. (2000). Som
toolbox for matlab 5. Technical Report Technical Report A57, Helsinki University of
Technology, Neural Networks Research Centre.
Finding New Technological Ideas and Inventions
with Text Mining and Technique Philosophy
Dirk Thorleuchter
Fraunhofer INT, Appelsgarten 2, 53879 Euskirchen, Germany
Abstract. Text mining refers generally to the process of deriving high quality information
from unstructured texts. Unstructured texts come in many shapes and sizes. It may be stored
in research papers, articles in technical periodicals, reports, documents, web pages etc. Here
we introduce a new approach for finding textual patterns representing new technological ideas
and inventions in unstructured technological texts.
This text mining approach follows the statements of technique philosophy. Therefore a tech-
nological idea or invention represents not only a new mean, but a new purpose and mean
combination. By systematic identification of the purposes, means and purpose-mean combi-
nations in unstructured technological texts compared to specialized reference collections, a
(semi-) automatic finding of ideas and inventions can be realized. Characteristics that are used
to measure the quality of these patterns found in technological texts are comprehensibility and
novelty to humans and usefulness for an application.
1 Introduction
The planning of technological and scientific research and development (R&D-) pro-
grams is a very demanding task, e.g. in the R&D-program of the German ministry
of defense there are at least over 1000 different R&D-projects running simultane-
ously. They all refer to about 100 different technologies in the context of security
and defense. There is always a lot of change in these programs - a lot of projects
starting new and a lot of projects running out. One task of our research group is find-
ing new R&D-areas for this program. New ideas or new inventions are a basis for
a new R&D-area. That means for planning new R&D-areas it is necessary to iden-
tify a lot of new technological ideas and inventions from the scientific community
(Ripke et al. (1972)). Up to now, the identification of new ideas and inventions in un-
structured texts is done manually (that means by humans) without the support of text
mining. Therefore in this paper we will describe the theoretical background of the
text mining approach to discover (semi-) automatically textual patterns representing
new ideas and inventions in unstructured technological texts.
414 Dirk Thorleuchter
Hotho (2004) describes the characteristics that are used to measure the quality of
these textual patterns extracted by knowledge discovery tasks. The characteristics are
comprehensibility and novelty to the users and usefulness for a task. In this paper the
users are program planers or researchers and the task is to find ideas and inventions
which can be used as basis for new R&D-areas.
It is known from the cognition research that analysis and evaluation of textual
information requires the knowledge of a context (Strube (2003)). The selection of the
context depends on the users and the tasks. Referring to our users and our task, we
have on one hand textual information about world wide existing technological R&D-
projects (furthermore this is called "raw information"). This information contains a
lot of new technological ideas and inventions. New means, that ideas and inventions
are unknown to the user (Ipsen (2002)). On the other hand we have descriptions
about own R&D-projects. This represents our knowledge base and furthermore this
is called "context information". Ideas and inventions in the context information are
already known to the user.
To create a text mining approach for finding ideas and inventions inside the raw
information we have to create a common structure for raw and context information
first. This is necessary for the comparison between raw and context information e.g.
to distinguish new (that means unknown) ideas and inventions from known ideas and
inventions.
In short we have to do 2 steps: 1. Create a common structure for raw and context
information as a basis for the text mining approach. 2. Create a text mining approach
for finding new, comprehensible and useful ideas and inventions inside the raw in-
formation. Below we describe step 1 and 2 in detail.
2 A common structure for raw and context information
In order to perform knowledge discovery tasks (e.g. finding ideas and inventions) it
is required that raw information and context information have to be structured and
formatted in a common way as described above. In general the structure should be
rich enough to allow for interesting knowledge discovery operations and it should be
simple enough to allow an automatically converting of all kind of textual information
in a reasonable cost as described by Feldman et al.(1995).
Raw information is stored in research papers, articles in technical periodicals,
reports, documents, databases, web pages etc. That means raw information contains
a lot of different structures and formats. Normally context information also contains
different structures and formats. Converting all structures and formats to a common
structure and format for raw and context information by keeping all structure infor-
mation available costs plenty of work. Therefore our structure approach is to convert
all information into plain text format. That means firstly we destroy all existing struc-
tures and secondly build up a new common structure for raw and context information.
The new structure should refer to the relationship between terms or
term-combinations (Kamphusmann (2002)). In this paper we realize this by creating
Finding New Technological Ideas and Inventions 415
sets of domain specific terms which occur in the context of a term or a combination
of terms. For the structure formulation we define the term unit as word.
First we create a set of domain specific terms.
Definition 1. Let (a text) T =[Z
1
, ,Z
n
] be a list of terms (words) Z
i
in order of
appearance and let n ∈ N be the number of terms in T and i ∈ [1, ,n].Let6 =
{
˜
Z
1
, ,
˜
Z
m
}
be a set of domain specific stop terms (Lustig (1986)) and let m ∈ Nbe
the number of terms in 6. : - the set of domain specific terms in text T - is defined
as the relative complement Twithout6. Therefore:
: = T\6 (1)
For each Z
i
∈ : we create a set of domain specific terms which occur in the
context of term Z
i
.
Definition 2. Let l ∈ N be a context l ength of term Z
i
that means the maximum dis-
tance between Z
i
andatermZ
j
in text T. Let the distance be the number of terms
(words) which occur between Z
i
and Z
j
including the term Z
j
and let j ∈[1, ,n]. )
i
is defined as a set of those domain specific terms which occur in an l-length context
of term Z
i
in text T:
)
i
=
Z
j
(Z
j
∈ :) ∧(
|
i − j
|
≤ l) ∧(Z
i
≡ Z
j
)
(2)
For each combination of terms in )
i
we create a set of domain specific terms
which occur in the context of this combination of terms.
Definition 3. Let G
p
∈ : be a term in a list of terms with number p ∈ [1, ,z].Let
G
1
, ,G
z
be a list of terms - in further this will be called term-combination - with
G
p
≡ G
q
∀p ≡ q ∈ [1, ,z] that occurs together in an l-length context of term G
1
in
text T . Let z ∈ N be the number of terms in the term-combination G
1
, ,G
z
. ;
T
G
1
, ,G
z
is defined as the set of domain specific terms which occur together with the term-
combination G
1
, ,G
z
in an l-length context of term G
1
in text T:
;
T
G
1
, ,G
z
=
)
i
\
z
p=2
G
p
G
1
= Z
i
∧
z
p=2
G
p
⊂ )
i
(3)
In the Figure 1 an example for the relationships in set ;
T
G
1
, ,G
z
is presented.
The term-combination (sensor, infrared, uncooled) has a relationship to the term-
combination (focal, array, plane) because uncooled infrared sensors can be built by
using the focal plane array technology.
The text T could be a) the textual raw information or b) the textual context infor-
mation. As result we get in case of a) ;
raw
G
1
, ,G
z
and in case of b);
context
G
1
, ,G
z
.
Definition 4. To identify terms or term-combinations in the raw information which
also occur in the context information - that means the terms or term-combinations
are known to the user - we define ;
known
G
1
, ,G
z
as the set of terms which occur in ;
raw
G
1
, ,G
z
and ;
context
G
1
, ,G
z
:
;
known
G
1
, ,G
z
= ;
raw
G
1
, ,G
z
∩;
context
G
1
, ,G
z
(4)
416 Dirk Thorleuchter
Fig. 1. Example for the relationships in ;
T
G
1
, ,G
z
: Uncooled infrared sensors can be build by
using the focal plane array technology.
3 Relevant aspects for the text mining approach from technique
philosophy
The text mining approach follows the statements of technique philosophy (Rohpohl
(1996)). Below we describe some relevant aspects of the statements and some spe-
cific conclusions for our text mining approach.
a) A technological idea or invention represents not only a new mean, but a new
purpose and mean combination. That means to find an idea or invention it is
necessary to identify a mean and an appertaining purpose in the raw information.
Appertaining means that purpose and mean shall occur together in an l-length
context. Therefore for our text mining approach we firstly want to identify a
mean and secondly we want to identify an appertaining purpose or vice versa.
b) Purposes and means can be exchanged. That means a purpose can become a mean
in a specific context and vice versa. Example: A raw material (mean) is used to
create an intermediate product (purpose). The intermediate product (mean) is
then used to produce a product (purpose). In this example the intermediate prod-
uct changes from purpose to mean because of the different context. Therefore
for our text mining approach it is possible to identify textual patterns represent-
ing means or purposes. But it is not possible to distinguish between means and
purposes without the knowledge of the specific context.
c) A purpose or a mean is represented by a technical term or by several technical
terms. Therefore purposes or means can be represented by a combination of do-
main specific terms (e.g. G
1
, ,G
z
) which occur together in an l-length context.
The purpose-mean combination is a combination of 2 term-combinations and it
also occurs in an l-length context as described in 3 a). For the formulation a term-
combination G
1
, ,G
z
represents a mean (a purpose) only if ;
raw
G
1
, ,G
z
≡, which
means there are further domain-specific terms representing a purpose (a mean)
which occur in an l-length context together with the term-combination G
1
, ,G
z
Finding New Technological Ideas and Inventions 417
in the raw information.
d) To find an idea or invention that is really new to the user, the purpose-mean
combination must be unknown to the user. That means a mean and an appertain-
ing purpose in the raw information must not occur as mean and as appertaining
purpose in the context information. For the formulation the term-combination
G
1
, ,G
z
from 3 c) represents a mean (a purpose) in a new idea or invention only
if ;
known
G
1
, ,G
z
= , which means there are no further domain-specific terms which
occur in an l-length context together with the term-combination G
1
, ,G
z
in the
raw and in the context information.
e) To find an idea or invention that is comprehensible to the user, either the purpose
or the mean must be known to the user. That means one part (a purpose or a mean)
of the new idea or invention is known to the user and the other part is unknown.
The user understand the known part because it is also a part of a known idea or
invention that occurs in the context information and therefore he gets an access
to the new idea or invention in the raw information.
That means the terms representing either the purpose or the mean in the raw
information must occur as purpose or mean in the context information. For the
formulation the term-combination G
1
, ,G
z
from 3 d) represents a mean (a pur-
pose) in a comprehensible idea or invention only if ;
context
G
1
, ,G
z
≡, which means
G
1
, ,G
z
is known to the user and there are further domain-specific terms repre-
senting a purpose (a mean) which occur in an l-length context together with the
term-combination G
1
, ,G
z
in the context information.
f) Normally an idea or an invention is useful for a specific task. Transferring an idea
or an invention to a different task makes it sometimes necessary that the idea or
invention has to be changed to become useful for the new task. To change an idea
or invention you have to change either the purpose or the mean. That is because
the known term-combination G
1
, ,G
z
from 3 e) must not be changed, otherwise
it will become unknown to the user and then the idea or invention is not compre-
hensible to the user as described in 3 e).
g) After some evaluation we get the experience that for finding ideas and inven-
tions the number of known terms (e.g. representing a mean) and the number of
unknown terms (e.g. representing the appertaining purposes) shall be well bal-
anced. Example: one unknown term among many known terms often indicates
that an old idea got a new name. Therefore the unknown term is probably not a
mean or a purpose. That means the probability that G
1
, ,G
z
is a mean or a pur-
pose increases when z is close to the cardinality of ;
raw
G
1
, ,G
z
.
h) There are often domain specific stop terms (like better, higher, quicker, inte-
grated, minimized etc.) which occur with ideas and inventions. They point to
a changing purpose or a changing mean and can be indicators for ideas and in-
418 Dirk Thorleuchter
ventions.
i) An identified new idea or invention can be a basis for further new ideas and
inventions. That means all ideas and inventions that are similar to the identified
new idea and invention are also possible new ideas and inventions.
4 A text mining approach for finding new ideas and inventions
In this paper we want to create a text mining approach by applying point 3 a) to 3 g).
Further we want to prove the feasibility of our text mining approach.
Firstly we want to identify a mean and secondly we want to identify an apper-
taining purpose below as described in 3 a). The other case - firstly identify a purpose
and secondly identify an appertaining mean - is trivial because of the purpose-mean
dualism described in 3 b).
Definition 5. We define p(;
raw
G
1
, ,G
z
) as the probability that the term-combination
G
1
, ,G
z
in the raw information is a mean. That means whether z is close to the
cardinality of ;
raw
G
1
, ,G
z
or not as described in 3 g):
p(;
raw
G
1
, ,G
z
)=
⎧
⎪
⎪
⎪
⎨
⎪
⎪
⎪
⎩
;
raw
G
1
, ,G
z
z
z >
;
raw
G
1
, ,G
z
z
;
raw
G
1
, ,G
z
z ≤
;
raw
G
1
, ,G
z
(5)
The user determines a minimum probability p
min
. For the text mining approach
the term-combinations G
1
, ,G
z
are means only if
a) ;
raw
G
1
, ,G
z
≡as described in 3 c),
b) ;
known
G
1
, ,G
z
= as described in 3 d) to get a new idea or invention,
c) ;
context
G
1
, ,G
z
≡as described in 3 e) to get a comprehensible idea or invention and
d) p(;
raw
G
1
, ,G
z
) ≥ p
min
as described in 3 g).
For each of these term-combinations we collect all appertaining purposes (that
means the combinations of all further terms) which occur in an l-length context to-
gether with G
1
, ,G
z
in the raw information.
We present each G
1
, ,G
z
as a known mean and all appertaining unknown pur-
poses to the user. The user selects the suited purposes for his task or he combines
some purposes to a new purpose. That means he changes the purpose to become use-
ful for his task as described in 3 f). Additionally it is possible that the user changes
known means to known purposes and appertaining purposes to appertaining means
Finding New Technological Ideas and Inventions 419
as described in 3 b) because at this point the user gets the knowledge of the specific
context.
With this selection the user gets the purpose-mean combination that means he
gets an idea or invention. This idea or invention is novel to him because of 3 d) and
it is comprehensible to him because of 3 e). Further it is useful for his application
because the user selects the suited purposes for his task.
5 Evaluation and outlook
We have done a first evaluation with a text about R&D-projects from the USA as raw
information (Fenner et al. (2006)), a text about own R&D-projects as context infor-
mation (Thorleuchter (2007)), a stop word list created for the raw information and
the parameter values l = 8 and p
min
= 50%. The aim is to find new, comprehensible
and useful ideas and inventions in the raw information. According to human experts
the number of these relevant elements - the so-called "ground truth" for the evalua-
tion - is eighteen. That means eighteen ideas or inventions can be used as basis for
new R&D-areas. With the text mining approach we extracted about fifty patterns (re-
trieved elements) from the raw information. The patterns have been evaluated by the
experts. Thirteen patterns are new, comprehensible and useful ideas or inventions that
means thirteen from fifty patterns are relevant elements. Five new, comprehensible
and useful ideas or inventions are not found by the text mining approach. Therefore,
as result we get a precision value of about 26% and a recall value of about 72%. This
is not representative because of the small number of relevant elements but we think
this is above chance and it is sufficient to prove the feasibility of the approach.
For future work firstly we will enlarge the stop word list to a general stop word
list for technological texts and optimize the parameters concerning the precision and
recall value. Secondly we will enlarge the text mining approach with further thoughts
e.g. the two thoughts described in 3 h) and 3 i). The aim of this work shall be to get
better results for the precision and recall value. Thirdly we will implement the text
mining approach to a web based application. That will help the users to find new,
comprehensible and useful ideas and inventions with this text mining approach. Ad-
ditionally with this application it will be easier for us to do a representative evalua-
tion.
6 Acknowledge
This work was supported by the German Ministry of Defense. We thank Joachim
Schulze for his constructive technical comments and Jörg Fenner for helping collect
the raw and context information and evaluate the text mining approach.
420 Dirk Thorleuchter
References
FELDMAN, R. and DAGAN, I. (1995): Kdt - knowledge discovery in texts. In: Proceedings of
the First International Conference on Knowledge Discovery (KDD). Montreal, 112–113.
FENNER, J. and THORLEUCHTER, D. (2006): Strukturen und Themengebiete der mittel-
standsorientierten Forschungsprogramme in den USA. Fraunhofer INT’s edition, Eu-
skirchen, 2.
HOTHO, A. (2004): Clustern mit Hintergrundwissen. Univ. Diss., Karlsruhe, 29.
IPSEN, C. (2002): F&E-Programmplanung bei variabler Entwicklungsdauer. Verlag Dr. Ko-
vac, Hamburg, 10.
KAMPHUSMANN, T. (2002): Text-Mining. Symposion Publishing, Düsseldorf, 28.
LUSTIG, G. (1986): Automatische Indexierung zwischen Forschung und Anwendung. Georg
Olms Verlag, Hildesheim, 92.
RIPKE, M. and STÖBER, G. (1972): Probleme und Methoden der Identifizierung potentieller
Objekte der Forschungsförderung. In: H. Paschen and H. Krauch (Eds.): Methoden und
Probleme der Forschungs- und Entwicklungsplanung. Oldenbourg, München, 47.
ROHPOHL, G. (1996): Das Ende der Natur. In: L. Schäfer and E. Sträker (Eds.): Naturauf-
fassungen in Philosophie, Wissenschaft und Technik. Bd. 4, Freiburg, München, 151.
STRUBE, G. (2003): Menschliche Informationsverarbeitung. In: G. Görz, C R. Rollinger and
J. Schneeberger (Eds.): Handbuch der Künstlichen Intelligenz.4.Auflage, Oldenbourg,
München, 23–28.
THORLEUCHTER, D. (2007): Überblick über F&T-Vorhaben und ihre Ansprechpartner im
Bereich BMVg. Fraunhofer Publica, Euskirchen, 2–88.
From Spelling Correction to Text Cleaning – Using
Context Information
Martin Schierle
1
, Sascha Schulz
2
, Markus Ackermann
3
1
DaimlerChrysler AG, Germany
2
Humboldt-University, Berlin, Germany
3
University of Leipzig, Germany
Abstract. Spelling correction is the task of correcting words in texts. Most of the available
spelling correction tools only work on isolated words and compute a list of spelling sugges-
tions ranked by edit-distance, letter-n-gram similarity or comparable measures. Although the
probability of the best ranked suggestion being correct in the current context is high, user
intervention is usually necessary to choose the most appropriate suggestion (Kukich, 1992).
Based on preliminary work by Sabsch (2006), we developed an efficient context sensi-
tive spelling correction system dcClean by combining two approaches: the edit distance based
ranking of an open source spelling corrector and neighbour co-occurrence statistics computed
from a domain specific corpus. In combination with domain specific replacement and abbre-
viation lists we are able to significantly improve the correction precision compared to edit
distance or context based spelling correctors applied on their own.
1 Introduction
In this paper we present a domain specific and context-based text preparation com-
ponent for processing noisy documents in the automobile quality management. More
precisely the task is to clean texts coming from vehicle workshops, being typed in at
front desks by service advisors and expanded by technicians. Those texts are always
written down under pressure of time, using as few words as possible and as many
words as required to describe an issue. Consequently this kind of textual data is ex-
tremely noisy, containing common language, technical terms, lots of abbreviations,
codes, numbers and misspellings. More than 10% of all terms are unknown with
respect to commonly used dictionaries.
In literature basically two approaches are discussed to handle text cleaning: dic-
tionary based algorithms like Aspell work in a semi-automatic way by presenting
suggestions for unknown words, which are not in a given dictionary. For all of those
words a list of possible corrections is returned and the user has to check the context
to choose the appropriate one. This is applicable when supporting users in creating
398 Martin Schierle, Sascha Schulz, Markus Ackermann
single documents. But for automatically processing large amounts of textual data this
is impossible.
Context based spelling correction systems like WinSpell or IBMs csSpell only
make use of context information. The algorithms are trained on a certain text corpus
to learn probabilities of word occurrences. When analysing a new document for mis-
spellings every word is considered as being suspicious. A context dependent proba-
bility for the appearance is calculated and the most likely word is applied. A more
detailed introduction into context-based spelling correction can be found in Golding
and Roth (1995), Golding and Roth (1999) and Al-Mubaid and Trümper (2001).
In contrast to existing work dealing either with context information or using dic-
tionaries in our work we combine both approaches to increase efficiency as well as to
assure high accuracy. Obviously, text cleaning is a lot more then just spelling correc-
tion. Therefore we add technical dictionaries, abbreviation lists, language recognition
techniques and word splitting and merging capabilities to our approach.
2 Linguistics and context sensitivity
This section gives a brief introduction into underlying correction techniques. We
distinguish two main approaches: linguistic and context based algorithms. Phonetic
codes are a linguistic approach to pronunciation and are usually based on initial ideas
of Russell and Odell. They developed the Soundex code, which maps words with sim-
ilar pronunciations by assigning numbers to certain groups of letters. Together with
the first letter of the word the first three digits result in the Soundex code where the
same codes mean same pronunciation. Current developments are the Metaphone and
the improved Double Metaphone (Phillips, 2000) algorithm by Lawrence Philips, the
latter one is currently used by the ASpell algorithm. Edit distance based algorithms
are a second member of linguistic methods. They calculate word distances by count-
ing letter-wise transformation steps to change one word into another. One of the best
known member is the Levenshtein algorithm, which uses the three basic operations
replacement, insertion and deletion to calculate a distance score for two words.
Context based correction methods usually take advantage of two statistical mea-
sures: word frequencies and co-occurrences. The word frequency f(w) for a word w
counts the frequency of its appearance within a given corpus. This is done for ev-
ery unique word (or token) using the raw text corpus. The result is a list of unique
words which can be ordered and normalised with the total number of words. With
co-occurrences we refer to a pair of words, which commonly appear in similar con-
texts. Assuming statistical independence between the occurrence of two words w
1
and w
2
, the estimated probability P
E
(w
1
w
2
) of them occurring in the same context
can be easily calculated with:
P
E
(w
1
w
2
)=P(w
1
)P(w
2
) (1)
If the common appearance of two words is significantly higher than expected they
can be regarded as co-occurrent. Given a corpus and context related word frequencies
From Spelling Correction to Text Cleaning – Using Context Information 399
the co-occurrence measure can be calculated using pointwise mutual information or
likelihood ratios. We utilize pointwise mutual information with a minimum threshold
filtering.
Cooc(w
1
,w
2
)=log
P(w
1
w
2
)
P(w
1
)P(w
2
)
(2)
Depending on the size of a given context, one can distinguish between three kinds
of co-occurrences. Sentence co-occurrences are pairs of words which appear signifi-
cantly often together within a sentence, neighbour co-occurrences occur significantly
often side by side and window-based co-occurrences are normally calculated within
a fixed window size. A more detailed introduction into co-occurrences can be found
in Manning and Schütze (1999) and Heyer et al. (2006).
3 Framework for text preparation
Before presenting our approach we will discuss requirements which we identified as
being important for text preparation. They are based on general considerations but
contain some application specific characteristics. In the second part we will explain
our framework for a joint text preparation.
3.1 General considerations
Because we focus on automatically processing large amounts of textual documents
we have to ensure fast processing and minimal human interaction. Therefore, after
aconfiguration process the system must be able to clean texts autonomously. The
correction error has to be minimized, but in contradiction to evaluations found in the
literature we propose a very conservative correction strategy. If there is an unknown
word it will only be corrected when certain thresholds are reached. As one can see
during the evaluation we rather take a loss in recall than inserting an incorrect word.
To detect words, which have to be corrected, we rely on dictionaries. If a word cannot
be found in (general and custom prepared) dictionaries we regard it as suspicious.
This is different to pure context based approaches; for instance Golding and Roth
(1995) consider every word as suspicious. But this leads to two problems: first the
calculation is computational complex and second we imply a new error probability
of changing a correct word to an incorrect one. Even if the probability is below 0.1%,
regarding 100.000 terms it would result in 100 misleading words.
Our proposed correction strategy can be seen as an interaction between linguistic
and context based approaches, extended by word frequency and manually created
replacement lists. The latter ones are essential to expand abbreviations, harmonize
synonyms, and speed-up replacements of very common spelling errors.
3.2 Cleaning workflow
Automatic text cleaning covers several steps which depend on each other and should
obviously be processed in a row. We developed a sequential workflow, consisting
400 Martin Schierle, Sascha Schulz, Markus Ackermann
of independent modules, which are plugged into IBMs Unstructured Information
Management Architecture (UIMA) framework. This framework allows to imple-
ment analysis modules for unstructured information like text documents and to plug
them into a run-time environment for execution. The UIMA-Framework takes care
about resource management, encapsulation of document data and analysis results and
even distribution of algorithms on different machines. For processing documents, the
Fig. 1. dcClean workflow
UIMA framework uses annotations, the original text content is never changed, all
correction tasks are recorded as annotations. The dcClean workflow (figure 1) con-
sists of several custom-developed UIMA modules which we will explain in detail
according to their sequence.
Tokenizer: The tokenizer is the first module, splitting the text into single tokens.
It can recognise regular words, different number pattern (such as dates, mileages,
money values), domain dependent codes and abbreviations. The challenge is to han-
dle non-letter characters like slashes or dots. For example a slash between two tokens
can indicate a sentence border, an abbreviation (e.g. "r/r" = "right rear") or a number
pattern. To handle all different kinds of tokens we parametrize the tokenizer with a
set of regular expressions.
Language recognition: Because all of the following modules use resources
which might be in different languages, the text language has to be recognised be-
fore further processing. Therefore we included the LanI library from the University
of Leipzig. Based on characteristic word frequency lists for different languages the
library determines the language for a given document by comparing the tokens to
the lists. Because we process domain specific documents, the statistical properties
are different in comparison to regular language specific data. Thus it is important to
include adequate term frequency lists.
Replacements: This module handles all kinds of replacements, because we
deal with a lot of general and custom abbreviations and a pure spelling correction
cannot handle this. We manually created replacement lists R for abbreviations, syn-
onyms, certain multi-word-terms and misspellings, which are frequent but spelling
correction algorithms fail to correct them properly. The replacement module works
on word tokens, uses language dependent resources and incorporates context infor-
mation. This is very important for the replacement of ambiguous abbreviations. If
the module finds for example the word "lt", this can mean both "light" and "left".
To handle this we look-up the co-occurrence levels of each possible replacement as
From Spelling Correction to Text Cleaning – Using Context Information 401
left neighbour of the succeeding word Cooc(w, w
right
) and as right neighbour of the
preceding word Cooc(w, w
left
). The result is the replacement w
with the maximum
sum of co-occurrence level to the left neighbour word w
left
and to the right neighbour
word w
right
.
CoocSum(w)=Cooc(w, w
left
)+Cooc(w, w
right
) (3)
w
= argmax
w∈R
(CoocSum(w)) (4)
Merging: To merge words, which where split by an unintended blank character,
this module sequentially checks two successive words for correct spelling, if one or
both words are not contained in the dictionary but the joint word is, the two words
get annotated as joint representation.
Splitting and spelling correction: The last module of our workflow treats
spelling errors and word splittings. To correct words which are not contained in the
dictionary, dcClean uses the Java based ASpell implementation Jazzy and incorpo-
rates word co-occurrences, word frequencies (both were calculated using a reference
corpus), a custom developed weighting schema and a splitting component. If the
Fig. 2. Spelling correction example
module finds an unknown word w
m
, it passes it to the ASpell component. The ASpell
algorithm creates suggestions with the use of phonetic codes (Double Metaphone al-
gorithm) and edit distances (Levenshtein distance). Therefore the algorithm creates
asetS
ASpell
containing all words of dictionary D which have the same phonetic code
as the potential misspelling w
m
or as one of its variants v ∈V with an edit distance
of one.
V = {v|Edit(v,w
m
) <= T
edit1
} (5)
S
ASpell
= {w|(Phon(w)=Phon(w
m
) ∨∃v : Phon(v)=Phon(w))} (6)
Then set S
ASpell
is filtered according to edit based threshold T
edit2
:
S
ASpell
= {w|w ∈ S
ASpell
∧Edit(w, w
m
) < T
edit2
} (7)
A context based set of suggestions S
Cooc
is generated using co-occurrence statistics.
Therefore we use a similar technique as during the replacements: this time we look-
up all co-occurrent words as left neighbour of the succeeding word Cooc(w,w
right
)
and as right neighbour of the preceding word Cooc(w,w
left
) of the misspelling.
S
Cooc
= {w|Cooc(w,w
left
) > T
Cooc
∨Cooc(w, w
right
) > T
Cooc
} (8)
402 Martin Schierle, Sascha Schulz, Markus Ackermann
The co-occurrence levels are summed up and filtered by Levenshtein distance mea-
sure to ensure a certain word based similarity.
S
Cooc
= {w|w ∈ S
Cooc
∧Edit(w, w
m
) < T
edit3
} (9)
The third set of suggestions S
Split
is created using a splitting algorithm. This algo-
rithm provides the capability to split words, which are unintentionally written as one
word. Therefore the splitting algorithm creates a set of suggestions S
Split
, containing
all possible splittings of word w into two parts s
w
1
and s
w
2
with s
w
1
∈D and s
w
2
∈D.To
select the best matching correction ˜w the three sets of suggestions S
ASpell
, S
Cooc
and
S
Split
are joined
S = S
ASpell
S
Cooc
S
Split
(10)
and weighted according to their co-occurrence statistics, or – if there are no signifi-
cant co-occurrents – according to their frequencies. For weighting the splitting sug-
gestions we use the average frequencies or co-occurrence measures of both words.
The correction ˜w is the element with the maximum weight.
Weight(w)=
Cooc(w), if ∃w
∈ S : Cooc(w
) > T
Cooc
,
f(w) else
(11)
˜w = argmax
w∈S
(Weight(w)) (12)
4 Experimental results
To evaluate the pure spelling correction component of our framework we just con-
sider error types which other spellcheckers can handle as well, which excludes merg-
ing, splitting or replacing words. We use a training corpus of one million domain
specific documents (500MB of textual data) to calculate word frequencies and co-
occurrence statistics. The evaluation is performed on a test set consisting of 679
misspelled terms including their context.
We compared dcClean with the dictionary based Jazzy spellchecker based on the
ASpell algorithm and IBMs context based spellchecker csSpell. To get comparable
results we set the Levenshtein distance threshold for dcClean and Jazzy to the same
value, the confidence threshold for csSpell is set to 10% (This threshold is based
on former experiments.). During the evaluation we counted words which were cor-
rected accurately, words which were corrected, but the correction was mistaken, and
words which were not changed at all (As explained in section 3.1 changes of correct
words to incorrect ones are not considered, because this can be avoided by the use of
dictionaries.).
As can be seen in figure 3 dcClean outperforms both spellcheckers using either
dictionaries or context statistics. The improvement in relation to Jazzy is due to the
fact, that the Aspell algorithm just returns a set of suggestions. For this evaluation
we always chose the best suggestion. But sometimes there are several similar ranked
suggestions and in a certain number of cases the best result is not the one that fits
From Spelling Correction to Text Cleaning – Using Context Information 403
0%
10%
20%
30%
40%
50%
60%
70%
80%
90%
100%
correct incorrect no change
dcClean
Jazzy/Aspell
csSpell
Fig. 3. Spelling correction
0%
10%
20%
30%
40%
50%
60%
70%
80%
90%
100%
correct incorrect no change
dcClean
JazzyCustDictRS
JazzyCustDict
JazzyOrig
Fig. 4. Entire text cleaning workflow
the context. However, when solely choosing corrections from the context as done
by csSpell, even a very low confidence threshold of 10% leads to the fact that most
words are not changed at all. A reason for this are our domain specific documents
where misspellings are sometimes as frequent as the correct word, or words are con-
tinuously misspelled.
To explain the need for a custom text cleaning workflow we show the improve-
ments of our dcClean framework in comparison with a pure dictionary based spelling
correction. Therefore we set up Jazzy with three different configurations: (1) using
a regular English dictionary, (2) using our custom prepared dictionary and (3) using
our custom prepared dictionary, splittings and replacements. The test set contains 200
documents with 769 incorrect tokens and 9137 tokens altogether. Figure 4 shows that
Jazzy with a regular dictionary performs very poorly. Even with our custom dictio-
nary there are only slight improvements. The inclusion of replacement lists leads to
the biggest enhancements. This can be explained by the amount of abbreviations and
technical terms used in our data. But dcClean with its context sensitivity outperforms
even this.
5 Conclusion and future work
In this paper we explained how to establish an entire text cleaning process. We
showed how the combination of linguistic and statistic approaches improves not
only spelling correction but also the entire cleaning task. The experiments illustrated
that our spelling correction component outperformed dictionary or context based
approaches and that the whole cleaning workflow performs better than using only
spelling correction.
In future work we will try to utilise dcClean for more languages than English,
which might be especially difficult for languages like German, that have many com-
pound words and a rich morphology. We will also extend our spelling correction
component to handle combined spelling errors, like two words which are misspelled
and accidentally written as one word. Another important part of our future work will
be a more profound analysis of the suggestion weighting algorithm. A combination
of frequency, co-occurrence level and Levenshtein distance may allow further im-
provements.
404 Martin Schierle, Sascha Schulz, Markus Ackermann
References
AL-MUBAID, H. and TRÜMPER, K. (2006): Learning to Find Context-Based Spelling
Errors, In: E. and Felici. G. (Eds.):Data Mining and Knowledge Discovery Ap-
proaches Based on Rule Induction Techniques. Triantaphyllou. Massive Computing Se-
ries, Springer, Heidelberg, Germany, 597–628.
ELMI, M. A. and EVENS, M. (1998): Spelling correction using context. In: Proceedings of
the 17th international Conference on Computational Linguistics - Volume 1 (Montreal,
Quebec, Canada). Morristown, NJ, 360–364.
GOLDING, A. R (1995): A Bayesian hybrid method for context-sensitive spelling correction.
In: Proceedings of the Third Workshop on Very Large Corpora, Boston, MA.
GOLDING, A. R., and ROTH, D. (1999): A Winnow based approach to context-sensitive
spelling correction. Machine Learning 34(1-3):107-130. Special Issue on Machine
Learning and Natural Language.
HEYER, G., QUASTHOFF, U. and WITTIG, T. (2006): Text Mining: Wissensrohstoff Text –
Konzepte, Algorithmen, Ergebnisse. W3L Verlag, Herdecke, Bochum.
KUKICH, K. (1992). Techniques for Automatically Correcting Words in Text. ACM Comput.
Surv. 4:377–439.
MANNING, C. and SCHÜTZE, H. (1999): Foundations of Statistical Natural Language Pro-
cessing. The M.I.T. Press, Cambridge (Mass.) and London. 151–187.
PHILIPS, L. SABSCH, R. (2006): Kontextsensitive und domänenspezifische Rechtschreibko-
rrektur durch Einsatz von Wortassoziationen. Diplomarbeit, Universität Leipzig.
Investigating Classifier Learning Behavior with
Experiment Databases
Joaquin Vanschoren and Hendrik Blockeel
Computer Science Dept., K.U.Leuven,
Celestijnenlaan 200A, 3001 Leuven, Belgium
Abstract. Experimental assessment of the performance of classification algorithms is an im-
portant aspect of their development and application on real-world problems. To facilitate this
analysis, large numbers of such experiments can be stored in an organized manner and in com-
plete detail in an experiment database. Such databases serve as a detailed log of previously
performed experiments and a repository of verifiable learning experiments that can be reused
by different researchers. We present an existing database containing 250,000 runs of classi-
fier learning systems, and show how it can be queried and mined to answer a wide range of
questions on learning behavior. We believe such databases may become a valuable resource
for classification researchers and practitioners alike.
1 Introduction
Supervised classification is the task of learning from a set of classified training exam-
ples (x,c(x)), where x ∈ X (the instance space) and c(x) ∈C (a finite set of classes),
a classifier function f : X →C such that f approximates c (the target function) over
X. Most of the existing algorithms for learning f are heuristic in nature, and try to
(quickly) approach c by making some assumptions that may or may not hold for the
given data. They assume c to be part of some designated set of functions (the hy-
pothesis space), deem some functions more likely than others, and strictly consider
consistency with the observed training examples (not with X as a whole). While there
is theory relating such heuristics to finding c, in many cases this relationship is not
so clear, and the utility of a certain algorithm needs to be evaluated empirically.
As in other empirical sciences, experiments should be performed and described
in such a way that they are easily verifiable by other researchers. However, given the
fact that the exact algorithm implementation used, its chosen parameter settings, the
used datasets and the experimental methodology all influence the outcome of an ex-
periment, it is practically not self-evident to completely describe such experiments.
Furthermore, there exist complex interactions between data properties, parameter
settings and the performance of learning algorithms. Hence, to thoroughly study
these interactions and to assess the generality of observed trends, we need a suffi-
422 Joaquin Vanschoren and Hendrik Blockeel
ciently large sample of experiments, covering many different conditions, organized
in a way that makes their results easily accessible and interpretable.
For these reasons, Blockeel (2006) proposed the use of experiment databases:
databases describing a large number of learning experiments in complete detail, serv-
ing as a detailed log of previously performed experiments and an (online available)
repository of learning experiments that can be reused by different researchers. Bloc-
keel and Vanschoren (2007) provide a detailed account of the advantages and disad-
vantages of experiment databases, and give guidelines for designing them. As a proof
of the concept, they present a concrete implementation that contains a full descrip-
tion of the experimental conditions and results of 250,000 runs of classifier learning
systems, together with a few examples of its use and results that were obtained from
it.
In this paper we provide a more detailed discussion of how this database can be
used in practice to store the results of many learning experiments and to obtain a clear
picture of the performance of the involved algorithms and the effects of parameter
settings and dataset characteristics. We believe that this discussion may be of interest
to anyone who may want to use this database for their own purposes, or set up a
similar databases for their own research.
We describe the structure of the database in Sect. 2 and the experiments in Sect.
3. In Sect. 4 we illustrate the power of this database by showing how SQL queries
and data mining techniques can be used to investigate classifier learning behavior.
Section 5 concludes.
2 A database for classification experiments
To efficiently store and allow queries about all aspects of previously performed clas-
sification experiments, the relationships between the involved learning algorithms,
datasets, experimental procedures and results are captured in the database structure,
shown in Fig. 1. Since many of these aspects are parameterized, we use instantiations
to uniquely describe them. As such, an
Experiment
(central in the figure) consists
of instantiations of the used learner, dataset and evaluation method.
First, a
Learner instantiation
points to a learning algorithm (
Learner
),
which is described by the algorithm name, version number, a url where it can be
downloaded, and some generally known or calculated properties (Van Someren
(2001), Kalousis & Hilario (2000)), like the used approach (e.g. neural networks)
or how susceptible it is to noise. Then, if an algorithm is parameterized, the param-
eter settings used in each learner instantiation (one of which is set as default) are
stored in table
Learner_parval
. Because algorithms have different numbers and
kinds of parameters, we store each parameter value assignment in a different row (in
Fig. 1 only two are shown). A
Learner_parameter
is described by the learner it
belongs to, its name and a specification of sensible or suggested values, to facilitate
experimentation.
Secondly, the used
Dataset
, which can be instantiated with a randomization of
the order of its attributes or examples (e.g. for incremental learners), is recorded by
Investigating Classifier Learning Behavior with Experiment Databases 423
Learner parval
liid
pid
value
15 64 0.25
15 65 2
Learner parameter
pid
lid
name
alias learner
inst kernel inst default min
max
(sugg)
15 64
C conf. threshold false false
0.25 0.01 0.99
15 65
M
min nr inst/leaf
false false
2220
Learner inst
liid lid is default
15 13 true
Learner
lid
name
version url class
(charact)
15
J48
1.2
http://
tree
Machine
mach id corr fact
(props)
ng-06-04
1
Experiment
eidlearner inst data inst eval meth
type
status
priority
machine
error
(backgr
info)
13 15 1 1
classificat. done
9
ng-06-04
Data inst
diid did randomization value
1 230
Dataset
did
name
origin
url class
index size def acc
(charact)
230
anneal uci
http://
-1 898 0.7617
Eval meth inst
emiid method
1
cross-validation
Eval meth parval
emiid
param
value
1
nbfolds
10
Testset of
trainset
testset
Evaluation
eid
cputime
memory
pred
acc
mn
abs err
conf
mat
(metrics)
13 0:0:0:0.55
226kb
0.9844 0.0056
[[.],[.],. . . ]
Prediction
eid
inst class
prob
predicted
13 1 3 0.7235 true
Fig. 1. A simplified schema of the experiment database.
its name, download url(s), the index of the class attribute and some information on
its origin (e.g. to which repository it belongs or how it was generated artificially).
In order to investigate whether the performance of an algorithm is linked to certain
kinds of data, a large set of dataset characterization metrics is stored, most of which
are described in Peng et al. (2002). These can be useful to help gain insight into an
algorithm’s behavior and, conversely, assess a learner’s suitability for handling new
learning problems
1
.
Finally, we must store an evaluation of the experiments. The evaluation method
(e.g. cross-validation) is stored together with its parameters (e.g. the number of
folds). If a dataset is divided into a training set and a test set, this is defined in table
Testset_of
. The result of the evaluation of each experiment is described in table
Evaluation
by a wide range of evaluation metrics for classification, including the
contingency tables. To compare cpu times, a factor describing the relative speed of
the used
Machine
is stored as part of the machine description. The last table in Fig. 1
stores the (probabilities of the) predictions returned by each experiment, which may
be used to calculate new performance measures without rerunning the experiments.
3 The experiments
To populate the database with experiments, we selected 54 classification algorithms
from the WEKA platform (Witten and Frank (2005)) and inserted them together with
1
New data and algorithm characterizations can be added at any time by adding more columns
and calculating the characterizations for all datasets or algorithms.