Data Analysis and Presentation Skills Part 10 docx
Bạn đang xem bản rút gọn của tài liệu. Xem và tải ngay bản đầy đủ của tài liệu tại đây (349.79 KB, 19 trang )
6
Presentational Skills
So far we have looked at how we initiate a scientific inves-
tigation, plan an experimental design and then present and
analyse the results. When these processes are complete we
need to communicate what we have found to other scien-
tists. Dissemination usually takes the form of a scientific
publication, but as journals can sometimes take several
months to produce accepted papers, research is frequently
presented at conferences in the form of an oral presentation
or poster. The standard software that is used on these
occasions is Microsoft PowerPoint, so we will spend some
time in exploring how this package works, but firstly let us
think about how a presentation should be planned and
carried out.
6.1 Preparing for seminars
The most common form of oral presentation i s a seminar.These are sessions in
which a spe aker makes a brief presentation, followed by questions from the
audie nce. In preparing for a seminar you need to plan c arefully as strict time
limits usually apply and as much information as possible should be conveyed in
Data Analysis and Presentation Skills by Jackie Willis.
& 2004 John Wiley & Sons, Ltd ISBN 0470852739 (cased) ISBN 0470852747 (paperbac k)
a way that will interest and engage your audien ce. Here are some tips on how
to prepare for oral presentations.
Preparing information for the seminar
Research the background information thoroughly and make sure that you
un derstand it before trying to plan your pres entation. Look for diagrams,
¢gures and tables that you will be able to adapt and display in your talk
(making sure that there is no issue of copyright by using them). Make a list of
the bibliography and references as you prepare the written material as any
references us e d should be ack nowledge d.
The next step is to make some notes for the presentation. Once you have
completed this, read through them and se e how long it takes.You should allow
extra time for explanation of any ¢gures or tables that are included.
Now summarize the notes so that you can prepare the slides/overheads that
you plan to use. Keep slides as simple as possible, conveying the message of the
main po ints that you are trying to make in clear scienti¢c language. Avoid
lengthy sentences that will clutter the slide; instead use bullet points th at are
short and easy to read. Choose an appropriate font size, keeping in mind the
size of the room and screen where you will be making the pres entation.
When preparing slides in PowerPoi nt, choos e the colours of the text and
background caref ully.You need to select a scheme that has impact, but which
can be seen easily at a distance. If you are preparing overheads against a clear
background then keep to a black or dark blue for the colour of the text; avoid
some of the other popular colours, such as green, red and yellow, as writing
becom es very di⁄cult to read if these are used.
Everyone enjoys preparing slides in PowerPoint because of the animated
features and sound e¡ects. These should be used with some caution in
presentations as they c an become a major distraction and eventually an irrita-
tion to your audience. Anyone who has dyslexia will also ¢nd your
presentation very di⁄cult to follow, particularly where blocks of text are
animated on a slide.
Make sure that ¢gures, diagrams and tables are properly labelled and titled.
If these are taken from a book, paper or website then they should be properly
referenced with the so urce clearly shown on the slide. Any material taken from
the I n ternet should be checked to ensure that there are no copyright restric-
tions that apply to its use. Avoid scanning in items as these frequently produce
very pixelated images. There are many sources of free good quality images on
the World Wide Web and by using the Draw features in PowerPoint it is possible
to annotate and customiz e them for your talk.
160 6 PRESENTATIONAL SKILLS
Your seminar should be clearly str uctured, so begin with a title page that
shows your name and the institution where you are studying. To follow there
should be an introduc t ion that provides backgroun d i nformation to the
topic that you are going to present so that the audience is eased into the
more complex information that they may not be familiar with. The main
part of your talk should come after the introduction. I f you are prese n ti n g
some research then it is a good idea to present the aims and objectives of
your investigation then lead into the design and methodology of you r study
be fore moving on to the results and discussion. Ever y prese n tation should have
a conclusion to sum mari ze the main points that you have presented.
References used can be given o n a slide at the end or as part of a handout to the
audience.
Presenting the seminar
Once the slides or overheads are complete you should have a practice run -
through of your seminar. Do this in fron t of an audience of friends or family;
or, if you can’t face this, then try a mirror. If you have access to a video camera
then ask someone to record your practice seminar. It is important to know how
you are presentin g yourself while you are talking and to have feedbac k on your
performance. Be aware of your body language; don’t slouch in front of the
audie nce, never looki ng at the m. Stand upright, smile and introduce yourself
before you start. Avoid folding your arms, instead use your hands to engage
with the screen and the audience.When you are explaining someth ing shown
on the screen, don’t turn your back to the audience. Use a pointer, or you r
hand if you don’t have a pointer, to indicate features of in terest, makin g su re
that you stand to the side of the sc reen and not in front of it. Appear calm and
relaxed, even if inside you feel far from it.Taking a few deep breaths before you
go up to take your position usually helps to calm the ner ves that everyone
inev itably feels, part icularly when it is a new exper ien ce ^ the ¢rst time is
always the worst.
When you begin speaking make sure that you attempt to project your voice
forward to the audience, maintaining a correct posture will ensure this.
During the presentation remind yourself to sustain the level of your voice so
that it does not start loud and then trail away towards the end. Make sure that
the pace of the presentation is even, without being to o slow or rushed. This is
where practising beforehand is important to make sure that the timing is
correct.Try to vary the way in which you speak, emphasi zing important words
and phrases, so that you avoid talking in a £at monotone. Avoid um’s and ah’s
when you are speaking as this can become very distrac ting. If you lose your
161PRE PARING FOR SEMINARS
place then simply start again, but avoid becoming £ustered as this will on ly
result in panic. Prompt cards can be use ful, but is usually better to use the
slides that you have prepared as the prompts so th at you do not end up reading
the entire seminar from the notes that you have prepared. Once you have
¢n ished, make this clear to your audience. This is normally done by thanking
the audience for their attention and asking if anyone has any questions.
A lthough you will have researched your area th oroughly it is not expected that
you have suddenly become a world authority. If you don’t know the answer to a
ques tion it is all right to say so, but at the same time try to use the knowled ge
that you have gained to speculate and form an opinion.
6.2 Using Microsoft PowerPoint
T his software package is used for making high-quality presentations.
Presentations may be pro duced using text, clipart, drawing and graphs. The
presentation itself is a sin gle ¢le that contains:
. slides
. speaker’s notes
. handouts for delegates
Each individual page of the presentation is a slide on which you can display a
variety of information and graphics. The slid es may then be printed out as
black and white or colour transparencies, or made into 35-mm slides. T he
presentation may also be made using multimedia facilities available in most
lecture theatres.
Starting a new presentation in PowerPoint
Enter the program by selectin g PowerPoin t from the Microsoft O⁄ce suite of
prog rams.You will see options from which to choose to open a new presen ta-
tion via the AutoContent Wizard (uses a se t of pre-labelled and formatted
slides), a template (blank slides in a preset format), to open a new set of blank
slides or to open an existing presentation. If you want to explore presentations
that have alrea dy been set up for a variety of purpo ses then browse through the
list o¡ered by the AutoContent Wizard and choose one to have a look at. You
can add information yourself in order to customize it to your own needs. Save
one of the presentations with the ¢lename ‘test’and then close the ¢le.
162 6 PRESENTATIONAL SKILLS
Opening an existing presentation
From FilejOp en, select the PowerPoint ¢le test.ppt that you have just created
(note that the extension .ppt has been added to the ¢le name to indicate that it
is a PowerPoint ¢le). Double click on test.ppt to open the presentation.
T here are di¡erent ways of being able to view your presentation selected
using ¢ve buttons located near the bo ttom left of the screen. By moving the
mouse, take the pointer over each one in turn to see theToolTip descrip tion of
each function. The buttons will be:
SlideView Outlin eView Slider SorterView Notes PageView Slide Show
N.B. Slide View may be called Normal View on some versions of PowerPoint.
Move to the button for Outlin e View and select this option (by clicking on
it). By clicking on the slide number on the left-hand side of the screen you are
able to edit information on the slide , whilst on the right of the screen you can
see the changes taki ng e¡e ct on the slide. Close the presentation. As a
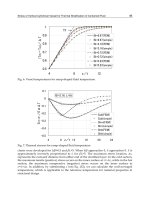
demonstration of how to use PowerPoint for seminar presentations, we are
going to produce a short set of slides from which the handout in Figure 6.1 has
been prepared.
Starting a new presentation using a template
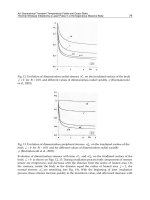
Now start a n ew presentation (Click on FilejNew) and, using th e Presentation
Designs menu as seen in Figure 6.2, sort through the di ¡erent presentation
templates until you ¢nd one that you prefer.
The title slide
Once you have selected your template, click on OK. A ser ies of di¡erent types
of slides will be shown for you to choose the most appropriate sort for the
slide in th e presentatio n sequence. Flick through the di¡erent slide type s to see
what is available (the types are explained in a box on the bottom right of the
dialogue box), but then select theTitle Slide. Type in the heading ‘Vitamin C in
Citrus Fruits’as shown in slide one in Figure 6.1.We now need to inse rt clipar t
and ¢nd a ¢le containing an image of a lemon. From the Insert menu select
Clip A rt from the list provided (noting that you could insert the image dire ct
from a ¢le if you already had something available). From the resident clipart
gallery provided you can scroll through the images until you ¢nd something
163USING MICROSOFT POWERPOINT
suitable and then adding it to the presentation using the Insert button. Images
may also be im ported from on-line resources. Choosing the clips on-line
option will take you through to the Microsoft clipar t site on the Internet , but
there are many other free on-line resources. An excellent resource for scienti¢c
and medical images is provided by the Wellcome Trust library which
contains 160 000 images (
and http://medphoto.
wellcome.ac.uk).
164 6 PRESENTATIONAL SKILLS
Figure 6.1 Sample handout prepared using PowerPoint
You can also use a search engine to ¢nd suitable photographs or images (or
even video clips). C heck out these resources for yourself and insert an image of
a citrus fruit into the presentation. Whatever the source of your image, you
will probably need to re-size it to ¢t the available space on your slide. Drag one
of the control handles until the image is the correct size and placed correctly
into position.
Building the presentation
You are now ready to move on to the next slide, so cli ck on Insert: New Slide.
This time cho ose the Bulleted l ist. Type in the information on Slide 2 in the
presentation.
A lthough the presentation is not yet ready, you may want to preview what it
looks like so far. Clicki ng on the Slide Sorter button will show the slide in you r
current set in ou tline view.To start the show, locate the Slide Show button and
click on it. T he ¢ rst slide should now b e displayed and will occupy the full
screen. You may move backwards and forwards in a presentation by using the
reverse and forward arrow keys, oth erwise a single click of the mouse will
move forward through the slide show, and, as we shall see later, activate the
animated options.
If you move your mouse whilst viewing a slide a small button appears at the
bottom left-hand corner. If you click on this button, a pop up menu appears
165USING MICROSOFT POWERPOINT
Figure 6.2 Choice of presentation templates
that will provide some useful commands whilst looking at a slide show.
A lternatively click with your right mouse button anywhere on the slide in view.
Ch oose the Pen option from the menu and your mouse pointer becomes a pen.
T his enables you to be able to draw on your slide, by dragging the pen across
the screen. Any drawing that is made is temp orary and cannot be saved into
your presen tation. From the same me nu, clicking on Pointer Options, allows
you to change the colou r of the lines that you draw.Try this out by clicking on
an appropriate colour to contrast with you r background. The feature is useful
if you are explaining a complex diagram or want to emphasize a part icular
word or phras e on a slide.
While in Pen mo de you cannot move on to the next slide by clicking the
mouse.
Click again on the right-hand mouse button and select Arrow from the pop
up menu to restore the feature s of the mouse pointer (or press N on the
keyboard to move to the next slide). Each slide in the presentation can be
viewed until you reach the end. To terminate the slide show without looking
through them all, press the Esc key. If this doe s not re turn you to the slide view,
click the Slide View button.
Notes Page View
T his is a useful option if you want to prepare a set of speaker notes to go with
your presentation. By selecting the Notes Page View button the screen splits
into two parts: at the top is your slide and in a separate box below is a space in
which to type your notes. Usually the notes frame is so small that you cannot
clearly read any text entered into it, so use the Zoom control on the formatting
toolbar and increase the zoom factor to 100 p er cent.You should now be able to
easily read any text th at you enter into the no tes page.Th e notes pages can then
be printed out and us ed to refer to key points during the presentation or given
as a handout to your audience.
Slide View
Click back on the Slide View button and display Slide 2 . Now continue with
your presentation by inserting a new slide. For Slide 3 we ne ed to choose the
Table slide. Enter the title and then double click, as shown on scre e n to add the
table. You will be prompted to enter the number of rows and columns to
complete the table; enter 2 columns and 5 rows and con¢rm your choice. The
table will then appear in which you will be able to insert the information
provided.
166 6 PRESENTATIONAL SKILLS
Inserting graphs and charts
Choose the option of inserting a new slide and this time select Chart slide
(altho ugh you could also use Text and Chart/Chart and Text if you wanted to
include some notes with the chart).
When the new slide is displayed you can double click on the Inse r t chart
button to produce a datasheet and graph.You may enter the data directly onto
the datasheet and the graph will be automatically plotte d, or import data from
a text ¢le in Word, or from an Excel worksheet or insert a chart directly from
Excel. It is usually more convenient to create a chart in Excel and then paste it
into PowerPoint. Op en Excel and insert the information given on the datasheet
in Figure 6.3 and create the chart required for the slide. When you have
completed the graph in Excel, copy and paste it into the space for the chart in
PowerPo int. Re-size as appropriate and add the title.
Drawing shapes on slides
You may create your own drawings or £ow diagrams using the draw facility in
PowerPo int. To use this option clic k on View Toolbars then ensure that the
Drawi ng option is selected and click on OK.Tools may be used to:
167USING MICROSOFT POWERPOINT
Figure 6.3 Preparing a graph using Excel
. draw rec tangles
. draw squares
. draw circles
. draw ellips es
. create shadows
. change line colour
. use autoshapes ^ choo se from a selection inclu din g arrows,
parallelograms, stars, etc.
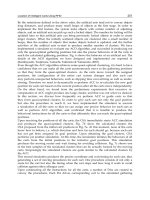
Using the Draw features we will create a £ow diagram for the biosynthetic
pathway shown in Figure 6.4 to put into the presentation.
Firstly insert the names of the in termediates in the pathway by choosing the
textbox option from the Draw toolbar and typing in the name of the substance.
A border may be added to the textbox by clicking on the edge of the textbox
and entering edit mode by clic kin g the right mouse button and choosi ng
Format Text Box from the menu. The colou r and style and weigh t (thickness)
of the border may be selected.
Drawing lines/arrows
T here are lines and arrows of di¡erent appearances available using the options
from the Autoshapes on th e Draw to olbar in addition to a plain l ine or arrow
whose properties may be adjusted in the same way as the textbox border. The
arrow tool is us ed by dragging it between its start and end points. By holding
down the Shift key before drawing the line or arrow, you can control whe the r it
is drawn vertical, horizontal or at a 4 5-degree angle.
Repeating this but using the Control instead of Shift key causes the line to
be drawn from a ce n tral poi n t.
168 6 PRESENTATIONAL SKILLS
Figure 6.4 Example biosynthetic pathway ^ vitamin C (ascorbate) synthesis
Rotating an object
This may be achieved by selecting an object (e.g. an arrow) and then clicking
on the Free Rotate to ol located on the Draw toolbar. The mouse poin ter
changes to a rotating arrow.You are then able to rotate the position of an object
until you are satis¢ed with its new position.
T he tools in Draw are very easy to use; you can try experimenting with some
of the other tools such as 3-D and shadow e¡ects to create a three-dimensional
appearance to some of the other objects. Once the object has been selecte d,
click on the tool button and make a choice from the various formats o¡ered. If
you do not like the e¡e ct then simply Undo and try a di¡erent opti on.
Insert the information on Slide 6 from Figure 6.1 and then save your work to
disk.
Adding animation effects
These are the e¡ec ts for which PowerPoint has gained it reputation and
certainly helps to enliven a presentation. The animation and sound e¡ects
should be us e d ver y carefully as they can become overwhelmin g for your
audie nce unless they are used with restraint.
We can ‘build’ a slide so that bul let points appear as the presentation
proceeds. There are various options on how you can bring in new points and
what appears on screen with existing text that you have displayed. C omplete
the presentation by entering the information on the ¢nal slide shown in
Figure 6. 1.
Creating animation effects
Make certain that you are cu rrently in Slide View and have Slide 2 displayed. If
you click on the ¢rst sentence a frame will appear around all of the text.We will
now set the animation features so that each bullet point on the slide appears
separately instead of all at once as at present. From the Slide Show option select
Custom Animation. A dialogue box now appears from which you will be able
to customize the animation. From the Animation Settings click on the E¡ects
tab. Firstly set the way in whi ch the text will appear on the screen (currently set
at No e¡ect); a number of di¡erent styles are listed, select Fly From Left. On
the right of thi s box under Introduce Text, click on All at once, then un der
Grouped By and select 1st Level Paragraphs.When text appe ars on the screen it
will now come in from the left-hand side and one line will appear with each
169USING MICROSOFT POWERPOINT
click of the mouse button. To add sound e¡ects, change the opt ion f rom No
Sound to Camera (the thi rd option will only be available if the computer you
are working on is set up for sound). To determine what happens to the text
once it has appeared, select Don’t Dim. If you now move to the slide show you
should ¢ nd th at the slide appears with its title.With the ¢rst click of the mouse
button the ¢rst bullet point appears making the sound of a camera shutter
closi ng as it does so; on the second click the ¢rst line disappears and the
second bullet point £ies in from the left. This is repeated for the remain ing
lines of text until the slide has been displayed and we move on to Slide 3 in the
sequence. Pres s the Esc key to end the presentation.
Transition effects
Transitio n e¡ects control the way in which slides appear on screen. Like text
they can be animated in a variety of ways. Place Sl ide 3 in the current SlideView
mod e. From the Slide Show menu select SlideTransition. A number of di¡erent
transitions are listed unde r the E¡ects, for which you are also able to chan ge
the spee d from Slow to Med ium or Fast. From the list of op tions cho os e a style
and speed and watch the preview to see whether this is an e¡ec t that you like.
Once you have made your selectio n, choose Apply All to apply the transition to
all of the slides in the show. Leave the Advance section to Only on Mouse Click
(s o that you retain manual control over the presentation). Then return to the
¢rst slide in the sequence and run the show.
Sorting slides
T he slid es may be sorted using the Slide Sorter button shown at the b ottom
le ft-hand corner of the document window. Working in Slide Sorter you can
select the slide timings for some or all of the slides in your presentation,
with out having to change views.
Click on Slide 2.You will see a black border appear to indicate that this slide
has been selected. Hold down the Shi ft key and click on Slide 3.
Both Slides 2 and 3 should now be high l i g hted with the bord e r.You may now
alter th e time that both of these slides appear on screen. This is useful for any
unattended presentations, but can be used to keep to within se t time limits for
a live presentation, whils t allowing you to increase the time for more complex
slides that need to remain on vi ew for longer.
Click on Slide ShowjSlide Transition to di splay theTransition dialogue box.
170 6 PRESENTATIONAL SKILLS
Under Advance, select the Automatic ally After [blank] seconds option
button.
For each bullet point on a slide, allow at leas t 3 seconds, so enter 10 as the
number of seconds that the slide will be displayed before advancing to the next
slide. Click A pply to ¢nish.
Click on Slide 1 and, using the instructions above, set i ts t iming to 6 seconds.
If you click on Slide Show now, your timings will not take e ¡ect. Firstly you
must click on Slide Show and use the pull down menu to display the Set Up
Show dialogue box.
In the From: box typ e 1 then in th e To: box type 3. In Advance, click on the
Use Slide Timings box. Now click on the Show button and your timings will
take e¡ect.
Continuous loops
This allows the continuous display of a PowerPoint presentation until the Esc
key is pressed.
Click on Slide Show and display the Set Up Show dialogue box.
In the From: box type 1 and in the To: box type six (as there are six slide s in
the show).
In Advance s elec t the use SlideTimings option. Click on Loop Continuously
Until ‘ Esc’option then click on the Show button.You should now se e the show
continuously loop round.When you have ¢nished watching the presentation,
press Esc to end the repeats.
Adding a slide
While you are in Slide View, click on Insert New Slide by Slide 2. You can then
choose what type of slide to insert. Insert a bulleted text slide. T his is just as
easily deleted by re-selecting the slide and pressing the hDeli on the keyboard.
Ending a show
If you are not using a continuous loop it is a good idea to have a blank slide
between the last slide and the ¢rst in the show.Without the blank slide, if you
should click the mouse button acciden tally wh ilst on the ¢nal slide PowerPoint
will return to Slide View which would lo ok unprofessional. This will not be
necessary if you are running a continous loop.
171USING MICROSOFT POWERPOINT
Spelling
As in any item of work, you need to check your spelling. In addition to manual
proofreading, you may activate the spellch eck facility by clicking on Tools then
Spelling. Th e spellchecker works in the same way as in Word. Having checked
that you now have all six slides in the presentation as shown in Figure 6.1, save
your work and we will then create a hand out.
Creating handouts
You are now rea dy to run your presentation and prepare the handouts for your
audience. Click on View: Master then Handout Master. A handout sheet
template now will appear for your presentation. You can insert information
about your presentation in the header and footer. Insert your name in the top
le ft of the handout. If you need to alter the layout of the handout (e.g. to
landscape orientation as opposed to portrait, click on File: Page S etup and
adjust it he re, making sure that you select the option for A4 paper in this
process). Now if you are ready to print, go to the File: Print option. Make su re
that you select to print in Black and White if you don’t want colour versions of
your slides. Under Pri nt What, selec t Handouts (six slides per page). Print the
handout prepared from your presen tation.
Tip: For some templates it is better to remove the background altogether
(as in the example given) to print clear handouts.To do this, you will need
to go back to the FormatjApply Design Template menu and select a Blank
presentation. If one is not available on your system the choose
FormatjBackground and in the pop u p box tick the Omit Background
Graphics from Master Check box and apply this to all the slides in the
presen tation (Apply to A ll).
6.3 Poster presentations
PowerPoint can be used equally as successfully to produce posters, large or
small. You will need to choose the blank slide from the list of slide formats.
Using File: Page Setup format the poster to the size you require; you may need
to use the custom size option if the dimensions are no t standard.Text is added
172 6 PRESENTATIONAL SKILLS
to the slide using the textbox function and photographs and clipar t or graphs
and tables can be added in the same way as a slide presentation. In preparing a
poster you should keep the following points in min d:
. Plan the poster carefully by making a rough design on a piece of paper
before committing yourself to adding items on PowerPoint.
. Keep the design as simple as possible so that it doesn’t look cluttered and
dis organized. If it is a poster describing some research, it is useful to keep
to the standard headings of Introdu ction, Methods, Results, Discussion
and Conclusion.
. Maintain a co nsistent style throughout for your colour scheme and text.
Make sure that writing is large enough to be read at a distance and that
only key points are presented, there is not going to be enough room for
detail.
. Use a plain background, if i t is too busy it will detract from the other
information on the poster. But make the display attractive by including
illus trations and ¢gures.
You will ¢nd so me examples of posters on th e book’s support website
together with PowerPoint presentations including animate d features.
Presenting the results of your research is the climax to a lot of hard work, so
PowerPo int can be used with great e¡ect to display your achievements to the
rest of the scienti¢c community. Have fun!
WEB SUPPORT – SECTION 6
T his part o f the website will show how PowerPoi nt can be used for slides
and posters, showing a number of di¡erent formats and a list of further
tips on making the most of your presentations.
173POSTER PRESENTATIONS
Appendix
Further reading
An Introduction to Experimental Design and Statistics for Biology
David Heath (1995)
Routledge
Biosciences on the Internet
Georges Dussart (1992)
John Wiley & Sons
Experimental Design for the Life Sciences
Graeme D Ruxton & Nick Colegrave (2003)
Oxford University Press
Statistics with Applications to the Biological and Health Sciences
M. Anthony Schork & Richard D. Remington (2000)
Prentice Hall
Data Analysis and Presentation Skills by Jackie Willis.
& 2004 John Wiley & Sons, Ltd ISBN 0 470852739 (cased) ISBN 0470852747 (pap erback)
Alt key codes for special symbols in
Microsoft applications
T he following codes are for symbols that can be us ed in all Microsoft appli-
cat ions. To insert press the Alt key then the ap propriate numeric code on the
number key pad. On releasing the Alt key the symbol will be inserted.
Alt code Symbol Altcode Symbol
129 u
«
0131 f
130 e¤ 0134 {
13 1 a“ 0137 %
132 a
«
0139
<
133 a' 0150 ^
134 Ô 0151 ö
135 c
0153
TM
136 e“ 0155 >
137 e
«
0156 oe
138 e' 0169 #
139 |
«
0171
<<
140 |
“
0174 1
141 |
'
0175
^
145 × 01 7 6 8
146 Ó 0177 +
156 » 0178
2
159 f 0179
3
166
a
0181 m
167
o
0185
1
171
1
Ù
2
0186
o
172
1
Ù
4
0187 >>
174 << 0188
1
Ù
4
175 >> 0189
1
Ù
2
225 Þ 0190
3
Ù
4
230 m 0215 6
241 + 0247 7
246 7 024 8 Ö
248
8 0255 y
«
253
2
176 APPENDIX
Statistical tables
Critical values for the Student
t
-test
Level of signi¢cance (P)
df 0.05 0.025 0.01 0.005 0.001 0.0005 One-tailed test
0.1 0.05 0.02 0.01 0.002 0.001 Two-tailed test
1
2
3
4
5
6
7
8
9
10
11
12
13
14
15
16
17
18
19
20
21
22
23
24
25
26
27
28
29
30
6.314
2.920
2.353
2.132
2.015
1.943
1.895
1.860
1.833
1.812
1.796
1.782
1.771
1.761
1.753
1.746
1.740
1.734
1.729
1.725
1.721
1.717
1.714
1.711
1.708
1.706
1.703
1.701
1.699
1.697
12.706
4.303
3.182
2.776
2.571
2.4 47
2.365
2.30 6
2.262
2.228
2.201
2.179
2.160
2.145
2.131
2.120
2.110
2.101
2.093
2.086
2.080
2.074
2.069
2.06 4
2.06 0
2.056
2.052
2.048
2.045
2.042
31.821
6.965
4.541
3.747
3.365
3.143
2.998
2.869
2.821
2.764
2.718
2.681
2.650
2.624
2.602
2.583
2.567
2.552
2.539
2.528
2.518
2.508
2.500
2.492
2.485
2.479
2.473
2.46 7
2.462
2.457
63.657
9.925
5.841
4.604
4.032
3.707
3.499
3.355
3.250
3.169
3.106
3.055
3.012
2.977
2.947
2.921
2.898
2.878
2.861
2.845
2.831
2.819
2.807
2.797
2.78 7
2.779
2.771
2.763
2.756
2.750
318.31
22.327
10.214
7.17 3
5.893
5.208
4.785
4.501
4.297
4. 144
4.025
3.930
3.852
3.787
3.733
3.686
3.646
3.610
3.579
3.552
3.527
3.505
3.485
3.46 7
3.450
3.435
3.421
3.408
3.396
3.385
636.62
31.598
12.924
8.610
6.869
5.959
5.4 0 8
5.0 41
4.781
4.587
4.437
4.31 8
4.221
4. 140
4.073
4.015
3.965
3.92 2
3.883
3.850
3.819
3.792
3.767
3.745
3.725
3.707
3.69 0
3.674
3.659
3.64 6
177STATISTICAL TABLES