Handbook of Corrosion Engineering Episode 1 Part 15 docx
Bạn đang xem bản rút gọn của tài liệu. Xem và tải ngay bản đầy đủ của tài liệu tại đây (404.44 KB, 40 trang )
surfaces with optical and scanning electron microscopy suggested that
the correlation between the CPE and the pitting rate involved the num-
ber of pits formed in any given area (pit density) rather than the pit
depth. The low pitting rate suggested by EIS for the rolled surface was
consistent with visual observation of the long-term-exposure panels.
However, the approximate equivalence for all three faces was not. If the
interpretation of EIS data is correct, the corrosion of the rolled surface
must occur initially at this high rate. However, the corrosion rate would
then fall to a much lower value over the longer term. The R
p
values for
the 2024-T3 alloy showed a pronounced difference in overall corrosion
rate between the rolled surface and the edges, with the edges having
consistently higher rates. After about 50 h, a similar trend was observed
for the CPE. These results were consistent with observations made on
the long-term-exposure panels, which were characterized by a higher
density of localized corrosion sites on the edges.
17
On the basis of the EIS data, the conclusion would be reached that
the edges of the 8090-T8 alloy had lower overall corrosion rates and
were less prone to pitting than their 2024-T3 counterparts. The edges
of the 8090 long-term-exposure panels had substantial areas where no
visible corrosion had occurred. This could be consistent with the lower
overall corrosion rates and lower pitting density in comparison with the
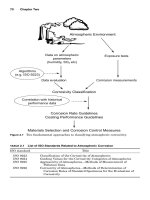
2024. However, the depth of attack within each pit (Fig. 7.11) was as
large as or larger than that of a corresponding pit on 2024. Thus the
rate of corrosion within a pit was at least as severe for 8090 as for 2024.
As was the case for the 8090 alloy, the corrosion rate determined with
EIS for the rolled surface of the 7075 was approximately equal to that
measured for the edges. This was not consistent with the appearance of
the long-term panels, which suffered more metal loss along the edges
Acceleration and Amplification of Corrosion Damage 511
(a) (b)
Figure 7.11 Photomicrograph of a section through an edge of the 8090-T851 panel
immersed in seawater during 4 months (a) at 64ϫ and (b) at 320ϫ to illustrate the inter-
granular nature of the corrosion attack.
0765162_Ch07_Roberge 9/1/99 5:41 Page 511
than on the rolled surface. The CPE values obtained for these experi-
ments indicated that the rolled surface of the 7075 alloy had the lowest
pitting density, while the long and short edges had higher rates. The
higher rates reached similar and essentially constant values after 200
h. These results correlated very well with the long-term-exposure tests,
in which the edges did indeed suffer much worse localized attack.
According to the EIS results, the rolled surface of the 2090 alloy had a
consistently lower general corrosion rate than the same surface of the
7075. This did not appear to be consistent with the long-term-exposure
tests, in which corrosion damage seemed to be more extensive on the sur-
face of the 2090 alloy. In addition, the EIS data suggested that the edges
of the 2090 were only slightly more corrosion-resistant than the 7075
edges. Once again this did not appear to be consistent with visual obser-
vation of the long-term-exposure panels. In this case, the edges of the
2090 panels suffered noticeably less corrosion than their 7075 counter-
parts. The CPE data indicated that the pit density should be lower on
the rolled surface of the 2090 than on that of the 7075 and that the pit
density should be much lower on the edges of the 2090 than on the edges
of the 7075. These results are completely consistent with the appear-
ance of the long-term-exposure panels.
The long-term-exposure tests indicated that the rolled surfaces of
the 8090-T851 sheet were more resistant to corrosion than those of the
conventional 2024-T3 sheet. Except for some pits that developed at an
air/water interface, these surfaces suffered only minor corrosion. The
same tests indicated that the rolled surfaces of the 2090-T8 sheet suf-
fered at least as much corrosion damage as their counterparts on the
7075-T6 sheet. Some fairly deep pits occurred on the rolled surfaces of
the 2090, even during the exposure to seawater fog.
The results obtained during the electrochemical testing of various
faces of aluminum sheet material indicated that short-term EIS mea-
surements could provide good predictions of the general and localized
corrosion behavior of this material when exposed to seawater. In fact,
the prediction of the localized corrosion behavior with the CPE calcu-
lated from the EIS data seemed to agree more closely to the long-term
test results than the general corrosion estimation.
17
7.2.3 Laboratory tests
In well-designed chemical processing plants, materials selection is
based on a number of factors, such as service history, field in-plant cor-
rosion tests, and pilot plant and laboratory corrosion tests. But, over
time, laboratory tests have proven to be the most reliable and simple
mean to generate information for the selection of process materials.
Many of these tests are routinely performed to provide information on
512 Chapter Seven
0765162_Ch07_Roberge 9/1/99 5:41 Page 512
■
Fundamental corrosion evaluation
■
Failure analysis
■
Corrosion prevention and control
■
Acceptance of quality assurance
■
Environmental issues involving corrosion
■
New alloy/nonmetallic or product process development
The Corrosion Tests and Standards handbook subdivides laboratory
corrosion tests into four categories: cabinet tests, immersion tests,
high-pressure/high-temperature tests, and electrochemical tests.
While these four categories represent different sets of conditions accel-
erating corrosion processes, only electrochemical tests can directly
amplify the impact of corrosion processes. The main reason why this is
possible is that all electrochemical tests use some fundamental model
of the electrode kinetics associated with corrosion processes to quantify
corrosion rates. The amplification of the electrical signals generated
during these tests has permitted very precise and sensitive measure-
ments to be carried out.
In order to understand how environmental conditions can be acceler-
ated, one has to first recognize the complexity of this factor. An impor-
tant point for the description of the environment is the distinction
between nominal and local (or near-surface) environments. Generally,
components are designed to resist nominal environments specified by
the applications and service conditions. The planning of testing pro-
grams is based on these specifications. Modern testing practices reflect
this complexity by building variations into the tests or by focusing on
the worst-case aspect of a situation.
Cabinet tests. Cabinet testing refers to tests conducted in closed cabinets
where the conditions of exposure are controlled and mostly designed to
accelerate specific corrosion situations while trying to emulate as closely
as possible the corrosion mechanisms at play. Cabinet tests are general-
ly used to determine the corrosion performance of materials intended for
use in natural atmospheres. In order to correlate test results with service
performance, it is necessary to establish acceleration factors and to veri-
fy that the corrosion mechanisms are indeed following the same paths.
Modern surface analysis techniques can be quite useful to ascertain that
the corrosion products have the same morphologies and crystallographic
structures as those typically found on equipment used in service. There
are basically three types of cabinet tests:
Controlled-humidity tests. There are 15 ASTM standards covering
different variations on creating and controlling fog and humidity in
Acceleration and Amplification of Corrosion Damage 513
0765162_Ch07_Roberge 9/1/99 5:41 Page 513
cabinets for corrosion testing of a broad spectrum of products, from
decorative electrodeposited coatings to solder fluxes for copper tub-
ing systems. The basic humidity test is most commonly used to eval-
uate the corrosion resistance of materials or the effects of residual
contaminants. Cyclic humidity tests are conducted to simulate expo-
sure to the high humidity and heat typical of tropical environments.
The cabinet in which such tests are performed should be equipped
with a solid-state humidity sensor reading the current humidity con-
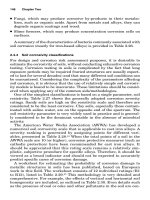
dition and a feedback controller. The mechanism used to control the
humidity moves chamber air via a blower motor and passes it over
a heater coil in the bottom of the chamber with an atomizer nozzle
fogging into this air stream (Fig. 7.12).
Corrosive gas tests. In these tests, controlled amounts of corrosive
gases are added to humidity to replicate more severe environments.
Some of these tests are designed to reveal and amplify certain char-
acteristics of a material. ASTM B 775, Test Method for Porosity in
Gold Coatings on Metal Substrates by Nitric Acid Vapor, and B 799,
Test Method for Porosity in Gold or Palladium Coatings by
Sulfurous Acid/Sulfur-Dioxide Vapor, employ very high concentra-
tions of corrosive gases to amplify the presence of pores in gold or
palladium coatings. The moist SO
2
test (ASTM G 87) is intended to
produce corrosion in a form resembling that in industrial environ-
ments. A very sophisticated variation of these tests is the flowing of
mixed gas test (ASTM B 827), in which parts per billion levels of pol-
lutants such as chlorine, hydrogen sulfide, and nitrogen dioxide are
introduced into a chamber at controlled temperature and humidity.
514 Chapter Seven
Figure 7.12 Controlled-humidity test chamber.
0765162_Ch07_Roberge 9/1/99 5:41 Page 514
This test is particularly adapted to the needs of the electronics
industry.
Salt spray testing. The oldest and most widely used cabinet test is
ASTM B 117, Method for Salt Spray (Fog) Testing, a test that intro-
duces a spray into a closed chamber where some specimens are
exposed at specific locations and angles. The concentration of the NaCl
solution has ranged from 3.5 to 20%. There is a wide range of chamber
designs and sizes including walk-in rooms that are capable of per-
forming this test. Although used extensively for specification purposes,
results from salt spray testing seldom correlate well with service per-
formance. Hot, humid air is created by bubbling compressed air
through a bubble (humidifying) tower containing hot deionized water.
Salt solution is typically moved from a reservoir through a filter to the
nozzle by a gravity-feed system (Fig. 7.13). When the hot, humid air
and the salt solution mix at the nozzle, the solution is atomized into a
corrosive fog. This creates a 100 percent relative humidity condition in
the exposure zone. For a low-humidity state in the exposure zone of the
chamber, air is forced into the exposure zone via a blower motor that
directs air over the energized chamber heaters (Fig. 7.14).
The inspection of specimens exposed to cabinet testing is often done
visually or with the use of a microscope when localized corrosion is
Acceleration and Amplification of Corrosion Damage 515
Salt fog
Salt solution
reservoir
Figure 7.13 Controlled salt fog test chamber during a humid cycle.
0765162_Ch07_Roberge 9/1/99 5:41 Page 515
suspected. The literature on the results and validity of these tests is
abundant. After visual examination, more destructive procedures can
be used to quantify test results. Measurement of physical properties or
other functional properties often provides valuable information about
corrosion damage.
Immersion testing. The environmental conditions that must be simu-
lated and the degree of acceleration that is required often determine
the choice of a laboratory test. In immersion testing, acceleration is
achieved principally by
■
Lengthening the exposure to the critical conditions that are sus-
pected of causing corrosion damage. For example, if a vessel is to be
batch-processed with a chemical for 24 h, then laboratory corrosion
exposure of 240 h should be considered.
■
Intensifying the conditions in order to increase corrosion rates, i.e.,
increasing solution acidity, salt concentration, temperature or pres-
sure, etc.
Once the environmental conditions have been determined and the
test designed, the test should be repeated a sufficient number of times
to determine whether it meets the desired standard for reproducibility.
Immersion tests can be divided into two categories:
Simple immersion tests. Basically, small sections of the candidate
material are exposed to the test medium for a period of time and the
loss of weight of the material is measured. Immersion testing
516 Chapter Seven
Figure 7.14 Controlled salt fog test chamber during a dry cycle.
0765162_Ch07_Roberge 9/1/99 5:41 Page 516
remains the best method of screening and eliminating from further
consideration those materials that should not be considered for spe-
cific applications. But while these tests are the quickest and most eco-
nomical means for providing a preliminary selection of best-suited
materials, there is no simple way to extrapolate the results obtained
from these simple tests to the prediction of system lifetime.
Alternative immersion tests. Another variation of the immersion
test is the cyclic test procedure, in which a test specimen is
immersed for a period of time in a test environment, then removed
and dried before being reimmersed to continue the cycle. Normally
hundreds of these cycles are completed during the course of a test
program.
High-temperature/high-pressure (HT/HP) testing. Autoclave corrosion
tests are a convenient means for laboratory simulation of many service
environments. The reason for such tests is to recreate the high tem-
peratures and pressures commonly occurring in commercial or indus-
trial processes. Factors affecting corrosion behavior are often
intimately linked to the conditions of total system pressure, partial
pressures of various soluble gaseous constituents, and temperature.
There are many HT/HP environments of commercial interest, includ-
ing those in industries such as petroleum, nuclear power, chemicals,
aerospace, and transportation, where reliability, serviceability, and
corrosion concerns are paramount.
18
Corrosion coupons can be placed in the aqueous phase, in vapor
space, or at phase interfaces, depending on the specific conditions that
are of interest. Additionally, it is also possible to conduct electrochem-
ical tests in HT/HP vessels. If multiple liquid phases are present, it
can be necessary to stir or agitate the media or test vessel to produce
mixing and create conditions in which the corrosion test specimens are
contacted by all of the phases present. Special magnetic and mechan-
ical stirrers are available that can be used to produce movement of the
fluid, leading to a mixing of the phases. In some cases, where contact
of the specimens with both liquid and gaseous phases is important in
the corrosion process, it may be necessary to slowly rotate or rock the
test vessel to produce the intended results.
18
HT/HP corrosion tests
have special requirements not common to conventional corrosion
experiments conducted in laboratory glassware.
Four variations of common HT/HP test methods that have been
found to be useful in materials evaluation involving corrosion phe-
nomena will be briefly described. However, these types of evaluations
can be accomplished through careful planning and test vessel design.
These include:
18
Acceleration and Amplification of Corrosion Damage 517
0765162_Ch07_Roberge 9/1/99 5:41 Page 517
Windowed test vessels. Special transparent windows and other fix-
tures such as fiber optics have been used to permit visual measure-
ments or observations within the confines of test vessels. Besides
being able to withstand the pressures, temperatures, and corrosion
environments, these windows may have to perform other functions
related to the introduction of light or other radiation if these are
among the test variables.
Electrochemical measurements. Most conventional electrochemical
techniques have been used for experiments conducted inside HT/HP
vessels. The most critical electrochemical component in these exper-
iments has always been the reference electrode. The design and con-
struction of the reference electrode are particularly important, as it
must provide a stable and standard reference potential. In many
applications, test vessels have been modified to accommodate an
external reference electrode to minimize the effects of temperature,
pressure, contamination, or a combination thereof.
Hydrogen permeation. Hydrogen charging is often a problem that
affects materials submitted to HT/HP test conditions. In such cases, it
may be necessary to measure hydrogen permeation rates and diffusion
constants in order to estimate the potential hazard of hydrogen attack.
For hydrogen permeation measurements at high temperatures, it may
be imperative to use solid-state devices.
Mechanical property testing. HT/HP vessels have been designed to
conduct a variety of mechanical tests, such as slow strain rate (SSR),
fracture, or fatigue testing. The main problem is always one of
selecting fixtures that can withstand the corrosive environments
generated in HT/HP tests.
Static tests. The simplest type of HT/HP corrosion test is conducted in
a sealed and static pressurized test vessel. The test vessel typically con-
tains a solution and a vapor space above the solution. In static corrosion
tests, the only form of agitation of the test environment is convection pro-
duced by heating of the solution. The solution itself can be anything from
a single liquid to water-based solutions containing various dissolved
salts, such as chlorides, carbonates, bicarbonates, alkali salts, and other
constituents or mixtures. The aim of these tests is to reproduce service
environments as closely as possible. The liquid and gas phases will be
determined by the amounts and vapor pressures of the constituents in
the test vessel and by the test temperature. In general, the degree of dif-
ficulty of these tests and the amount of expense required for them
increase with increasing test pressure and temperature.
Refreshed and recirculating tests. The depletion of volume of the corro-
sive environment in HT/HP tests is a serious limitation that often has
518 Chapter Seven
0765162_Ch07_Roberge 9/1/99 5:41 Page 518
to be overcome by the introduction of fresh environment, either con-
tinuously or by periodic replenishment of the gaseous and liquid phas-
es being depleted by the corrosion processes. The limitation of the
volume of the corrosive environment in most HT/HP tests makes
issues such as the ratio of solution volume to specimen surface area a
critical factor. In most cases, it is advantageous to limit this ratio to no
less than 30 cm
3
иcm
Ϫ2
. In any event, care should be taken to prevent
depletion of’ critical corrosive species or contamination of the test solu-
tion with unacceptably high levels of corrosion-produced metal ions.
Such conditions may require changes in the test constituents after a
certain period of testing time, depending on their rate of consumption
or contamination by corroding specimens. In particularly critical situ-
ations, it is possible to minimize such concerns by using constant or
periodic replenishment of either the gaseous or the liquid phase in the
autoclave under pressurized conditions. The need for agitation is par-
ticularly required when multiple liquid phases are present. Special
magnetic and mechanical stirrers are available that can be used to
produce movement of the fluid. Magnetic or mechanical stirring can
also be employed to spin the specimens in the test environment, or
alternatively a high-velocity flow system can be employed to induce
cavitation or erosion damage on the specimens.
Factors affecting HT/HP test environments. For simple HT/HP exposure
tests involving either aqueous or nonaqueous phases, the total pres-
sure is usually determined by the sum of the pressures of the con-
stituents of the test environment, which will vary with temperature.
Where liquid constituents are being used for the test environment, the
partial pressure is usually taken to be the vapor pressure of the liquid
at the intended test temperature. Vapor pressures for several other
volatile compounds used in HT/HP corrosion testing can be found in
the technical literature. In some cases, higher test pressures can be
obtained by pumping additional gas into the test vessel using a special
gas pump. Alternatively, hydrostatic pressurization may be employed,
in which there is no gas phase in the test vessel and the pressure is
increased by pumping additional liquid into the test vessel in a con-
trolled manner.
18
The importance of partial pressure in HT/HP corro-
sion testing is that the solubility of’ the gaseous constituents in the
liquid phase is usually determined by its partial pressure, which
explains why the effect of some gaseous corrosives is often magnified
at high pressure.
Special HT/HP corrosion test conditions. A chemical species whose chem-
ical behavior affects corrosion resistance and materials performance
is hydrogen. It has been known for decades that atomic hydrogen can
produce embrittlement in many metallic materials. Under high
Acceleration and Amplification of Corrosion Damage 519
0765162_Ch07_Roberge 9/1/99 5:41 Page 519
hydrogen environment pressure, electrochemical reaction, or both,
atomic hydrogen can penetrate structural materials, where it can
react by one of the following mechanisms:
18
■
Recombination to form pressurized molecular hydrogen blisters at
internal sites in the metal
■
Chemical reaction with metal atoms to form brittle metallic
hydrides
■
Solid-state interaction with metal atoms to produce a loss of ductility
and cracks
There has been much interest in conducting hydrogen-induced
cracking (HIC) tests in aqueous media that can produce atomic hydro-
gen on the surface of materials as a result of corrosion or cathodic
charging. In most cases, these tests can be conducted at ambient pres-
sure and at temperatures from ambient to elevated, depending on the
application. When aqueous hydrogen charging is involved, pressure is
usually not a major factor. However, as in the case of steels exposed to
aqueous hydrogen sulfide–containing environments, the atomic hydro-
gen is produced as a result of sulfide corrosion. The severity of the
mass-loss corrosion and hydrogen charging is directly dependent on
the amount of hydrogen sulfide dissolved in the aqueous solution. In
applications involving petroleum production and refining, compressed
natural gas storage, chemical processing, and heavy-water production,
such effects are compounded by exposure to HT and/or HP conditions.
Additionally, variations in pH which control the type and amount of
dissolved sulfide species and the severity of corrosion and hydrogen
charging can be affected by hydrogen sulfide pressure.
Special considerations for testing in high-purity water. There is a growing
awareness that differences in testing procedures in high-temperature
high-purity water, such as that used in the nuclear industry, can pro-
duce very large scatter in the SCC growth rate data. For example, data
from single or multiple laboratories often show scatter of a thousand or
even more, which is too high to establish reliable quantitative depen-
dencies unless very large data sets are generated. Environmental
cracking is influenced by dozens of interdependent material, environ-
ment, and stressing parameters. While there are numerous factors that
need to be controlled for optimal experiments, an even bigger challenge
revolves around interpreting existing data in which critical measure-
ments were not made and other measurements may be misleading. In
general, there is some concern with regard to almost all existing SCC
data, partly because the optimal measurements and techniques are not
fully known, much less agreed upon or standardized.
19
520 Chapter Seven
0765162_Ch07_Roberge 9/1/99 5:41 Page 520
Extensive, careful studies show that the scatter in SCC growth-rate
data can be collapsed substantially from, e.g., the 1000X range that is
observed in some data sets to perhaps a factor of 2 to 5X.
Accomplishing this requires very stable loading and tight control on
temperature and water chemistry, as well as uniform metallurgical
characteristics. While these optimized conditions often yield repro-
ducible crack growth-rate data, it is not uncommon to find no growth
or retarded growth rates in some specimens.
Some distinction must be made among phenomena that involve sto-
chastic processes, like discrete birth and death processes in pit nucle-
ation. These are still subject to errors in measurement and
experimental technique, but are known to possess well-defined, inher-
ent “scatter.” The discrete nature and characteristics of pit nucleation
processes generally justify their being treated separately from a macro-
scopically continuous process like SCC. The types of problems that com-
monly appear in SCC crack growth data obtained in high-temperature
high-purity water can be broken down into the following categories:
19
■
Stress intensity. “Constant” active-K testing (vs. wedge loading) is
preferred, although use of constant displacement is acceptable if it
meets other criteria and less than 15 percent K relaxation has
occurred during the test.
19
■
Test preliminaries. Careful control and documentation of machin-
ing, surface condition, precracking procedures, and preoxidation are
important. Final precracking conditions and SCC loading procedure
are also particularly important.
■
Test temperature. The temperature that is most relevant to boiling
water reactors (BWRs) is between 274 and 288°C.
19
■
Inlet and outlet solution conductivity. Given modern BWR oper-
ation, tests in “high-purity” water require that outlet conductivity
Ͻ0.1 Sиcm
Ϫ1
be achieved, and Ͻ0.07 Sиcm
Ϫ1
at the outlet is both
desirable and achievable for oxygen concentrations Ͻ2 ppm. In
most tests in “high-purity water,” the actual outlet conductivity is
dramatically higher than that of the inlet, as a result of
1. Chromate release by the autoclave chromium-rich materials
2. Decomposition of organic species
3. Release of fluorine from fluorinated polymers or chloride from ref-
erence electrodes
4. In-leakage of carbon dioxide from the air
■
Inlet and outlet dissolved oxygen and hydrogen. These should gen-
erally be measured, unless there is a very strong basis for accepting
nominal values of oxygen for the inlet and outlet. Dissolved hydrogen
Acceleration and Amplification of Corrosion Damage 521
0765162_Ch07_Roberge 9/1/99 5:41 Page 521
levels are important because (1) hydrogen affects the corrosion poten-
tial whether oxygen is present or not, and (2) hydrogen levels even
below 100 ppb may have a significant effect on SCC of high-nickel
alloys below 300°C.
■
Corrosion potentials. These should be measured on the test speci-
men, since it is widely accepted that corrosion potential is a more
fundamental measure of SCC effect than the dissolved oxygen level,
although it is not a truly fundamental parameter in SCC crack
growth.
8
The effect on corrosion potential of acidic/basic impurities
or flow rate may be reported but misunderstood. Since the effect of
corrosion potential is primarily to create a potential gradient in the
crack, the effects of such changes must be carefully interpreted. The
same is true of effects of flow rate on corrosion potential.
19
■
The autoclave refresh rate. This should be high enough to control
intentional (dissolved gases and ionic impurities) and unintentional
contributions (usually ionic impurities) to water chemistry. This
usually requires that the autoclave volume be refreshed 2 to 4 times
per hour.
■
Flow rate. The flow rate should never be a compromising element
of a test program. Since there are few cases in which flow rate is
expected to play a large role in SCC in plant components, laborato-
ry data under high-flow-rate conditions should automatically be
viewed with caution and concern because the crack tip chemistry
can be readily flushed under these conditions.
■
Continuous crack monitoring. This is essential. Reversed DC poten-
tial drop is most commonly used, and good data require a well-behaved
crack extension. Good crack length resolution in modern test facilities
is a few micrometers. The minimum acceptable crack increments need
to be based partly on microstructural considerations. While a wide
variety of microstructures are “sampled” across the width of the speci-
men, there are some concerns that small increments might do a poor
job of sampling and exhibit anomalous behavior.
19
■
Material characteristics. Typical material characteristics should be
known, such as composition, crack orientation, yield strength/hard-
ness, heat-treatment conditions, carbide/phase distribution, and
derived parameters. Composition and welding conditions are also valu-
able in discerning whether weld metal is likely to have experienced hot
cracking, since distinguishing hot cracking from SCC is essential even
though both may contribute to through-wall penetration.
Electrochemical test methods. In view of the electrochemical nature of
corrosion, it is not surprising that measurements of the electrical prop-
522 Chapter Seven
0765162_Ch07_Roberge 9/1/99 5:41 Page 522
erties of the metal/solution interface are extensively used across the
whole spectrum of corrosion science and engineering, from fundamen-
tal studies to monitoring and control in service. Electrochemical test-
ing methods involve the determination of specific interface properties
that can be divided into three broad categories:
1. Potential difference across the interface. The potential at a corroding
interface arises from the mutual polarization of the anodic and
cathodic half-reactions constituting the overall corrosion reaction.
Potential is intrinsically the most readily observable parameter and,
with proper modeling of its value in relation to the thermodynamics
of a system, can provide the most useful information on the state of a
system. The following examples illustrate various applications of
potential measurements to the study of corrosion processes:
■
Determination of the steady-state corrosion potential E
corr
■
Determination of E
corr
trends over time
■
Electrochemical noise (EN) as fluctuations of E
corr
2. Reaction rate as current density. Partial anodic and cathodic cur-
rent densities cannot be measured directly unless they are pur-
posefully separated into a bimetallic couple. By polarizing a metal
immersed in a solution, it is possible to estimate a net current for
the anodic polarization and for the cathodic polarization, from
which a corrosion current density i
corr
can be deduced. Two broad
categories summarize the great number of techniques that have
been developed around these concepts:
■
Determination of E-i relationships by changing the applied poten-
tial, i.e., potentiostatic methods
■
Determination of E-i relationships by changing the applied cur-
rent, i.e. galvanostatic methods
3. Surface impedance. A corroding interface can also be modeled for
all its impedance characteristics, therefore revealing subtle mecha-
nisms not visible by other means. Electrochemical impedance spec-
troscopy is now well established as a powerful technique for
investigating corrosion processes and other electrochemical systems.
Types of polarization test methods. Polarization methods such as poten-
tiodynamic polarization, potentiostaircase, and cyclic voltammetry are
often used for laboratory corrosion testing. These techniques can pro-
vide significant useful information regarding the corrosion mecha-
nisms, corrosion rate, and susceptibility to corrosion of specific
materials in designated environments. Although these methods are
well established, the results they provide are not always clear and
occasionally can be misleading.
20
Acceleration and Amplification of Corrosion Damage 523
0765162_Ch07_Roberge 9/1/99 5:41 Page 523
Polarization methods involve changing the potential of the working
electrode and monitoring the current which is produced as a function
of time or potential. For anodic polarization, the potential is changed
in the anodic (or more positive) direction, causing the working elec-
trode to become the anode and causing electrons to be withdrawn from
it. For cathodic polarization, the working electrode becomes more neg-
ative and electrons are added to the surface, in some cases causing
electrodeposition. For cyclic polarization, both anodic and cathodic
polarization are performed in a cyclic manner.
20
The instrumentation
for carrying polarization testing consists of
■
A potentiostat which will maintain the potential of the working elec-
trode close to a preset value.
■
A current-measuring device for monitoring the current produced by
an applied potential. Some potentiostats output the logarithm of the
current directly, which will allow plotting of the current vs. potential
curves. The ability of the current-measuring device to autorange or
to change the scale automatically is also important.
■
Ability to store the data directly in a computer or plot them out
directly. This is also important.
■
Polarization cells. Several test cells for making polarization mea-
surements are available commercially. Polarization cells can have
various configurations specific to the testing requirements,
whether testing small coupons or testing sheet materials or testing
inside autoclaves. In a plant environment, the electrodes may be
inserted directly into a process stream. Some of the features of a
cell include
20
1. The working electrode, i.e., the sample for testing or analysis,
which may be accompanied by one or more auxiliary or counter-
electrodes.
2. The reference electrode, which is often separated from the solu-
tion by a solution bridge and Luggin probe. This combination
eliminates solution interchange with the reference electrode but
allows it to be moved very close to the surface of the working elec-
trode to minimize the effect of the solution resistance.
3. A thermometer to determine temperature.
4. An inlet and outlet for gas to allow deaeration, aeration, or intro-
duction of specific gases into the solution.
5. Ability to make an electrical connection directly with the working
electrode, which will not be affected by the solution.
6. Introduction of the working electrode into the solution completely
so as to eliminate any crevice at the solution interface, unless this
is a desired effect.
524 Chapter Seven
0765162_Ch07_Roberge 9/1/99 5:41 Page 524
Acceleration and Amplification of Corrosion Damage 525
7. The test cell itself, composed of a material that will not corrode or
deteriorate during the test, and that will not contaminate the test
solution. The volume of the cell must be large enough to allow
removal of the corroding ions from the surface of the working elec-
trode without affecting the solution potential.
8. If necessary, a mechanism for stirring the solution, such as a stir-
ring bar or bubbling gas, to ensure uniformity of the solution
chemistry.
In ASTM G 3, Standard Practice for Conventions Applicable to
Electrochemical Measurements in Corrosion Testing, there are several
examples of polarization curves. Figure 7.15 illustrates the ideal polar-
ization behavior one could obtain, for example, using the linear polariza-
tion method briefly described below. Figures 7.16 and 7.17 show
hypothetical curves for, respectively, active and active-passive behavior,
while Fig. 7.18 was plotted from actual polarization data obtained with
a S43000 steel specimen immersed in a 0.05 M H
2
SO
4
solution.
Several methods may be used in polarization of specimens for corro-
sion testing. Potentiodynamic polarization is a technique in which the
potential of the electrode is varied at a selected rate by application of
a current through the electrolyte. It is probably the most commonly
-0.3
-0.2
-0.1
0
0.1
0.2
0.3
20 15 10 5 0 -5 -10 -15 -20
Current density
Polarization (E-E
corr
)
Slope = R
p
Figure 7.15 Hypothetical linear polarization plot.
0765162_Ch07_Roberge 9/1/99 5:41 Page 525
used polarization testing method for measuring corrosion resistance
and is used for a wide variety of functions.
20
An important variant of potentiodynamic polarization is the cyclic
polarization test. This test is often used to evaluate pitting suscepti-
bility. The potential is swept in a single cycle (or slightly less than one
cycle), and the size of the hysteresis is examined along with the dif-
ferences between the values of the starting open-circuit corrosion
potential and the return passivation potential. The existence of the
hysteresis is usually indicative of pitting, while the size of the loop is
often related to the amount of pitting.
Another variant of potentiodynamic polarization is cyclic voltamme-
try, which involves sweeping the potential in a positive direction until
a predetermined value of current or potential is reached, then imme-
diately reversing the scan toward more negative values until the orig-
inal value of potential is reached. In some cases, this scan is done
repeatedly to determine changes in the current-potential curve pro-
duced with scanning.
Another variation of potentiodynamic polarization is the poten-
tiostaircase method. This refers to a technique for polarizing an electrode
526 Chapter Seven
0
0.5
1
1.5
2
2.5
3
-1-0.8-0.6-0.4-0.200.20.40.60.81
Polarization (E - E
corr
)
Log (Current density)
Cathodic branch
Anodic slope
Anodic branch
Cathodic slope
E
corr
Log(i
corr
)
Figure 7.16 Hypothetical polarization diagram for an active system with anodic and cathodic
branches.
0765162_Ch07_Roberge 9/1/99 5:41 Page 526
Acceleration and Amplification of Corrosion Damage 527
Potential
E
corr
(corrosion potential)
Log (Current density)
Cathodic current
E
pp
(passivation
potential)
i
p
(passive current)
Oxygen evolution
i
corr
(corrosion current)
i
cc
(critical current)
Anodic current
Transpassive region
Secondary passivity
-1000
-800
-600
-400
-200
0
-6 -5.5 -5 -4.5 -4 -3.5 -3 -2.5 -2 -1.5
200
400
600
800
1000
1200
1400
1600
Log current (A)
Potential (mV vs. SCE)
Figure 7.17 Hypothetical polarization diagram for a passivable system with anodic and
cathodic branches.
Figure 7.18 Typical anodic polarization plot for S43000 steel in a 0.05 M H
2
SO
4
solution.
0765162_Ch07_Roberge 9/1/99 5:41 Page 527
in a series of potential steps in which the time spent at each potential is
constant and the current is often allowed to stabilize prior to changing
the potential to the next step. The step increase may be small, in which
case the technique resembles a potentiodynamic curve, or it may be
large.
20
Another polarization method is electrochemical potentiodynamic
reactivation (EPR), which measures the degree of sensitization of stain-
less steels such as S30400 and S30403 steels. This method uses a poten-
tiodynamic sweep over a range of potentials from passive to active (called
reactivation).
Another widely used polarization method is linear polarization resis-
tance (LPR). The polarization resistance of a material is defined as the
slope of the potential–current density (⌬E/⌬i) curve at the free corro-
sion potential (Fig. 7.15), yielding the polarization resistance R
p
, which
can be itself related to the corrosion current with the help of Eq. (7.3).
21
R
p
ϭϭ (7.3)
where R
p
ϭ polarization resistance
i
corr
ϭ corrosion current
B ϭ empirical polarization resistance constant that can be
related to the anodic (b
a
) and cathodic (b
c
) Tafel slopes
with Eq. (7.4)
B ϭ (7.4)
The Tafel slopes themselves can be evaluated experimentally using
real polarization plots similar to those presented in Figs. 7.16 and 7.17
or obtained from the literature.
21
The corrosion currents estimated
using these techniques can be converted into penetration rates using
Faraday’s law, expressed earlier in Eq. (7.1). Alternatively, corrosion
currents can be transformed using a generic conversion chart such as
that found in Table 7.8 or an alloy-specific conversion table like the one
for converting steel corrosion data in Table 7.9.
The study of uniform corrosion and studies assuming corrosion uni-
formity are probably the most widespread application of electrochem-
ical measurements both in the laboratory and in the field. The
widespread use of these electrochemical techniques does not mean
that they are without complications. Both linear polarization and Tafel
extrapolation need special precautions for their results to be valid. The
main complications or obstacles in performing polarization measure-
ments can be summarized in the following categories:
b
a
b
c
ᎏᎏ
2.3 (b
a
ϩ b
c
)
(⌬E)
ᎏᎏ
(⌬i)
⌬E → 0
B
ᎏ
i
corr
528 Chapter Seven
0765162_Ch07_Roberge 9/1/99 5:41 Page 528
■
Effect of scan rate. The rate at which the potential is scanned may
have a significant effect on the amount of current produced at all val-
ues of potential.
20
The rate at which the potential is changed, the scan
rate, is an experimental parameter over which the user has control.
If not chosen properly, the scan rate can alter the scan and cause a
misinterpretation of the features. The problem is best understood by
picturing the surface as a simple resistor in parallel with a capacitor.
In such a model, the capacitor would represent the double-layer
capacitance and the resistor the polarization resistance, which is
inversely proportional to the corrosion rate [Eq. (7.3)]. The goal is for
the polarization scan rate to be slow enough so that this capacitance
remains fully charged and the current-voltage relationship reflects
only the interfacial corrosion process at every potential. If this is not
achieved, some of the current being generated would reflect charging
of the surface capacitance in addition to the corrosion process, with
the result being that the measured current would be greater than the
current actually generated by the corrosion reactions. When this hap-
pens, the polarization measurement does not represent the corrosion
process, often leading to an erroneous prediction.
22
The question is, what is that proper scan rate? A relatively valid
method would be to use the lower breakpoint frequency of the imped-
ance spectrum as the starting point, provided such EIS measurement
Acceleration and Amplification of Corrosion Damage 529
TABLE 7.8 Conversion between Current, Mass Loss, and Penetration Rates for
All Metals
mAиcm
Ϫ2
mmиyear
Ϫ1
mpy gиm
Ϫ2
иday
Ϫ1
mAиcm
Ϫ2
1 3.28 M/nd 129 M/nd 8.95 M/n
mmиyear
Ϫ1
0.306 nd/M 1 39.4 2.74 d
mpy 0.00777 nd/M 0.0254 1 0.0694 d
gиm
Ϫ2
иday
Ϫ1
0.112 n/M 0.365/d 14.4/d 1
mpy ϭ milli-inches per year; n ϭ number of electrons freed by the corrosion reaction; M ϭ
atomic mass; d ϭ density. As an example, if the metal is iron (Fe), n ϭ 2, M ϭ 55.85 g, and
d ϭ 7.88 gиcm
Ϫ3
.
TABLE 7.9 Conversion between Current, Mass Loss, and Penetration
Rates for Steel
mAиcm
Ϫ2
mmиyear
Ϫ1
mpy gиm
Ϫ2
иday
Ϫ1
mAиcm
Ϫ2
1 11.6 456 249
mmиyear
Ϫ1
0.0863 1 39.4 21.6
mpy 0.00219 0.0254 1 0.547
gиm
Ϫ2
иday
Ϫ1
0.00401 0.0463 1.83 1
mpy ϭ milli-inches per year.
0765162_Ch07_Roberge 9/1/99 5:41 Page 529
is available. The method is based on the premise that the scan rate
(voltage rate of change) is analogous to a frequency at every applied
potential. That frequency must be low enough so that the impedance
magnitude is independent of frequency. Then the polarization or
charge transfer resistance is being measured with no interference
from the capacitance.
The frequency below which there is no capacitive contribution is
about an order of magnitude lower than the breakpoint frequency.
The assumption is that this lower frequency is analogous to a scan
rate. The conversion to a scan rate is made by assuming that over
some small voltage amplitude, e.g., 5 mV, the voltage-current rela-
tionship is linear and the linear range corresponds to half of a sinu-
soidal wave. Table 7.10 shows estimated maximum scan rates for
several polarization resistance, solution resistance, and capacitance
values typically encountered in practice.
■
Effect of solution resistance. The distance between the Luggin
probe (of the salt bridge to the reference electrode) and the working
electrode is purposely minimized in most measurements to limit the
effect of the solution resistance. In solutions that have extremely
high resistivity, this can be an extremely significant effect. Many
materials of importance to corrosion measurements, such as con-
crete, soil, organic solutions, and many others, have high resistivity,
but can also be strongly corrosive to some metals. It is important to
be able to make polarization measurements in these high-resistivity
environments. A method of interrupting the current and monitoring
530 Chapter Seven
TABLE 7.10 Examples of Maximum Scan Rates for Performing Valid Polarization
Plots
Solution resistance, Polarization resistance, Capacitance, Maximum scan rate,
⍀иcm
2
k⍀иcm
2
Fиcm
Ϫ2
mVиs
Ϫ1
10 1 100 5.1
10 10 100 0.51
10 100 100 0.05
10 1000 100 0.005
100 1 100 6.3
100 10 100 0.51
100 100 100 0.05
100 1000 100 0.005
10 1 20 25
10 10 20 2.5
10 100 20 0.25
10 1000 20 0.025
100 1 20 50
100 10 20 2.6
100 100 20 0.25
100 1000 20 0.025
0765162_Ch07_Roberge 9/1/99 5:41 Page 530
the decay of the potential as a function of time can be used to mea-
sure the solution resistance and to determine the actual resistance
between the reference and working electrodes.
■
Changing surface conditions. Since corrosion reactions take place
at the surface of materials, when the surface is changed as a result
of processing conditions, active corrosion, or other reasons, the
potential is usually also changed. This can have a strong effect on
the polarization curves.
20
■
Determination of pitting potential. In analyzing polarization
curves, the appearance of a hysteresis (or loop) between the forward
and reverse scans is often thought to denote the presence of localized
corrosion (pitting or crevice corrosion). This observation is particu-
larly valid when the corrosion potential is higher or more noble than
the pitting potential.
The need for further testing in the face of ambiguous or conflicting
polarization results is one of the most important things that can be
learned from a single test. The additional steps required when the
results of a single test or type of test are ambiguous include
20
1. Rerun the test under equivalent conditions. This will minimize test-
to-test variations.
2. Identify conflicting or ambiguous results. Careful identification of
the areas of conflict can provide a starting point for further analy-
sis or testing.
3. Evaluate alternative answers to the conflict or ambiguity. Is there
another possible explanation for the results (such as changes in the
sample, surface, solution, or stirring rate; possible contamination;
or electronic hardware problems)?
4. Run another type of test. Many tests give complementary informa-
tion which may uncover the difficulty with the initial result.
Sometimes a simple examination of the sample visually will locate
crevice attack, oxide buildup, or surface changes that have occurred
and have led to the ambiguous or conflicting data obtained initially.
Cyclic potentiodynamic polarization. The electrochemical technique
that has gained the most widespread acceptance as a general tool for
assessing the possibility of an alloy suffering localized corrosion is
probably the cyclic potentiodynamic polarization technique. This
technique has been especially useful in assessing localized corrosion
for passivating alloys such as S31600 stainless steel, nickel-based
alloys containing chromium, and other alloys such as titanium and
zirconium.
22
Acceleration and Amplification of Corrosion Damage 531
0765162_Ch07_Roberge 9/1/99 5:41 Page 531
The cyclic potentiodynamic polarization technique for corrosion stud-
ies was introduced in the 1960s and refined during the 1970s into a
fairly simple technique for routine use. In this technique, the voltage
applied to an electrode under study is ramped at a continuous rate rel-
ative to a reference electrode using a potentiostat. The voltage is first
increased in the anodic or noble direction (forward scan). At some cho-
sen current or voltage, the voltage scan direction is reversed toward the
cathodic or active direction (backward or reverse scan). The scan is ter-
minated at another chosen voltage, usually either the corrosion poten-
tial or some active potential. The potential at which the scan is started
is usually the corrosion potential. The corrosion behavior is predicted
from the structure of the polarization scan. Though the generation of
the polarization scan is simple, its interpretation can be difficult.
22
Features useful in interpretation. Figures 7.19 through 7.22 show
typical polarization scans that might be observed in practice. The figures
are drawn assuming an arbitrary minimum recorded current (e.g., 100
nAиcm
Ϫ2
) that would lie above the actually measured minimum current
(e.g., 1 nAиcm
Ϫ2
) sometimes observed in an experiment. Hence, the scan
may sometimes cross the potential axis, set at some arbitrary current.
532 Chapter Seven
Potential
Log (current density)
Figure 7.19 Typical polarization scan for an alloy suggesting a significant risk of local-
ized corrosion in the form of crevice corrosion or pitting (the arrow indicates scanning
direction).
0765162_Ch07_Roberge 9/1/99 5:41 Page 532
Pitting and repassivation potentials. Two potentials that are often
thought to characterize an alloy in terms of localized corrosion are the
repassivation potential and the pitting potential and their values rela-
tive to the corrosion potential. A common interpretation is that pitting
would occur if the hysteresis between the forward and reverse scans
appeared as in Fig. 7.19 and the corrosion potential were equal to or
anodic with respect to the pitting potential. The specimen under test
would be expected to resist localized corrosion if the corrosion poten-
tial lay cathodic with respect to the repassivation potential or if the
polarization scan appeared as in Fig. 7.20.
22
There are several ways to choose the repassivation potential. It can
be chosen as the potential at which the anodic forward and reverse
scans cross each other. Alternatively, it can be chosen as that potential
at which the current density reaches its lowest readable value on the
reverse portion of the polarization scan. One reason to choose the lat-
ter is that for some polarization scans, such as that in Fig. 7.20, the
forward and reverse portions of the polarization scan do not cross each
other. In any case, the choice should be consistent for all scans in any
particular study.
Acceleration and Amplification of Corrosion Damage 533
Potential
Log (current density)
Repassivation potential
Anodic/cathodic transition
Corrosion potential
Figure 7.20 Typical polarization scan for a completely passive alloy suggesting little risk
of crevice corrosion, pitting, or general corrosion (the arrow indicates scanning direction).
0765162_Ch07_Roberge 9/1/99 5:41 Page 533
The pitting potential is that potential at which the forward or
ascending portion of the scan shows a rapid rise in current, followed by
a negative hysteresis between the forward and reverse portions of the
scan, as in Fig. 7.19. Often, the electrode surface exhibits small pits
after the experiment. Controversy still surrounds the meaning of these
potentials. The values measured are not intrinsic properties of the
alloy and are influenced by a variety of experimental variables. The
pitting potential as determined by the potentiodynamic scan has been
shown to be related qualitatively to the resistance of a material to a
loss of passivity by pit initiation. If a crevice develops in a portion of
the specimen—between the electrode and its holder, for example—the
pitting potential will probably reflect the breakdown of passivity in
that crevice.
22
Hysteresis. The hysteresis refers to a feature of the polarization
scan in which the forward and reverse portions of the scan do not over-
lay each other. The hysteresis shown in both Figs. 7.19 and 7.20 is the
result of the disruption of the passivation chemistry of the surface by
the increase in potential and reflects the ease with which that passi-
vation is restored as the potential is decreased back toward the corro-
534 Chapter Seven
Potential
Log (current density)
Figure 7.21 Typical polarization scan for an alloy possibly suffering from general high
corrosion (the arrow indicates scanning direction).
0765162_Ch07_Roberge 9/1/99 5:41 Page 534
sion potential. For a given experimental procedure, the larger the hys-
teresis, the greater the disruption of surface passivity, the greater the
difficulty in restoring passivity, and, usually, the greater the risk of
localized corrosion.
Approaching a potential from more active potentials at a certain
scan rate will create a surface structure different from that created
when approaching the potential from more noble potentials. The “pos-
itive” hysteresis shown in Fig. 7.20 is caused by the polarization to
more noble potentials making the surface more passive. The “nega-
tive” hysteresis in Fig. 7.19 is caused by a decrease in passivity, often
produced by the initiation of localized corrosion. This latter phenome-
non is usually a reflection of a propensity for localized corrosion in the
form of either pitting or crevice corrosion. From a practical standpoint,
a positive hysteresis usually signifies that the alloy will be more resis-
tant to localized corrosion than does a negative hysteresis.
22
Active-passive transition or anodic nose. The anodic nose reflects
the characteristic in which the current increases rapidly with increas-
ing potential in the anodic direction near the corrosion potential, goes
Acceleration and Amplification of Corrosion Damage 535
Potential
Log (current density)
Figure 7.22 Typical polarization scan for an alloy that has an easily oxidizable/reducible
surface species without being passive at the corrosion potential (the arrow indicates
scanning direction).
0765162_Ch07_Roberge 9/1/99 5:41 Page 535