Handbook of Corrosion Engineering Episode 1 Part 13 pptx
Bạn đang xem bản rút gọn của tài liệu. Xem và tải ngay bản đầy đủ của tài liệu tại đây (617.29 KB, 40 trang )
The first requirement can be met with real-time corrosion monitoring
systems, provided that the monitoring techniques selected are suffi-
ciently sensitive to respond rapidly to changes in the process conditions.
Corrosion monitoring techniques (such as coupons) that yield only ret-
rospective, cumulative corrosion damage data are not suitable for this
purpose.
Modern industrial facilities usually are equipped with systems that
form the foundation for the second requirement. Historical inspection
data, failure analysis reports, analytical chemistry records, databases
of operational parameters, and maintenance management systems are
usually in place. The main task, therefore, is one of combining and
integrating corrosion data into these existing (computerized) systems.
In many organizations, much of the technical infrastructure required
for achieving “corrosion process control” is already in place. Only the
addition of certain corrosion-specific elements to existing systems may
be needed.
430 Chapter Six
Operations
Maintenance
Research and External
Information
Procedural Manuals
Status Reports
Revised Standards
Inspection
Operational Activities
Operating
Practices
Maintenance
Plans
Inspection
Plans
Precommissioning
Construction
Design
Development
Activities
Corrosion,
Inspection
Database
Data
Analysis
Revised Operating Practices,
Maintenance Plans and
Inspection Plans
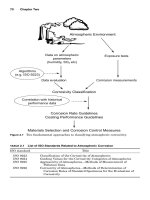
Figure 6.17 Information flow in corrosion management. (Adapted from Milliams and
Van Gelder.
22
)
0765162_Ch06_Roberge 9/1/99 5:01 Page 430
As discussed earlier, corrosion monitoring plays a pivotal part in
moving away from corrective corrosion maintenance practices to
more effective preventive and predictive strategies. As confidence in
monitoring data is established over time, through experience and
correlation with other data/information such as that found through
nondestructive evaluation and failure analysis, these data can assist
in defining suitable maintenance schedules. If the rate of corrosion
can be estimated from corrosion monitoring data (precise measure-
ments are rarely achieved in practice) and the existing degree of cor-
rosion damage is known from inspection, an estimate of corrosion
damage as a function of time is available for maintenance schedul-
ing purposes. Furthermore, sensitive corrosion monitoring tech-
niques can provide early warning of imminent serious corrosion
damage so that maintenance action can be taken before costly dam-
age or failure occurs.
In practice, corrosion monitoring is generally considered to be a
supplement to conventional inspection techniques, not a replacement.
Once a serious corrosion problem has been identified through inspec-
tion, a corrosion monitoring program is usually launched to investi-
gate the problem in greater depth. Corrosion monitoring and
inspection are thus usually utilized in tandem. In the case of the
smart structures monitoring concept, corrosion monitoring can essen-
tially be considered to be a real-time (“live”) inspection technique. The
combination of corrosion monitoring and inspection data/information
is a major organizational asset with the following uses:
22
■
Verifying design assumptions and confirming the design approach
■
Identifying possible threats to an installation’s integrity
■
Planning operation, maintenance, and inspection requirements in
the longer term
■
Confirming and modifying standards and guides for future designs
Modern computerized database tools can be used to great advantage
in the above tasks. The cause of many corrosion failures can be traced
to underutilization of inspection and corrosion monitoring data and
information.
From the above model, it is apparent that any leader of a corrosion
monitoring program has to be comfortable with functioning in a multi-
disciplinary environment. Furthermore, corrosion monitoring informa-
tion should be communicated to a wide range of functions, including
design, operations, inspection, and maintenance. To facilitate effective
communication and involvement of management in corrosion issues, cor-
rosion monitoring data have to be processed into information suitable for
Corrosion Maintenance through Inspection and Monitoring 431
0765162_Ch06_Roberge 9/1/99 5:01 Page 431
management and nonspecialist “consumption.” Enormous advances in
computing technology can be exploited to meet the above requirements.
Corrosion monitoring examples
Monitoring reinforcing steel corrosion in concrete. In view of the large-scale
environmental degradation of the concrete infrastructure in North
America and many other regions, the ability to assess the severity of
corrosion in existing structures for maintenance and inspection
scheduling and the use of corrosion data to predict the remaining ser-
vice life are becoming increasingly important. Several electrochemi-
cal techniques have been used for these purposes, with either
embedded probes or the actual structural reinforcing steel (rebar)
serving as sensing elements. A few indirect methods of assessing the
risk of corrosion are also available.
In the civil engineering and construction industry, corrosion mea-
surements are usually “one-off” periodic inspections. While such mea-
surements can be misleading, it is at times difficult to make a
persuasive argument for continuous measurements, in view of the
fact that rebar corrosion is often manifested only after decades of ser-
vice life. As a result of advances in corrosion monitoring technology
and selected on-line monitoring studies that have demonstrated the
highly time-dependent nature of rebar corrosion damage, continuous
measurements may gradually find increasing application.
Furthermore, the concept of smart reinforced concrete structures is
gaining momentum through the utilization of a variety of diagnostic
sensing systems. The integration of corrosion monitoring technology
into such systems to provide early warning of costly corrosion damage
and information on where the damage is taking place appears to be a
logical evolution.
Rebar potential measurements. The simplest electrochemical rebar
corrosion monitoring technique is measurement of the corrosion poten-
tial. A measurement procedure and data interpretation procedure are
described in the ASTM C876 standard. The basis of this technique is
that the corrosion potential of the rebar will shift in the negative direc-
tion if the surface changes from the passive to the actively corroding
state. A simplified interpretation of the potential readings is present-
ed in Table 6.8.
Apart from its simplicity, a major advantage of this technique is that
large areas of concrete can be mapped with the use of mechanized
devices. This approach is typically followed on civil engineering struc-
tures such as bridge decks, for which potential “contour” maps are pro-
duced to highlight problem areas. The potential measurements are
usually performed with the reference electrode at the concrete surface
and an electrical connection to the rebar.
432 Chapter Six
0765162_Ch06_Roberge 9/1/99 5:01 Page 432
In a more recent derivative of this technique, a reference electrode has
been embedded as a permanent fixture, in the form of a thin “wire.”
23
With this technique, the corrosion potential can be monitored over the
entire length of a rebar section, rather than relying on point measure-
ments above the surface. However, this method will not reveal the loca-
tion of corroding areas along the length of the rebar. A proposed hybrid
of this technique is the measurement of potential gradients between two
surface reference electrodes, eliminating the need for direct electrical
contact with the rebar.
The results obtained with this technique are only qualitative, with-
out any information on actual rebar corrosion rates. Highly negative
rebar corrosion values are not always indicative of high corrosion
rates, as the unavailability of oxygen may stifle the cathodic reaction.
LPR technique. This technique is widely used to monitor rebar cor-
rosion. It has been used with embedded sensors, which may be posi-
tioned at different depths from the surface to monitor the ingress of
corrosive species. Caution needs to be exercised in the sensor design in
view of the relatively low conductivity of the concrete medium.
Furthermore, the current response to the applied perturbation does
not stabilize quickly in concrete, typically necessitating a polarization
time of several minutes for these readings.
Efforts have also been directed at applying the LPR technique
directly to structural rebars, with the reference electrode and coun-
terelectrode positioned above the rebar on the surface. It was real-
ized that the applied potential perturbation and the resulting
current response may not be confined to a well-defined rebar area.
The development of guard ring devices, which attempt to confine the
LPR signals to a certain measurement area, resulted from this fun-
damental shortcoming. The guard ring device shown schematically
in Fig. 6.18 can be conveniently placed directly over the rebar of
interest and requires only one lead attachment to the rebar, as
for the simple potential measurements. The guard ring is maintained
at the same potential as the counterelectrode to minimize the current
from the counterelectrode flowing beyond the confinement of the
guard ring. An evaluation of several LPR-based rebar corrosion mea-
suring systems has been published.
24
Corrosion Maintenance through Inspection and Monitoring 433
TABLE 6.8 Significance of Rebar Corrosion Potential Values (ASTM C876)
Potential (volts vs. CSE) Significance
ϾϪ0.20 Greater than 90% probability that no
corrosion is occurring
ՅϪ0.20 and ՆϪ0.35 Uncertainty over corrosion activity
ϽϪ0.35 Greater than 90% probability that corrosion
is occurring
0765162_Ch06_Roberge 9/1/99 5:01 Page 433
Corrosion rates (expressed as thickness loss/time) can be derived
from guard ring devices following the polarization cycle, but there are
many simplifying assumptions in these derivations, and so they
should be treated as semiquantitative at best. Important limitations
include the following:
■
Corrosion damage is assumed to be uniform over the measurement
area, whereas chloride-induced rebar corrosion is localized.
■
IR drop errors are problematic in rebar corrosion measurements,
and “compensation” for them by commercial instruments is not nec-
essarily accurate.
434 Chapter Six
Guard Ring
Sponge Pad
Concrete
Guard Ring
Sensor Holder
Counter
Electrode
Reference
Electrodes
Sensor Surface
in Contact with
Concrete
Rebar
(Working Electrode)
Slope
Calib Temp
pH
mV
ON
OFF
Figure 6.18 Guard ring device for electrochemical rebar corrosion monitoring
(schematic).
0765162_Ch06_Roberge 9/1/99 5:01 Page 434
■
Even if the guard ring confines the measurement signals perfectly,
the exact rebar area of the measurement is not known. (How far
does the polarization applied from above the rebar actually spread
around the circumference of the rebar?)
■
The influence of cracks and concrete spalling on these measurements
remains unclear at present
■
There are fundamental theoretical considerations in the LPR tech-
nique (described earlier).
Galvanostatic pulse technique. This technique also uses an electro-
chemical perturbation applied from the surface of the concrete to the
rebar. A current pulse is imposed on the rebar, and the resultant rebar
potential change ⌬E is recorded by means of a reference electrode.
Typical current pulse duration ⌬t and amplitude have been reported to
be 3 s and 0.1 mA, respectively.
25
The slope ⌬E/⌬t, measured during the current pulse, has been used
to provide information on rebar corrosion. High slopes have been
linked to passive rebar, whereas localized corrosion damage was asso-
ciated with a very low slope. This behavior can be rationalized on the
basis of potentiodynamic polarization curves for systems displaying
pitting corrosion.
Electrochemical impedance spectroscopy. Like those made by dc
polarization techniques, EIS measurements can be applied to sepa-
rate, small, embedded corrosion probes or directly to structural rebars.
Efforts to accomplish the latter have involved guard ring devices and
the modeling of signal transmission along the length of the rebar.
Using a so-called transmission-line model, it has been shown that the
penetration depth of the perturbation signal along the length of the
rebar is dependent on the perturbation frequency.
26
A number of different equivalent-circuit models have been proposed
for the steel-in-concrete system; one relatively complex example is
shown in Fig. 6.19.
27
By accounting for the concrete “solution” resis-
tance and the use of more sophisticated models, a more accurate corro-
sion rate value than that provided by the more simplistic LPR analysis
should theoretically be obtained. The main drawbacks of EIS rebar
measurements over a wide frequency range are their lengthy nature
and the requirement for specialized electrochemistry knowledge.
Zero-resistance ammetry. The macrocell current measured between
embedded rebar probes has been used for monitoring the severity of cor-
rosion. This principle has been widely used, as part of the ASTM G102-92
laboratory corrosion test procedure, with current flow between probes
located at different depths of cover. For the monitoring of actual struc-
tures, a similar approach has been adopted.
28
Here, current flow has been
measured between carbon steel probe elements strategically positioned at
Corrosion Maintenance through Inspection and Monitoring 435
0765162_Ch06_Roberge 9/1/99 5:01 Page 435
different levels within the concrete and an inert material such as stain-
less steel. Current flows between the carbon steel and stainless steel sens-
ing elements are insignificant when the former alloy remains in the
passive condition. Initiation of corrosion attack on the carbon steel is
detected by a sudden increase in the measured current. Positioning the
carbon steel elements at different depths from the concrete surface
reveals the progressive ingress of corrosive species such as chlorides and
provides a methodology for providing early warning of damage to the
actual structural rebar, located at a certain depth of cover.
The current flowing between identical probe elements can also be
used for corrosion monitoring purposes, even if the elements are locat-
ed at similar depths. It can be argued that such measurements are
mainly relevant to detecting the breakdown of passivity and the early
stages of corrosion damage, before extensive corrosion damage is man-
ifested on both of the probe elements.
Electrochemical noise measurements. There may be skepticism
about the application of electrochemical noise measurements to indus-
trial rebar corrosion monitoring. Concerns about the perceived “over-
sensitivity” of the technique and fears of external signal interference
have been raised. While such concerns may be justified in certain cas-
es, electrochemical noise measurements have been performed with
probes embedded in large concrete prisms (up to 4 m long). These
436 Chapter Six
R
S
C
C
R
C
C
f
R
f
C
dl
R
ct
Diffusion
Processes
in Concrete
Deposition of Lime-rich
Surface Films on the
Reinforcing Steel
Charge Transfer
Resistance across
the Double Layer
Dielectric Nature
of Concrete
(most significant
in dry Concrete)
Electrolyte
Resistance
Double Layer
Capacitance
Warburg
Diffusion
Figure 6.19 Example of an equivalent circuit for the steel-in-concrete system. (Adapted
from Jafar et al.
27
)
0765162_Ch06_Roberge 9/1/99 5:01 Page 436
prisms were exposed in the Vancouver harbor and in clarifier tanks of
the paper and pulp industry.
29
Initial results from this long-term mon-
itoring program suggested that the noise signals did provide a sensi-
ble indication of rebar corrosion activity, and no major signal
interference problems were encountered. In a more fundamental
analysis of the application of electrochemical noise to rebar corrosion,
Bertocci
30
concluded that this technique had considerable limitations
and that further studies were required before the method could be
used with confidence. Much work remains to be done in the signal
analysis field, to automate data analysis procedures.
Monitoring aircraft corrosion. In the present economic climate, both com-
mercial and military aircraft operators are faced with the problem of
aging fleets. Some aircraft in the U.S. Air Force (USAF) currently have
projected life spans of up to 60 to 80 years, compared with design lives
of only 20 to 30 years. It is no secret that corrosion problems and the
associated maintenance costs are highest in these aging aircraft.
Aircraft corrosion falls into the atmospheric corrosion category, details
of which are provided in Sec. 2.1, Atmospheric Corrosion.
While corrosion inspection and nondestructive testing of aircraft are
obviously widely practiced, corrosion monitoring activity is only begin-
ning to emerge, led by efforts in the military aircraft domain. In recent
years, prototype corrosion monitoring systems have been installed on
operational aircraft in the United States, Canada, Australia, the
United Kingdom, and South Africa. Several systems are in the labora-
tory and ground-level research and testing phases, particularly those
involving the emerging corrosion monitoring techniques described ear-
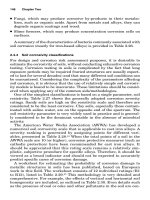
lier. The “bigger picture” role of corrosion monitoring in a research pro-
gram on corrosion control for military aircraft is illustrated in Fig.
6.20. The interest in aircraft corrosion monitoring activities is related
to three potential application areas:
■
Reducing unnecessary inspections
■
Optimizing certain preventive maintenance schedules
■
Evaluating materials performance under actual operating conditions
The first application area arises from the fact that many corrosion-
prone areas of aircraft are difficult to access and costly to inspect.
Typically, these areas are inspected on fixed schedules, regardless of
whether corrosion has taken place or not on a particular aircraft.
Unnecessary physical inspections could be eliminated and substantial
cost savings could be realized if the severity of corrosion damage in
inaccessible areas could be determined by corrosion sensors. Several
prototype on-board corrosion monitoring systems have already been
Corrosion Maintenance through Inspection and Monitoring 437
0765162_Ch06_Roberge 9/1/99 5:01 Page 437
installed, to demonstrate the ability of corrosion sensors to detect dif-
ferent levels of corrosive attack in different parts of an aircraft.
One such corrosion surveillance system was installed on an unpres-
surized transport aircraft. Electrochemical probes in the form of closely
spaced probe elements were manufactured from an uncoated aluminum
alloy (Fig. 6.21). All but one of the probes were located inside the air-
craft, in the areas that were most prone to corrosion attack and difficult
to access. Another probe was located outside the aircraft, in its wheel
bay.
31
In flights from inland to marine atmospheres, a distinct increase
in corrosiveness was recorded by potential noise surveillance signals
during the landing phase in the marine environment (Fig. 6.22).
However, the strongest localized corrosion signals were recorded at
ground level in a humid environment (Fig. 6.23).
A different system based on ER sensors was installed on a CP-140
maritime patrol aircraft, as illustrated in Fig. 6.24. In this case, high
corrosion rates were measured in the wheel bay, relative to corrosion
438 Chapter Six
On-board monitoring
Corrosion Control &
Prevention Maintenance
Program
Information processing
Rationalization
MSG-3
Data acquisition
Probes: electrochemical,
chemical, fiber optic
Interpretation
Corrosion inhibition (CIC)
Severity of the environment:
corrosion kinetics
Washing intervals
Repaint intervals
Paint renewal
Predictive Modeling
Failure analysis
reports
DLIR
reports
AMMIS-ASMIS
CORGRAPH
Figure 6.20 Research program for military aircraft, including the role of corrosion
monitoring.
0765162_Ch06_Roberge 9/1/99 5:01 Page 438
Figure 6.21 Electrochemical probe in the form of closely spaced elements manufac-
tured from an uncoated aluminum alloy.
6:52
10 mV
1000 nA
0.1 nA
1000 mbar
0 mbar
-20°C
80°C
1 µV
Time 8:46
Temperature
Max: +1.82E+01
Min: +1.09E+01
Mean:+1.31E+01
Sdev: +2.42E+00
Cvar: +1.85E-01
Units: deg C
Scale: linear
Pressure
Max: +1.00E+03
Min: +6.71E+02
Mean:+7.42E+02
Sdev: +1.09E+02
Cvar: +1.47E-01
Units: mbar
Scale: linear
ECN
Max: +1.90E-09
Min: +3.83E-10
Mean:+4.87E-10
Sdev: +2.25E-10
Cvar: +4.62E-01
Units: amps
Scale: log
EPN
Max: +3.73E-04
Min: +1.93E-06
Mean:+3.35E-05
Sdev: +7.09E-05
Cvar: +2.12E-00
Units: volts
Scale: log
Figure 6.22 Temperature, pressure, and electrochemical signals as a function of time
during a flight to a marine environment in South Africa.
0765162_Ch06_Roberge 9/1/99 5:01 Page 439
rates in other locations. More recent developments in this field
include the use of thin-film electrochemical corrosion sensors (includ-
ing wireless communication with these sensors) and the development
of customized electrochemical sensors for monitoring corrosion in lap
joints. Some new corrosion monitoring techniques for measuring air-
craft corrosion in a more distributed manner are under development.
Practical criticism has been directed at electrochemical sensors
because they are restricted to measuring corrosion over a small sur-
face area only.
One of the primary forms of preventive maintenance in maritime
military aircraft is washing. The corrosiveness of the environment in
which an aircraft operates usually is not a factor in the washing sched-
ule. The unsatisfactory nature of this approach with respect to control-
ling corrosion damage has been highlighted. Corrosion monitoring
systems installed at ground level and on board flying aircraft have
demonstrated that the environmental corrosivity changes significantly
over time and also varies for different parts of an aircraft. Arguably,
therefore, selected inspection and maintenance schedules could be opti-
mized based on the severity of the environmental corrosivity to which
a particular aircraft has been exposed, as measured by corrosion mon-
itoring systems.
On-board corrosion monitoring systems can facilitate the testing
and evaluation of aircraft materials and corrosion control methods
under actual operating conditions. Sensitive techniques make such
evaluations possible in short time frames.
440 Chapter Six
22:37 (day 5)
10 mV
1000 nA
0.1 nA
1 µV
Time 06:36 (day 6)
ECN
Max: +5.34E-09
Min: +6.04E-10
Mean:+8.72E-10
Sdev: +4.63E-10
Cvar: +5.31E-01
Units: amps
Scale: log
EPN
Max: +2.78E-03
Min: +2.76E-06
Mean:+1.23E-04
Sdev: +2.40E-04
Cvar: +1.95E-00
Units: volts
Scale: log
Figure 6.23 Electrochemical signals as a function of time in a marine environment in
South Africa.
0765162_Ch06_Roberge 9/1/99 5:01 Page 440
Monitoring corrosion under thin-film condensate conditions. Highly corrosive
thin-film electrolytes can be formed in several industrial processes.
These conditions arise when gas streams are cooled to below the dew
point. The resulting thin electrolyte layer (moisture) often contains
highly concentrated corrosive species. Probe design and establishment
of suitable measuring techniques for corrosion monitoring under such
conditions are relatively difficult. One technique, electrochemical
noise, has shown considerable promise; it is extremely sensitive and
can be used in environments of low conductivity. Since the surface cov-
erage of thin-film electrolytes is discontinuous at times, the latter
aspect is important.
A corrosion probe used for electrochemical noise measurements in a
gas scrubbing tower of a metal production plant is illustrated in Figs.
6.25 and 6.26. A retractable probe was selected so that the sensor sur-
face could be mounted flush with the internal scrubber wall surface.
The close spacing of the carbon steel sensor elements, designed specif-
ically for (discontinuous) thin surface electrolyte films, should be not-
ed. This corrosion sensor was connected to a computer-controlled
miniaturized multichannel corrosion monitoring system by shielded
multistrand cabling. As the ducting of the gas scrubbing tower was
heavily insulated, no special measures were taken to cool the corrosion
sensor surfaces. Cooling of probes in such applications is usually nec-
essary if the corrosion sensor surfaces are to attain the same temper-
Corrosion Maintenance through Inspection and Monitoring 441
Figure 6.24 On-board ER corrosion sensors installed on a CP-140 maritime patrol
aircraft.
0765162_Ch06_Roberge 9/1/99 5:01 Page 441
ature as the internal duct surfaces. In general, the sensor surfaces of
an electrochemical corrosion probe positioned in an access fitting will
reach higher steady-state temperatures than the actual ducting sur-
face—hence the requirement for cooling.
Potential noise and current records recorded at a conical section at
the base of the gas scrubbing tower are presented in Fig. 6.27. At this
location, condensate tended to accumulate, and highly corrosive condi-
tions were noted from the operational history of the plant. The high
levels of potential noise and current noise in Fig. 6.27 are entirely con-
sistent with the operational experience. It should be noted that the
current noise is actually off-scale, in excess of 10 mA, for most of the
monitoring period. The high corrosivity indicated by the electrochemi-
cal noise data from this sensor location was confirmed by direct evi-
dence of severe pitting attack on the sensor elements, revealed by
scanning electron microscopy (Fig. 6.28). In contrast, at a position
higher up in the tower, where the sensor surfaces remained dry, the
electrochemical noise remained at completely negligible levels (refer to
Fig. 6.27).
Corrosion monitoring studies of this nature have proved useful for
identifying process conditions that lead to the formation of highly cor-
rosive thin-film electrolytes, revealing the most corrosive areas, and
evaluating materials designed to resist such attack in the most cost-
442 Chapter Six
Connector to Monitoring
Instrumentation
Ball Valve
Corrosion Sensor
Elements
Figure 6.25 Corrosion sensor and access fitting used for thin-film corrosion monitoring.
0765162_Ch06_Roberge 9/1/99 5:01 Page 442
effective manner. Such monitoring programs have been performed in
gas ducting, gas stacks, and also gas piping.
Monitoring corrosion in heat-exchanger tubes of cooling-water circuits. Tube-
and-shell heat exchangers are widely used in the cooling-water cir-
cuits of diverse branches of industry. Corrosion damage is usually a
major concern in such units, and water treatment is commonly used
as a means of corrosion control. Despite water treatment additives,
however, corrosion failures continue to occur, and numerous corro-
sion failure modes have been documented. Localized corrosion dam-
age can include pitting, crevice corrosion, and stress corrosion
cracking. Such localized failures are typically related to fouling or
scaling of the tube surfaces, chloride ions in the water, or microbial
activity. Uniform corrosion damage may be sustained during acid
descaling operations, if these are not closely controlled. Corrosion
monitoring of heat-exchanger tube surfaces is technically extremely
challenging for the following reasons:
Corrosion Maintenance through Inspection and Monitoring 443
Corrosion Sensing
Elements
Figure 6.26 Close-up of corrosion sensing elements used for thin-film corrosion
monitoring.
0765162_Ch06_Roberge 9/1/99 5:01 Page 443
444 Chapter Six
0
-2
30
40
50
60
70
80
0
2
4
6
8
10
500 1000 1500 2000
Time (seconds)
Current (mA)
Potential (mV)
Potential at Tower Base
Current at Tower Base
Current and Potential at Elevated Position in Tower
(no measurable value)
Figure 6.27 Potential and current noise records at two locations in a gas scrubbing
tower.
Figure 6.28 Scanning electron microscope image of a sensor element surface after expo-
sure at the base of the scrubbing tower. Microscopic corrosion pits are clearly evident.
0765162_Ch06_Roberge 9/1/99 5:01 Page 444
■
A multitude of corrosion modes can lead to damage.
■
Monitoring localized corrosion damage, a common problem, is dif-
ficult.
■
Corrosion damage occurs under heat-transfer conditions.
■
Access to the tightly packed tubes is extremely limited.
In order to overcome the access problems of fitting corrosion sensors
into the heat exchanger, a bypass strategy can be followed. Water flow-
ing through the actual heat exchanger is deviated to a side stream,
which then flows through a model heat exchanger. The model heat
exchanger can be instrumented with corrosion sensors relatively easi-
ly. If electrochemical corrosion sensors are used, these can be made
representative of an actual heat-exchanger tube by using electrically
isolated spool pieces as sensing electrodes.
In order to simulate actual operating conditions, the corrosion sen-
sors in the model heat exchanger need to be subjected to heat flux and
scale formation. The use of unheated sensor surfaces would not reflect
the operational scaling characteristics accurately, and hence the cor-
rosion damage on the sensors would not be representative of that on
the operating unit. Heating elements, temperature sensors, and heat-
transfer calculations can be used to mimic the heat flux of the actual
heat-exchanger tubes in the model heat exchanger. The use of multi-
ple corrosion monitoring techniques applied to multiple corrosion
sensing elements in a model heat exchanger can address the issue of
detecting various forms of corrosion damage.
A corrosion monitoring system based on the above principles has been
described.
32
It uses a single heat-exchanger tube in the bypass model
heat-exchanger loop, with multiple electrochemical corrosion sensing
techniques applied to segmented corrosion sensing elements. The prin-
ciple of this monitoring system is illustrated in Fig. 6.29. Flow controls
and varying degrees of heat flux conveniently facilitate the simulation
of varying operational conditions, an important capability for “what-if”
analysis. A more detailed schematic of this model heat exchanger is giv-
en in Fig. 6.30, showing five segmented corrosion sensing elements,
each with an individual heater block for heat flux simulations. With
these five sensing elements, it was possible to measure both localized
and general corrosion damage. The corrosion monitoring techniques uti-
lized in this particular device were electrochemical noise (potential and
current), zero-resistance ammetry, and linear polarization resistance.
Monitoring preferential weld corrosion with ZRA. Any weldment is a complex
metallurgical structure. The weld metal is essentially a miniature
casting, with a composition and microstructure that may differ sub-
Corrosion Maintenance through Inspection and Monitoring 445
0765162_Ch06_Roberge 9/1/99 5:01 Page 445
stantially from those of the parent plate. On a microstructural scale,
the weld metal itself is not homogeneous. Typically the weld center-
line has a higher impurity content, and the microstructure changes
at different stages in the weld solidification cycle. The microstruc-
ture of the heat-affected zone (HAZ) also tends to vary from that of
the parent plate, as it is subjected to the weld thermal cycles, which
change with distance from the fusion line. Consequently, the
microstructure of the HAZ is also not uniform (refer to intergranular
corrosion in Sec. 5.2.1). It should thus be apparent that the different
zones of a weldment can be susceptible to galvanic corrosion as a
result of their compositional and microstructural differences.
Differential weld corrosion has been found to be particularly prob-
lematic in oil and gas flow lines. Even minor differences in composition
and microstructure have been found to result in severe preferential
galvanic dissolution of pipeline weldments. The selection of welding
consumables and welding procedures to minimize this risk is critical.
However, even with these precautions, operating conditions can induce
severe preferential weld corrosion. On-line corrosion monitoring pro-
grams have been conducted in oil and gas pipelines to identify these
operating conditions and to optimize the application of corrosion
inhibitors to control the problem.
The ZRA technique lends itself ideally to these monitoring purposes,
as outlined by Walsh.
33
Suitable corrosion sensors can be manufactured
446 Chapter Six
Data Output
Corrosion
Fouling
Model Condenser
Side
Stream
IN
Side
Stream
OUT
Flow
Controller
LPR General Rate
E. Noise Signals
ZRA Signals
Heat Transfer
Temperatures
Flow Rate
Corrosion/Fouling
Monitoring/Control
Hardware
Figure 6.29 Heat-exchanger monitoring systems using the bypass approach (schematic).
(Adapted from Winters et al.
32
)
0765162_Ch06_Roberge 9/1/99 5:01 Page 446
from representative pipeline weldments, as shown schematically in Fig.
6.31. It should be noted that the internal weld surfaces are used as the
exposed sensor elements for monitoring purposes. Essentially, selected
strips from the different weld zones are sectioned from the weld and
incorporated in a “standard” probe body designed for high-temperature
and high-pressure service. A larger number of sensor elements than are
depicted in Fig. 6.31 can be incorporated into a single sensor, to investi-
gate different weld compositions and structures. The so-called 2-inch
access fittings widely used in the oil and gas industry can be used to
mount the sensor surfaces flush with the internal pipeline wall.
ZRA readings can be accomplished with relatively simple instru-
mentation, and with a sufficiently high sampling frequency, a real-
time weld corrosion profile can be obtained for correlation with the
operating parameters and process control. Provided that all the sensor
elements are connected to the monitoring instrumentation in a consis-
tent manner, the sign and magnitude of the ZRA responses monitored
between the elements indicate the severity of galvanic attack and
which part(s) of the weldment are dissolving preferentially.
Examples of contrasting highly undesirable and favorable ZRA mon-
itoring profiles are presented schematically in Fig. 6.32. In case A, the
ZRA sensor response indicates that the HAZ is subject to intense pref-
erential anodic dissolution. Both the weld metal and the parent plate
are more noble (cathodic) than the HAZ. The narrow HAZ surrounded
by the weld metal and the large parent plate produces an extremely
unfavorable galvanic area effect. These conditions lead to weld failure
by extremely rapid preferential penetration of the weldment along the
HAZ. Actual HAZ corrosion rates could well exceed the values mea-
sured with the sensor, as the most severe area effect cannot be repro-
Corrosion Maintenance through Inspection and Monitoring 447
Condenser Tube
Heating Elements
Water
in
Water
out
Temperature
Sensors
Corrosion Sensors
(under heat flux)
Heat Transfer
Compound
Figure 6.30 Corrosion sensing elements in model heat exchanger for multitechnique
electrochemical monitoring (schematic). (Adapted from Winters et al.
32
)
0765162_Ch06_Roberge 9/1/99 5:01 Page 447
duced in the probe. Case B shows a desirable ZRA profile. Essentially,
all three weld zones are galvanically compatible, with very low gal-
vanic current levels. The weld metal is only marginally more noble
than the HAZ and the parent plate. In practice, addition of inhibitors
can be used to achieve this type of situation.
6.5 Smart Sensing of Corrosion with
Fiber Optics
6.5.1 Introduction
The techniques described so far have all progressed to industrial appli-
cations. A number of less well-known techniques are currently emerg-
ing from research and development efforts. There can be little doubt
that several of these will find increasing commercial application. Some
448 Chapter Six
Welded pipe
Parent material
Heat-affected zone
Weld metal
Corrosion Sensor
Sectioning for corrosion sensor
from inner pipe wall face
ZRA measurements
between the sensor
elements
Figure 6.31 Manufacture of preferential weld corrosion sensor (schematic).
0765162_Ch06_Roberge 9/1/99 5:01 Page 448
promising emerging techniques based on fiber optics are described
here. The development of fiber optic technologies for communication
applications has sparked interest in creating new sensors by modifying
a section of the fiber itself. The range of physical and chemical param-
eters that can be detected so far is remarkable. Physical and mechani-
cal parameters that can be measured include temperature, strain, pres-
sure, displacement, vibration, magnetic fields, and electric fields.
Chemical parameters that can be measured include pH; some organ-
ic compounds; moisture; chloride ions; dissolved gases such as oxygen
and carbon monoxide; gases such as oxygen, steam, and ammonia; and
compounds that fluoresce as a result of specific interactions, such as
enzyme-substrate and antibody-antigen complexes. Some of these
parameters have been recognized in the last few years as being poten-
tially useful for monitoring either the effects of corrosion on a struc-
ture or some of the factors that induce corrosion. Emerging
applications for monitoring the corrosion of structures include
■
Detection of moisture and increasing pH in aircraft lap joints
■
Measurement of the shift in the light spectrum reflected off rebar as
a result of corrosion
Corrosion Maintenance through Inspection and Monitoring 449
Sensor ZRA Profile Corrosion Profile Comments
Current
Current
Time
Time
HAZ-Weld metal
HAZ-Weld metal
HAZ-parent plate
HAZ-parent plate
Weld metal-parent plate
Weld metal-parent plate
+
-
+
-
A
B
Corrosive
medium
Corrosive
medium
The HAZ is anodic
to the weld metal
and the parent plate.
The weld metal is
cathodic to the
parent plate.
Highly undesirable
preferential corrosion
occurs in the HAZ.
The weld metal is
slightly cathodic
to the parent plate.
All three weld zones
are galvanically
compatible.
There is no problem
of preferential weld
corrosion.
Figure 6.32 Undesirable and favorable weld corrosion profiles from ZRA monitoring
(schematic).
0765162_Ch06_Roberge 9/1/99 5:01 Page 449
■
Detection of chloride ions near rebar
■
Detection of rebar strain in a bridge due to corrosion
Generic advantages of fiber optic sensing systems include their pas-
sive nature, immunity to electromagnetic interference, light weight,
small size (an analogy to a human hair may be cited), large bandwidth,
mechanical ruggedness, high sensitivity, and ease of multiplexing. A
fiber optic sensing system consists of a light source, a detector, a sens-
ing element, and the optical fiber for transmitting the light from the
source to the detector. An important concept is the use of the fiber optic
sensor itself as a corrosion sensing element, the so-called intrinsic sen-
sor. Corrosion sensing elements in fiber optic sensing systems have
been based on the following principles:
■
A change in the reflectivity of light from highly polished surfaces,
induced by formation of corrosion products
■
The detection of chemical species and pH changes associated with
corrosion processes
■
Changes in strain as the thickness of the corroding material is
reduced
Another important corrosion monitoring concept in which fiber
optics can play an important role is that of smart coatings. The basic
idea is for a coating to reveal where it has been damaged and corrosion
attack has been initiated. This form of corrosion sensing has the major
advantage that it can be applied over extensive surface areas; the
sensing is not restricted to a local measuring point. Fundamental prin-
ciples that have been proposed for smart coatings include
■
The incorporation into coatings of chemicals that induce a color
change when corrosion or coating damage occurs
34
■
A fluorescent response to corrosion damage or coating discontinuities
35
There is a trend toward utilizing the versatility of fiber optic sensors
to monitor atmospheric corrosivity and the effects of corrosion on a
structure. Emerging techniques for monitoring air corrosivity include
■
An optically thin metal that reflects less light as it corrodes
■
A thin metal wire that can be configured to function as a corrosion
fuse
■
A metal coating that undergoes strain relaxation as it corrodes
■
Gas sensors that measure the concentration of species that promote
corrosion
450 Chapter Six
0765162_Ch06_Roberge 9/1/99 5:01 Page 450
6.5.2 Optical fiber basics
Optical fibers typically consist of four layers, as shown in Fig. 6.33: (1) an
inner core, (2) cladding, (3) a protective buffer, and (4) a jacket. Light is
launched into the end of an optical fiber by a light source and is guided
down the inner core. Most inner cores are made of silica glass, but some
are made of sapphire, fluoride glasses, or neodymium-doped silica. Glass
fibers have very low light-loss characteristics and therefore are capable
of transmitting a light signal hundreds of miles. The cladding is usually
made of a silica glass that has an index of refraction lower than that of
the core, so that light is refracted back into the inner core. Protective
buffers are usually made of plastic. The function of the plastic buffer lay-
er and jacket is to provide mechanical protection and thus allow optical
fibers to be flexible and robust, and also to provide a moisture seal. A typ-
ical diameter for a jacket is 125 m, and that for an inner core is 10 m.
An environmental parameter can be measured by its influence on
one or more of the following characteristics of light through a sensor:
(1) intensity, (2) phase, (3) wavelength, or (4) polarization. Changes in
the refractive index of the cladding by an environmental parameter
can affect both the intensity and the phase of the light. Any fluores-
cence in the cladding caused by a specific chemical interaction with the
environment causes wavelength changes in the light that is refracted
back into the inner core. In a common sensor design, an environmen-
tal parameter affects the intensity and phase of the light that is
reflected back from the sensor toward the light source.
The signal from a fiber optic sensor is analog, not digital as in fiber
optic communications, and therefore needs a reference signal. A typical
Corrosion Maintenance through Inspection and Monitoring 451
Jacket
Buffer layer
Core
Cladding
Figure 6.33 Schematic of the basic components of an optical fiber.
0765162_Ch06_Roberge 9/1/99 5:02 Page 451
method of providing a reference for sensors that modify intensity is to
use two wavelengths of light, with the sensing element having a larger
effect on the light at one wavelength than at the other. Unwanted envi-
ronmental effects can be eliminated by taking a ratio of the intensity of
the two wavelengths from the sensor.
System requirements for a fiber optic sensor involve light source
and signal detection components as well as the optical fiber.
Distributed sensors provide continuous spatial resolution of the para-
meter along the length of the fiber. A quasi-distributed sensor is an
optical fiber with a series of sensors at discrete locations along its
length, therefore providing discrete spatial resolution. The small
diameter of optical fibers limits the amount of light power that can be
launched into and detected leaving the fiber. This usually means that
fiber optic sensors have relatively low signal-to-noise ratios, which
limits the methods of light detection and multiplexing that are feasi-
ble in a cost-effective manner.
6.5.3 Emerging corrosion monitoring
applications
Atmospheric corrosivity monitoring
Micro-mirror. A method of measuring the corrosivity of an atmosphere
that was developed at Sandia National Laboratories involves measur-
ing the reflectivity of an optically thin metal mirror. A thin layer of
metal (i.e., from 10 to 30 nm) is applied to the end of a fiber by ther-
mal or vacuum evaporation to form a micro-mirror. A schematic of a
micro-mirror system is shown in Fig. 6.34. Light passes through the
optical fiber to the metal at the end of the fiber and is partially reflect-
ed. The main signal output is either the ratio of the intensity of the
reflected light to that of the incident light or the ratio of the reflectiv-
ity to the initial reflectivity with a clean micro-mirror. Species from the
atmosphere that chemisorb and/or react with the metal reduce the
reflectivity.
Butler and Ricco reported that the reflectivity of silver micro-mirrors
decreased as species such as H
2
S, CO, O
2
, SO
2
, and H
2
chemisorbed
onto the external surface of the metal.
36
The change in reflectivity
caused by chemisorption ranged from 0.7 to 0.1 percent. However, the
change in reflectivity caused by the reaction of H
2
S and Ag to form Ag
2
S
and H
2
was an order of magnitude larger. These results indicate that
corrosive influences that change the composition of a metal can be mea-
sured in this manner.
Ammonium sulfate particles have been implicated in the corrosion
of microelectronics in humid air. Smyrl and Butler placed a copper
micro-mirror on the end of a fiber into an aerated solution of ammo-
452 Chapter Six
0765162_Ch06_Roberge 9/1/99 5:02 Page 452
nium sulfate.
37
The thickness of the copper was related to the reflec-
tivity, and therefore the reaction and dissolution of the copper film
were measured by the degree of reflection. Corrosion occurred only in
the presence of dissolved oxygen. The copper micro-mirror, which
was initially 30.5 nm, was dissolved by the aerated ammonium sul-
fate solution in less than 1 h.
Hydrogen is often a by-product of corrosion. A sensor was formed
with a micro-mirror of palladium that was responsive to hydrogen con-
centration in air up to approximately 5 percent. The interaction of
hydrogen and palladium reversibly forms a hydride, PdH
x
, which has
a lower reflectivity than pure palladium. Smyrl and Butler illustrated
that this sensor is responsive to hydrogen that is dissolved in water.
37
Thus, monitoring dissolved hydrogen in small areas such as crevices is
a potential application for fiber optic micro-mirrors.
Corrosion fuse. Bennett and McLaughlin described a method for moni-
toring the corrosion of a metal called a “corrosion fuse.”
38
A schematic
of a prototype is shown in Fig. 6.35. Attenuation of light through an
optical fiber becomes significant when the fiber is bent into a loop
smaller than about 3 mm. A thin metal rod maintains the fiber in a
microbend with slight tension from a spring. When the metal rod cor-
rodes to the point that it breaks, the fiber straightens because of the
Corrosion Maintenance through Inspection and Monitoring 453
Coupler
Source light
Reflected
light
Transmitted
light
Cladding
Core
Metal
film
Light
source
Photo-
detector
Figure 6.34 Schematic of a light reflection system with a micro-mirror at the end of the
optical sensor.
0765162_Ch06_Roberge 9/1/99 5:02 Page 453
spring, and the intensity of the light downstream of the fuse increases.
Obviously the composition and thickness of the metal fuse may be read-
ily designed. Decreasing the thickness of the metal fuse increases the
sensitivity to corrosion. Bennett and McLaughlin demonstrated that
three fuses in series could be monitored, in a quasi-distributed fashion,
on the same fiber. The corrosivity of an atmosphere is expected to be
inversely related to the time required for a given fuse to break.
The design was tested by placing three units on a single fiber above
a salt solution within an enclosed chamber. When very little corrosion
was observed after 30 days at 30°C, the bath temperature was raised
to 44°C. The sensors broke after another 34, 41, and 44 days, and
these events were readily monitored by the light signal.
Strain relaxation. A fiber optic technique for measuring corrosivity by the
degree of strain relaxation of a plastically deformed metal coating has
been developed. The degree of residual strain in the sensor jacket
depends on (1) the coating material, (2) the coating thickness, and
454 Chapter Six
Retaining frame
Corrosion fuse
Spring
Pin
Spring
Fiber
Figure 6.35 Schematic of a corrosion-fuse arrangement.
0765162_Ch06_Roberge 9/1/99 5:02 Page 454