Gear Noise and Vibration Episode 2 Part 2 pptx
Bạn đang xem bản rút gọn của tài liệu. Xem và tải ngay bản đầy đủ của tài liệu tại đây (906.57 KB, 20 trang )
160
Chapter
9
The
selected lines
are
removed
by
putting their amplitude
to
zero.
The
resulting remaining
frequency
components
are
subjected
to the
inverse
Fourier routine
(iffl)
which
resynthesises
the
original time sequence signal
with
all the
"normal"
vibration removed.
The
residual signal
will
show
up
minor
faults
much more
effectively
than
the
original signal.
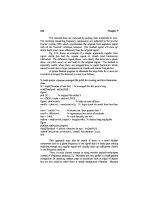
Fig.
9.16
shows
an
example
of a
simple, apparently regular, time
signal
which
has had the
regular signal
of
1/tooth
(and harmonics)
subtracted.
The
difference
signal shows very clearly that there
was a
phase
delay
(or
pitch error)
on one
tooth
in the
original signal.
The
method
is
especially
useful
when there
are
irregularities
in
small harmonics which
cannot
be
seen
due to
large components
at
1/tooth
and
similar
frequencies.
A
typical Matlab program
to
eliminate
the
large lines
for a
once
per
revolution
averaged
file
obtained
in a
test
is as
follows:
%
loads pinion vibration averaged
file
pvbN
for
viewing
and
line elimination
clear
N =
input('Number
of
test
file'); %
averaged
file 405
points long
eval(['load
pvb'
int2str(N)]);
figure;
plot
(Y);
%
original
file
called
Y
w
-
fft(Y);
wabs
=
abs(w(
1:202))
;
figure;
plot(wabs);
%
looks
at
sizes
of
lines
smalls
=
(abs(w)
<
ones(size(w)));
%
logic check
for
small lines less than
1
resw
=
smalls.*w;
%
knocks
out
lines
greater
than
1
resvib
=
ifft(resw);
%
regenerates
time
series
of
residuals
hor
=
1:405;
% x
axis
for
plot,
one
rev.
realres
=
real(resvib);
imgres
=
imag(resvib);
%
checks
imag
negligible
figure
plot(hor,realres,hor,imgres)
title(['Residual
<1
pinion vibration
for
test
'
int2str(N)
])
xlabel('One
pinion
revolution');
ylabel('
Acceleration
in
g');
end
This
approach
may
also
be
useful
if
there
is a
small hidden
component such
as a
ghost
frequency in the
signal
due to a
faulty
gear cutting
machine, though
any
regular signal will usually show
up
sufficiently
clearly
in
the frequency
analysis.
There
is
much current interest
in
using
wavelet analysis techniques
instead
of frequency
analysis
[1].
Wavelets
are
very
useful
in
visual pattern
recognition
for
detecting sudden steps
or
transitions such
as
edges
of
objects
but
are
less selective when there
is
steady background vibration. Because
Analysis Techniques
161
gear
errors tend
to
have regular components
and
faults
show
up as
variations
from a
regular pattern,
the
line elimination approach tends
to
perform
better.
The
advantage
of
wavelets
is
their variable time scale
but the
same
effect
can
be
obtained with
frequency
analysis
if
corresponding short windows
are
employed
at the
higher
frequencies.
Some
of the
more sophisticated wavelet
shapes look extremely similar
to
short window Fourier transforms
and so
give
the
same results.
9.8
Modulation
A
vibration signal
may
have amplitude
or frequency
modulation,
usually
at
once
per
revolution,
and
this tends
to
worry operators.
The
most
likely
reasons
for
modulation are:
(a)
Variable load torques, especially
if the
teeth come
out of
contact
for
part
of the
revolution. Alternatively,
shaft
deflection
may
vary
with
load
with
an
overhung gear
and
modulate
the
signal
as the
helix
alignment
varies. There
may
also
be a
small
effect
due to
tooth elastic
deflections
altering
the
T.E.
(b)
Eccentricities. These
may
act, usually
at
I/rev
to
vary
the
torque,
and
modulate
the
vibration
as in
(a).
(c)
Movement
of the
source. This occurs
in an
epicyclic
gear where
the
planets
travel past
a
sensing
accelerometer
mounted
on the
(fixed)
annulus.
The
effect
of the
different
vibration phase
on
each planet
mesh
is to
produce
an
apparent higher
or
lower
frequency
than
the
actual tooth meshing
frequency.
This
frequency
looks like
a
sideband
of
tooth
frequency and the
tooth
frequency
itself
is
often
not
present
[5].
(d) A
gear mounted with swash
may
give
a
signal modulated
at
I/rev
or at
2/rev
as the
alignment
of the
helices varies.
The
modulation
is
usually amplitude modulation which
is
easily seen
on
the
original time trace
as
sketched
in
Fig.
9.17,
but
appears
as
sidebands
in
the frequency
analysis
in
Fig. 9.18.
Not
only
the
basic
once-per-tooth
frequency
but
all the
harmonics
are
modulated.
In
extreme
cases
the
1/tooth
frequency can
disappear completely leaving only
the two
sidebands
or
occasionally
just
the
single sideband
as
with
an
epicyclic drive.
Frequency
modulation involves variation
of the
periodic time
of the
waveform
and
cannot
be
easily seen
in the raw
signal
as the
amplitude
remains constant
(as in
Fig.
9.16),
but it is
easily detected
by
line elimination.
However,
the frequency
analysis looks almost
the
same
as the
result
for
amplitude
modulation (shown
in
Fig.
9.18).
162
Chapter
9
envelope
time
Fig
9.17 Time signal with amplitude modulation.
If
it is at low frequency, the
modulation
may be
audible
and
irritate
the
customer. Prevention
of the
torque variation
is
sometimes
not
possible,
but
if the
amplitude
of the
"carrier"
(i.e.,
the
I/tooth)
is
reduced,
the
fact
that
there
is
modulation
will
matter less. Eventually
if the
"carrier" i.e.
the
tooth
frequency
component
is
reduced
to
zero
then there
is no
sound
to
irritate
the
customer.
fundamental
modulation
sidebands
jl
harmonics
frequency
Fig
9.18 Frequency analysis
of
modulated signal.
Analysis Techniques
163
Detection
of
modulation
can be
assisted
by
using
the
"cepstrum"
which
is the frequency
analysis
of the frequency
analysis,
see
Randall [2],
but
for
most gear work
the
effect
is
clearly visible
and the
modulating
frequency
is
easily identifiable
as a
I/rev
frequency.
9.9
Pitch effects
The
assumption
so far has
been that noise
and
vibration problems
are
dominated
by
1/tooth
and
harmonics
but
this
may not be so for
high speed
drives.
If we
have
a
turbine
or
compressor pinion running
at
12,000
rpm
with
30
teeth
the
1/tooth
frequency is 6
kHz.
In
general
frequencies
this high
are
less likely
to find
responsive resonances
and
give noise problems
but the
set
may
give
noise
at
much lower
frequencies
below
2
kHz.
Noise
in
this
frequency
range
is at say five
times
per
pinion
rev or
twenty
times
per
wheel
rev and so is
rather puzzling.
It can be due to
phantom
or
ghost tones
from the
gear manufacturing machine
but
such tones
are
easily identified
as
they correspond
to the
number
of
teeth
on the
table
wormwheel.
If not the
trouble
may be due to
random pitch errors
on the
pinion
or
wheel.
Adjacent
pitch errors
are
typically
of
small amplitude
and
should
be
rarely
larger than
4
urn
and as
they
are
random
we
would expect negligible
excitation
at any
single
frequency. The
test
results
may be as in
Fig.
9.19
and
do
not
appear
to be
capable
of
giving significant trouble.
Although
the
pitch errors
are
random
in
distribution there
are
only
a
finite
number
of
teeth round
any
gear
and the
sequence then repeats. This
gives
components
of
excitation
at all
possible multiples
of
I/rev
except
curiously
at
1/tooth
and
harmonics
of
1/tooth
(see
Welbourn
[6]).
This means that
at any
multiple
of
I/rev
(excluding tooth
frequency
and
harmonics) there
may be a
significant component
of
that harmonic
available
to
excite structural resonances which
are
likely
to
exist
at
relatively
low frequencies.
adjacent
pitch
error
1
revolution
Fig
9.19 Typical adjacent pitch errors around
a
gear.
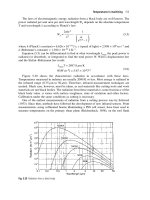
164
Chapter
9
The
theory gives
the
result that
if
very large numbers
of
gears
are
tested
the
average measured amplitude
of any
given harmonic
of
order
z
will
be
proportional
to
mnl
z
where
<j
is the
rms
value
of the
adjacent pitch
errors.
The
theory thus predicts that
the
distribution
of
harmonics
will
be as
shown
in
Fig. 9.20
but
also predicts that
the
variations
of
amplitude
in the
frequency
analysis
will
be as
large
as the
amplitudes expected
on
average (the
full
line).
The
circles indicate typical measured results which have
a
large
scatter.
The
harmonic amplitudes expected
are
surprisingly large.
Taking
the
original adjacent pitch
error
as 2
jim
rms the
expected
value
of a low
harmonic
will
be as
high
as
2V(2/32)
which
is 0.5
urn
rms or
1.4
um
p-p.
2.5
V-1.5
10
20 30 40 50
harmonics
of
1/rev
60 70
Fig
9.20 Frequency analysis
of 32
tooth pinion pitch
errors.
The
full
line
is
the
theoretical prediction
and the
circles
are
typical experimental values.
Analysis Techniques
165
On
a 5th
harmonic this would have dropped
to
1.35
mm p-p but any
particular gear could easily have over double this value
and 3 um p-p
would
be
likely
to
give audible trouble.
The
other
effect
that pitch error harmonics
can
have
is to
give
the
illusion
of a
false
phantom note
at
about
1.5
times tooth
frequency.
Looking
at
harmonic
45
gives
a
predicted amplitude
of
0.21
of 0.5 um
rms
and so
about
0.3 um p-p
with
the
possibility
of
double this value, comparable with
a
phantom
on a
well made large
gear.
9.10 Phantoms
The
existence
of
phantoms
was
mentioned
in
section 9.9. They
appear
in a frequency
analysis
of
noise
or
T.E.
as a
"wrong"
frequency. It is
rather
a
temptation
to
ignore them because
it
seems that
if
there
are 106
teeth
on
a
gear there should
not be a
vibration
at 145
times
per
rev. Their
existence
is
liable
to be
blamed
on
some unknown electrical interference
or
sampling
frequency
fault.
They
may
however
be
genuine.
They
are
normally caused
by the
machine
on
which
the
gear
was
manufactured,
whether
a
hobber
or
grinding machine. Even though
a final
process such
as
honing, shaving
or
grinding
may not in
itself cause phantoms
these
processes
tend
to
follow
the
previous pitching
so
that
any
problems
left
on
the
gear
at the
roughing stage
may not be
eliminated
in finishing.
They
are
usually
caused
by the
1/tooth
error
from the
worm
and
wheel which
is the final
drive
to the
table carrying
the
gear
and the frequency
may
range
from
90/rev typically
on a
small machine
to
between
300 and
400/rev
on a
large machine. Amplitudes
are
small,
of the
order
of 1 to 2 um
but
this
is
more than sufficient
to be
audible
and is
sometimes larger than
the
1/tooth
component.
Such
phantoms
or
ghost tones
in a
gear
are
clear
and
consistent
in
the
noise,
vibration
and in the
T.E. They
are not
easily detected
by
conventional
profile
or
pitch checking
but it is
sometimes possible
to see
them
on
a
wide
facewidth
gear
in the
helix check
as
they appear
as a
wave
on the
helix.
If
the
existence
of a
phantom throws suspicion
on the
accuracy
of a
gear manufacturing machine
it is
relatively straightforward
to
test
the
machine table accuracy directly.
One
encoder mounted
on the
table
and one
on
the
worm drive
shaft
give
the
T.E. directly
and it is
then sometimes
possible
to
adjust
the
worm alignment
to
minimise
the
1/tooth
error,
assuming
the
worm
has
been mounted
in
double
eccentric
adjustable
bearings
to
allow adjustment
of
clearance
and
alignment.
Another hazard that
can be
encountered
is a
torsional vibration
linked
to the
revolution
of a
pinion appearing
to be
1/tooth
or a
modulated
166
Chapter
9
1/tooth
but
caused
by a
driving stepper motor. Stepper motors
are
popular
drives
for
positioning
due to the
simplification
of the
control
aspects
but
have
the
disadvantage that they cannot accelerate high inertias.
The
designs must
ensure that
the
moment
of
inertia seen
by the
motor
is
small
and
there
is
then
a
possibility that
the
steps
of the
motor
will
insert torsional vibration which,
in
extreme
cases,
can
reverse motor direction each step allowing gears
to
come
out of
contact.
References
1.
Newland, D.E.N.,
'Random
vibrations, spectral
and
wavelet
analysis.'
Longman, Harlow,
UK and
Wiley,
New
York, 1993.
2.
Randall, R.B.,
'Frequency
analysis.'
Bruel
&
Kjaer,
Naerum,
Denmark, 1987.
3.
Schuchman,
L.,
'Dither
signals
and
their
effect
on
quantization
noise'.
IEEE Transactions
on
Communications, Vol.
COM-12,
Dec.l964,pp
162-165.
4. The
Math
Works
Inc., Matlab, Cambridge Control,
Jeffrys
Building,
Cowley
Road, Cambridge
CB4 4WS or 24
Prime Park Way, Natick,
Massachusetts 01760.
5.
McFadden, P.D.
and
Smith, J.D.,
'An
Explanation
for the
Asymmetry
of the
Modulation Sidebands about Tooth Meshing
Frequency
in
Epicyclic Gear
Vibration.'
Proc.
Inst.
Mech.
Eng.,
1985, Vol.
199,
No.
Cl,
pp
65-70.
6
Welbourn,
D.B.,
'Forcing
Frequencies
due to
Gears.'
Conf.
on
Vibration
in
Rotating Systems,
I.
Mech.
E.,
Feb. 1972,
p 25.
10
Improvements
10.1 Economics
Returning
to the
basic ideas
of
noise generation
we
have:
Gear
Errors,
Deflections,
Distortions,
etc.
giving
Transmission
Error
which
acts
on
internal dynamics
giving
Gear Body Vibration
and
hence
Bearing Housing Forces
which
excite
the
gearcase
or
transmit through
feet
giving
Panel Vibrations
and
hence
Noise.
We
can (in
theory
at
least) improve
any
part
of
this chain
and the
end
result,
in a
linear system,
will
be
less noise. Hence,
we
have
the
choice
of
tackling (and improving)
the
transmission
error,
the
internal dynamic
response,
the
external structure dynamic response,
or the
sound
after
it is out
of the
metal.
Once
the
initial investigations have been carried
out the
choice must
be
made
as to
where improvements should
be
tried.
In
general,
the
choice
must
(or
should)
be
dictated
by
economics, economics
or
economics.
167
168
Chapter
10
(a)
centre vibrates less than
end
supports
panel
or
cover
main
structure
mode
shape
of
panel
zero
line
cover
is
rigid
(b)
panel
cover
vibrates more than supports
mode
shape
zero
line
mode
shape
zero
line
(c)
panel
Fig
10.1 Vibrating
shapes
of
panels.
This
usually
rules
out
tackling
the
sound
after
it has
left
metal.
Absorbing sound without
an
airtight
enclosure
is
difficult
and
preventing
air
circulation
does
not
help cooling.
Improvements
169
There
are a few
occasions when
the
choice
is
made
on
time scale
or
for
purely political reasons
but for the
majority
of
problems, economics
should dominate.
Unfortunately
this means having
a
rather good understanding
of
what
the
problem
is and
what
the financial
implications
are of a
given
set of
changes.
In the
middle
of a
high adrenaline situation with installation design
blaming
"lousy
gears"
and the
gear production blaming
a
"hopeless
installation," this
is not
always easy
and
sometimes impossible.
The
dominating requirement
is to
determine
the
T.E. since
this
will
give
an
immediate clue
as to
whether
the
problem
can be
attributed
to
poor
gears
or an
over-sensitive installation. Without knowledge
of the
source
of
the
trouble much money
can be
wasted
on
attempting
to
improve
a
gear pair
or
an
installation that
is
already extremely good.
In
the
limit
the
problem
may be so
intractable that every aspect must
be
improved. Fortunately this
is
rare
and
only occurs when several
developers have already
had a go at
improving
the
installation
stiffnesses,
resonances,
and
gear design details
and
have eliminated
all the
easy
possibilities.
As
often
in
engineering there
is a law of
diminishing returns
and it is
only possible
to get
dramatic
10
dB or 15 dB
reductions
in the
initial
stages.
10.2 Improving
the
structure
Improving
the
structure
is
usually
the
simplest
and
most obvious
of
the
approaches.
It is
generally
not the
most economic approach
for a
1-off
production problem
but is by far the
most economic
for
anything that
is
being
produced
in
large quantities.
Any
improvement
is
gained with some initial
redesign cost
but
little subsequent cost
per
item.
The first
move
is to run
round
the
gearcase
(or
machinery
in
which
the
gearbox
is
installed) with
an
accelerometer
feeding
into
an
analyser
set to
the
troublesome
frequency. The
hope
is to find
some large,
flat
panel which
is
behaving
as a
very good loudspeaker.
The
relevant criterion
is
roughly
velocity
squared times area
of
panel
for
sound emission
[1].
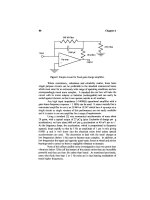
Fig.
10.1
shows sketches
of
possible mode shapes
for a
cover
or
panel.
If
vibration amplitudes measured
in the
centre
are
greater than
the
edge
support amplitudes
[10.1(c)]
the
panel
is
acting
as a
loudspeaker
(at the
relevant
frequency). If
panel centre vibration amplitudes
are
less than edge
support amplitudes
[10.1
(a)]
the
cover
is
giving less sound than would
a
perfectly
rigid cover
[10.1(b)J
so it
should
be
left
strictly alone.
It is
sometimes
possible
to
isolate
a
panel completely
from its
support
but
this
is
not
common.
170
Chapter
10
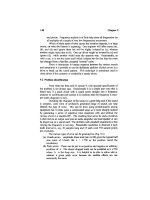
mode shape
1
mode shape
Fig
10.2
Effect
of
centre
rib on
mode shape
for a
vibrating panel.
Individual
"amplifying" covers
or
panels
can
have their sound
transmission greatly reduced either
by
thickening
the
panel
or by
adding
a
stiffening
rib in the
centre. Fig. 10.2 illustrates
the
difference
in
mode shape
between
a
panel with
an
effective
centre
rib and one
without.
Technically,
the
centre
rib
restricts movement
so
that
the 2
half
panels
can
only vibrate
in
anti phase
(as a
dipole)
and
their emitted sound
waves
(180
degrees
out of
phase) tend
to
cancel, once they
are
well away
from
the
panel.
The rib has to be
quite deep
to be
effective
on a flat
cover and,
within
a
casting
or
weldment,
it
helps
if an
internal
rib is
also taken across
the
corner onto
a
neighbouring panel.
The
resonant
frequencies of the
panel
are
greatly increased.
Gearcases which
are
cast tend
to be
much quieter than
the
corresponding
weldments.
This
is
not,
as
customarily assumed,
because
cast
iron
has
greater damping than
steel
because
both have very small damping
in
absolute terms.
The
main reasons
for the
difference
are
that curved cast
surfaces
are
much more rigid than
flat
surfaces and, because iron
casters
are
paid
by
weight, castings
are
usually much thicker than
the
corresponding
weldments.
As
plate bending
stiffness
is
proportional
to
thickness cubed, this
provides
a
major
increase
in
rigidity despite
the
lower modulus
of
elasticity.
There
is
also
likely
to be an
increase
in
corner
stiffnesses
and an
effective
Improvements
171
reduction
in
span
due to the
radii associated with casting.
It is of
interest that
the
structural rigidity
of a
weldment
in
torsion
is
little
affected
by the
depth
of
welding
at the
corners.
In a
normal
gearcase,
stresses
are
negligible because
high
stresses
would give ridiculous movements
so it is not
necessary
to
have
high strength
at the
welds. This means that within
a
given cost,
it is
often
much
better,
from the
structural
and
noise
aspects,
to
have thick panels with
only
(unchamfered)
fillet
welds rather than thinner panels
with
(expensive)
full
depth welds.
If
all the
individual panels have already been
stiffened
and
split into
dipoles then little
can be
done without
a
major
increase
in
weight. Increasing
wall
thicknesses gives
major
stiffness
increases
(but with weight penalties)
but
use of
aluminium
or
magnesium alloy panels allows large increases
in
thickness
and
hence plate bending
stiffness
without weight penalties (but
at a
cost).
Cars
and
office
machinery have
a
problem because there
are
large
thin
flat
panels.
On a car it is not
possible
to
increase panel thickness
due to
weight
penalties
and
although improvements
can be
made
by
adding highly
viscous bitumen-based damping pads
on the
panels there
is,
again,
a
weight
penalty.
Modern body designs tend
to
have more curved panels,
not
because
of
styling considerations
but as an aid to
increased
stiffness.
The
ideal
structural shape
is a
sphere.
Office
machinery traditionally
has
flat
panels
so
great
care
has to go
into isolating
the
drives
from the
panels. Plastic
may be
used
to
increase
wall
thicknesses and, hence, rigidity
and
damping, despite
the low
modulus
of
plastics.
At
the
design stage there
will
not be a
structure available
to
test
but
occasionally there
is a
smaller
but
similar gearbox available. Once
the
smaller gearbox
has
been tested
the
natural
frequencies of the
larger design
can be
estimated.
The
relevant non-dimensional parameter
for
natural
frequency
is
o
2
L
2
p/E
so
since
the
material
is the
same,
the
product
of
natural
frequency and
size should remain constant. Typically
a 25%
increase
in all
dimensions should give
a 20%
reduction
in
natural
frequencies
provided
geometric similarity
is
maintained.
The
existing gearbox
can
then
be
tested
at
125%
speed
to
give
an
idea
of the
vibration
responses
to be
expected.
10.3 Improving
the
isolation
Most
machinery
has the
gearbox isolated
from the
main structure
by
rubber mounts.
If
not,
the
design
is
asking
for
noise troubles. Unfortunately,
the
isolation mounts have very rarely been designed with
the
specific
intention
of
isolating
the
1/tooth
frequency
which
is
usually
the
main
excitation. Sometimes,
as in an
elevator drive,
it is
difficult
to
isolate
the
drive
from the
customer
(in the
lift
cage).
172
Chapter
10
response basic resonance
actual
response
I
'
\ A
dB
log frequency
Fig
10.3 Typical response
of
vibration isolator.
Many
installations have isolators which were designed
to
isolate
I/rev
(often
1450
rpm,
24.5
Hz) and
simple theory says that
the
isolation
should then
be
very good
at
24/rev
(i.e.,
tooth
frequency of 600
Hz). Fig.
10.3
shows
the
theoretical single degree
of freedom
response
and
what
may
realistically
happen
as the
internal resonances
of the
spring give
"spring
surge,"
the
bane
of
racing engine valve springs.
Satisfactory
isolation
of
tooth
frequency
needs
a
design tailored
to
tooth
frequency, so
either
the
isolator should
be
redesigned
for the
higher
frequency, or two
stage isolation
is
needed when both
I/rev
and
tooth
frequency are
involved.
The
I/rev
will
not
come through
as
noise because
frequencies are too low but
will
be
felt
as
vibration whereas
1/tooth
noise
frequencies
cannot usually
be
felt
as
vibrations.
As
with
all
3-dimensional
isolation
it is
important that lateral
or
vertical vibration
and
torsional
vibration
modes
are
decoupled
to
prevent interactions. This
is
most
important
in a car
where there
are
large torsional vibrations
of the
engine,
especially
at
idling.
If
these were allowed
to
interact
to
give vertical body
movement,
there
would
be
severe
passenger irritation.
Another
problem comes
from
large
"static"
loads.
We
need
relatively
soft
support springs
to
give good vibration isolation
but if
high
average loads
are
imposed,
the
springs must
be
stiff
to
prevent excessive
geardrive movement. This problem
occurs
in
cars
because with
a
transverse
mounted engine, gearbox,
and
differential
assembly,
the
system must
Improvements
173
withstand
reaction torques
of the
order
of
2000
Nm
(1500
Ib
ft) at
full
throttle
in
bottom gear
but it
must
be
quiet when cruising
on a
motorway when
the
torque
is
only
100 Nm (75
Ib
ft). The
most satisfactory solution
is to
have
a
highly
non-linear support which
is
soft
at low
torques
and
locks
up
when
the
torque
rises
(see section 6.5). Fortunately,
a
driver
is not
worried about high
noise levels
for a
couple
of
seconds
at
full
throttle
in
lower gears when
the
high
torque involved
"bottoms"
the
support
and
there
is
high vibration
transmission.
In
a
very sophisticated installation
the
"ultimate"
isolation
is to
indulge
in
vibration cancellation techniques
at the
(four)
gearbox support
feet
in
addition
to
using
soft
mounts. This
is
technically easier than cancelling
airborne sound
after
it has
escaped
from the
metal.
It
is,
however,
a
very
expensive, delicate
and
temperamental method which should
be
avoided
for
all
normal engineering.
tip
relief
profiles
root
ex
T.E.
root
wheel
pitch
line
metal
T.E. for
previous
pair
Fig
10.4
(a)
Flank
profile
shapes combining
to
give T.E.
174
Chapter
10
unloaded
T.E.
Fig
10.4
(b)
Effect
of
load
on T.E for a
spur pair.
10.4 Reducing
the
T.E.
Since
T.E.
is the
original source
of the
trouble, reducing T.E.
is an
obvious
way of
reducing noise.
The
traditional "fix"
with
industrial gears
(which
had not
been ground)
was to
grind
the
gears
and
this
was
sometimes
sufficient
for a
one-off problem.
This
"fix" inherently assumes that
the
design
is
correct
and
that
manufacture
is
inaccurate,
but
this
is
rarely true
in
older designs where
it is
highly likely that profiles were
not
correctly designed.
To
reduce T.E.,
we
must
first find out
what
is
causing
the
T.E.
It
is
important
to
remember that what matters
is the
T.E. under working load,
not
the
T.E. under zero load. Spur
gears,
without
the
complications
of
helical
averaging
effects,
are
relatively easy
to
diagnose.
The
problem
is
usually
one
of
bad
design where
a
standard amount
of tip
relief
has
been applied
to
give
an
almost parabolic
shape
to the
variation
in
profile
from the
pure involute. Fig.
10.4(a) shows
a
typical traditional
flank
profile
with
the
associated
no-load
T.E.
and
Fig. 10.4(b) shows
the
effect
of
load
on the
T.E.
The
effect
of
load
is
as
described
in
Chapter
2.
At
low
loads
the
T.E.
is
high and, although
it
reduces
under
torque,
it
never comes down
to
very
low
levels.
The
solution,
as
discussed
in
section 2.5,
is
to
specify
the
design relief
as
linear, starting
from the
correct
roll distance
down
the
tooth
flank from the
tip, depending
on
whether high
or low
load
is
more important.
For
spur
gears
the
accuracy
of
alignment
of the
helices
(at
angle zero)
is
relatively unimportant except when non-linear
effects
dominate.
Changing
from
spur
gears
to
helicals usually gives
a
reduction
in
T.E.,
by up to 10 dB, but
much depends
on the
accuracy
of
alignment
of the
helices when installed.
Reducing
the
T.E.
on
helical
gears
is a
much more
difficult
process
due to the
complex interaction between helix
and
profile
effects.
Much
Improvements
175
depends
on
whether
the
original design attempted
to
achieve
a
smooth entry
by
using
tip
relief
and
negligible
end
relief,
or end
relief with negligible
tip
relief.
A
particular case
of the
latter occurs with heavily crowned gears with
no tip
relief designed
for
light
loads.
Improving gears where there
are no
obvious
major
design errors will usually involve either
an
amount
of
extremely clear-
headed thinking
or the use of at
least
a
thin-slice model
as
described
in
section
4.5.
In
some cases
the
dominant
effect
can be the
variation
in
helix matching
occurring
due to
shaft
deflections under load.
It
tends
to be
assumed that
gears
are
noisy
because
they have been
badly
made
and
there
is the
inherent assumption that
the
gears will have been
well
designed, usually
the
exact opposite
of
reality. Gears
are
often
manufactured
to
within
3 um of the
design
profile
specification which itself
may
be
15
um in
error.
For any old
design
it is
well worth checking
the
levels
of
T.E. that would
be
predicted
from the
specified tooth
shapes.
In any
prediction
it is
important
to
feed
in
some helix errors since
a
perfect helix
match
will
often
give
low
T.E. regardless
of
profile
shape,
but
perfect
helix
matching
is
unrealistic. Even
in a
modern design
it is
worth checking that
long
relief
has not
been used instead
of
short relief
or
vice versa. Although
much
can be
deduced
from
design drawings, there
is no
substitute
for
experimental measurement
of the
T.E.
10.5 Permissible T.E. levels
Inevitably,
in a
development
or
problem investigation
the
question
will
arise
"what
is the
permissible/correct/reasonable
level
of
T.E.?"
Specifications
(DIN
and
ISO)
for
once,
are of no use
whatsoever, partly
because even when they reluctantly mention T.E. they
do not
correctly
specify
the
parameters that
are
relevant
for
noise purposes with
sufficient
care (Fig.
10.5).
F!*
and
fi'
[2,3]
are in
themselves
no
help
since,
for
noise purposes,
the
eccentricity
effects
which dominate
FI'
are
almost completely irrelevant
and
we are
interested
in the
semi-steady
1/tooth
component
and
harmonics,
not
an
odd
peak
f
t
'
value read
off
a
curve which
has
been distorted
by
eccentricity.
In
addition, there
is no
general pool
of
knowledge
in
industry
as to
what level
may or may not be
suitable.
To get a
sensible value
for the
I/tooth error
it is
necessary either
to
carry
out a frequency
analysis
or at
least
to filter out
I/rev
effects.
The
ultimate control
on
T.E.
is
what
the
customer will tolerate
in
that
particular installation. There have been many
instances
where
a
gearbox
was
perfectly
satisfactory
in one car but
sounded terrible
in a
different
model.
In
any
industry
it is
almost inevitable that
a
manufacturer
will
have
to
cross-check
T.E. against
final
installed noise.
176
Chapter
10
T.E
1 rev
Fig
10.5 Typical T.E. showing
how
eccentricity gives false
1/tooth
error.
This cross-check
is
partly
to
convince everyone that
the two are
connected
but
mainly
to set
permissible levels
on
T.E. This
may
result
in
some
major
variations
in
that
a car
gearbox
may
require loaded T.E.
to be
less than
3
um
in
5th,
5 um in
4th,
2
urn
in 3rd
(because
of a
particular
difficult
resonance),
7 um in 2nd and 12 um in
1st
gear.
It
is
worth noting that when
permissible T.E.
is
quoted,
it is
necessary
to be
extremely legalistic
and to
specify
whether
it is
peak-to-peak
of
total
1/tooth
and
higher harmonics
(cutting
out
eccentricities only)
or
peak-to-peak
of
1/tooth
(filtered)
or
peak
of
1/tooth
or
rms
of
1/tooth.
When
the
signal
is
modulated there
are
even more possibilities
according
to
whether maximum
or
average values
are
taken during
a
revolution.
An
industrial general purpose gearbox will
be
used
in
many
installations, some good
and
some
bad so we
need
a
"reasonable"
T.E. level
setting which
is
independent
of
installation.
As
mentioned
in
section
10.1
we
can
then target either gearbox
or
installation according
to
whether
the
measured T.E.
is
above
or
below
the
"reasonable"
level.
A
"reasonable"
level
of
T.E. depends
on
price
and it is
unrealistic
to
expect
an
"industrial" cheap gearbox
to
attain
the
same T.E. figures
as one
costing three times
as
much, although cost
and
quietness
are not
always linked.
Curiously
the
levels
of
T.E.
(in um) are
roughly independent
of
gear size
so
diameter
is not a
major variable.
It is
difficult
to
convince gear
users
that
a
well
made
4 mm
diameter gear
is
liable
to
have
the
same absolute size errors
as a
well made
4 m
diameter gear
but
this, surprisingly,
is
reality.
Improvements
177
The
starting point
is
rather arbitrary,
but
fortunately
in the
S.I. system
there
is a
convenient "round amount"
at
about
the
right point
for
demarcation.
We
can
take
a
figure
of 10
urn
(0.4 mil)
peak-to-peak
at
I/tooth
frequency
as
being
a
dividing line between rough
and
very poor gears.
A
T.E.
of 20 um p-p
would only
be
permissible
on a
large slow-speed
gear
for the
sort
of
machinery where gear noise
is not
really
a
problem.
At the
ultra-precision end,
a
T.E.
of 1 um p-p is
extremely good
and is
correspondingly very rarely achieved. Medium
and
small sized industrial
gears
will generally
be
very satisfactory with less than
3 to 4 um at
1/tooth
p-p
and
this level should
be
achieved with quality
gears.
It
should
be
noted that these
are
"loaded"
values
and
values
on a
no-
load test
for
spur gears will generally
be
higher
so
that, under load,
the
T.E.
reduces
(if
properly designed).
Another
factor
which should
be
checked
is
whether
the
T.E.
is the
correct shape.
In
Fig. 10.6, curve
A is
what
we
would expect
from a
spur gear
and
curve
B is
typical
for a
helical gear.
T.E
A
-
spur
gear
C
-
gear
with
base pitch problem
1
rev
Fig
10.6
Different
once-per-tooth
T.E. shapes with spur, helical
and
faulty
gear.
178
Chapter
10
Curve
C
suggests that something
has
gone badly wrong with
the
geometry since
the
sudden drops
at the
ends
of
each tooth pair
suggests
that
the
base pitches
on the two
gears
are not the
same. This
may be due to an
incorrect design lean
or
correction
on an
involute
profile
or
just
due to bad
manufacture.
T.E. figures
of
less than
5 um p-p
with desired levels
of
perhaps
2 um
appear
to be
extremely accurate
by
normal metrology standards especially
as
we
normally need
to
measure
a
factor
of 10
more accurately
to
meet
specifications reliably.
There
is,
however,
no
problem
in
achieving
this
accuracy
of
measurement reliably
and
consistently with single
flank
checkers.
The
accuracy figure
is
relevant
to
information
which
has
been frequency
analysed, giving large improvements
in
accuracy
because
the
accuracy
at
tooth
frequency is
typically
a
factor
of 30
better than
the
quoted encoder accuracy
[4].
Measuring accuracies
of
0.1
um are
easily achieved provided there
is no
dirt
or
airborne dust
on the
tooth
flanks but the
average metrology shop
is not a
clean
room.
10.6 Frequency changing
A
standard "fix"
for
noise problems
was to try
increasing
the
numbers
of
teeth
by
using
a
smaller module. This, like many other
"cures"
sometimes
makes things better
but may
equally make things worse. There
is a
major
stress
penalty
(in
root
stresses)
in
reducing tooth size
so
some caution
is
needed.
Since
it is a
rather expensive option
to
change
a
gearset,
say,
from 6
mm
module
to 5 mm
module,
it is
perhaps worth considering that
the
same
development
information
can be
obtained
by
running
the
gearset
20%
faster
at
the
same torque level. This
is
because
the
I/tooth T.E. excitation levels
(in
um)
will
be
much
the
same
for the 5 mm and 6 mm
module
teeth
so the
excitation
from 6 mm
module teeth
run 20%
faster will
be
much
the
same
as
that
from 5 mm
module teeth
at the
standard
speed.
The
objective
of the
tooth
number
change
is to
change
the
exciting
frequency and
with luck, move
it
away
from a
resonance
but it
helps greatly
if you
know where
the
resonant
frequency
is
first.
Having
a
variable speed (inverter) drive
is a
great
asset
for
preliminary
tests
because
it
will
immediately show whether
a frequency
increase
(at
constant torque)
will
make
the
noise better
or
worse.
Sometimes there
are no
resonances
as
such
and the frequency
change
is
simply
to
move
the
noise
to a
less irritating
frequency. As a
general rule,
if
the
tooth
frequency is
already above
1 kHz it is
better
to put it up, but if
below
500 Hz, it is
better
to
reduce
the frequency if
possible.
The
main reason
for
avoiding
the 500 Hz to 1 kHz
band
is
that
the
human
(A-weighted)
ear is
most sensitive
in
this range
and
also because many
structures
are at
their noisiest
in
this range.
At
high
frequencies the
Improvements
179
wavelengths
are
smaller
and
panel vibrations have
a
greater tendency
to be in
anti-phase
and
cancel.
At low frequencies,
velocities and, hence, noise
pressure levels drop
and
also hearing sensitivity drops.
10.7 Damping
It
is
tempting
to
think that
it
should
be
possible
to
introduce damping
to
reduce noise levels, either inside
the
gearbox
or in the
structure
of the
installation.
Damping
of
very thin panels such
as car
body panels
is
successful
in
reducing vibration
and
noise levels,
but
attempts
to
increase damping
in a
gearcase
are not
usually very successful. Adding
a pad of
viscoelastic material
to a car
panel 0.75
mm (30
mil) thick
can
absorb
a
high proportion
of the
bending
wave energy passing through
the
panel
and
natural
frequencies are
reduced
due to the
extra mass
but if the
"panel"
is
1"
(25 mm)
thick steel there
are no
suitable materials
to
extract much energy. Machine tool designers have
attempted
to
insert damping layers
at
interfaces between castings,
but
this
approach
has not
been successful
and the use of
materials such
as
synthetic
granite, though having nominally higher damping than
steel,
sacrifices
stiffness.
An
approach which
has
been successful
in
unstressed components
such
as
internal combustion engine rocker
box
covers
has
been
to
sandwich
a
damping
layer between
two
aluminium alloy
sheets.
Scaling this
up to
industrial gearbox thicknesses
does
not
appear
to
work
although some large gearboxes have used
a
layer
of
sand between
two
steel skins. Whether
the
principal
effect
of the
sand comes
from its
mass,
from
its
damping,
or from its
action
in
spacing
the
steel panels apart,
has not
been
stated.
As
previously
mentioned,
although cast iron
has
higher damping than
steel,
the
effect
of the
material damping
is
negligible compared with
the
damping
from
bolted
joints,
shrink
fits,
loose members rattling about
and
energy being dissipated into foundations. When plastic casings were used
for
domestic kitchen equipment
the
noise levels have tended
to be
higher than
for
the
previous
cast
metal
casings
despite
the
higher internal damping
of the
more
flexible
plastic.
The one
technique that
has
been used over
a
wide range
of
industries,
with
reasonable
success,
is the
tuned damped absorber.
An
auxiliary mass
is
supported
on a
damped spring which
is
usually
deformable
nitrile
or
butyl
rubber
and is
tuned
to
just
less than
the frequency of the
troublesome
resonance.
Nitrile rubber
is
popular
as it has
nearly
the
optimum level
of
internal damping, even
at
very
low
amplitudes
of
vibration.
The
theory
was
worked
out by Den
Hartog
over
60
years
ago
(Fig. 10.7)
[5].