Friction and Lubrication in Mechanical Design Episode 1 Part 6 pdf
Bạn đang xem bản rút gọn của tài liệu. Xem và tải ngay bản đầy đủ của tài liệu tại đây (1.06 MB, 25 trang )
The Contact Between Rough Surfaces
105
The results as generated from the simulation for cutting conditions covering
the practical range of applications are used in a regression analysis to obtain
the best fit for the equation parameters
C,
k,, kZ,
k3,
and
k4.
The values of the system parameters of Eq. (4.3) for the case of a chuck
mass
(M,)
of 34kg and machine structures with stiffness
K,
greater than
10' N/m were found to be independent of
K,
and are only dependent on the
uncoupled tool natural frequency,
(5.
All the simulated results were curve-fitted to give the following equations:
where
C;,
=
natural frequency
of
tool
assembly
(Hz)
These equations are applicable for the following conditions when
K,
is
greater than 10' N/m:
6lm/min
<
V
<
305 m/min
0.127 mm/rev
<
f
<
0.88
mm/rev
0.31 mm
-=
d
<
0.71 mm
0.79 mm
<
t
<
2.38
mm
4.3
THE REAL AREA
OF
CONTACT BETWEEN ROUGH
SURFACES
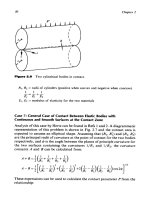
Analytical studies and measurements show that the real area of contact
between surfaces occurs at isolated points where the asperities came
together. This constitutes a very small fraction of the apparent area for
flat surfaces (Fig. 4.3a) or the contour area for curved surfaces (Fig. 4.3b).
For the case of steel on steel flats, the real area of contact
is
in the
order of
0.0001
cm2 per kilogram load. This indicates that pressure on the
microcontacts for any combination of materials is constant and is inde-
pendent of load.
The interactions between the two bodies at the real area are what
determines the frictional resistance and wear when they undergo relative
I06
Chapter
4
Apparent Area
f
Real Area
(4
Contour
Area
Real Area
(b)
Figure
4.3
(a)
Contact of flat surfaces.
(b)
Contact of spherical surfaces.
The Contact Between Rough Surfaces
107
sliding. Even in the case of a Hertzian contact, the pressure distribution is
not continuous. Due to surface roughness it occurs at discrete points, and the
force between the bodies is the sum of the individual forces on contacting
asperities which constitute the pressure distribution. An interesting investi-
gation of this problem was conducted by Greenwood and Tripp
[30].
They
analyzed the contact between rough spheres by a physical model of a smooth
sphere with the equivalent radius of both spheres pressed against a rough flat
surface where the asperity heights follow a normal Gaussian distribution
about a mean surface, as illustrated in Fig. 4.4a. They further assumed
that the tops of the asperities are spherical with the same radius and that
they deform elastically according to Hertz theory. The forces on the aspe-
rities constitute the loading on the nominal smooth bodies whose deforma-
tion controls the extent of the asperity contacts. The problem is solved
iteratively until convergence occurs.
Assuming that the radius of the asperities is
p,
the radius of the contact on
top of an asperity due to a penetration depth @can be calculated as (Fig. 4.4b):
and the corresponding area
of
contact
From the Hertz theory, the load on the asperity can be calculated as:
where
E,, E2
=
elastic moduli
for
the
two
materials
ul,
u2
=
Poisson's
ratios for
the
materials
If
z
is the height of the asperity
and
U
is the distance between the nominal
surfaces at that location, it can
be
seen from Fig. 4.2b that
o
=
z-
U.
Assuming a height distribution probability function
$(z),
the probability
that an asperity is in contact at any location with nominal separation
U
can
be expressed as:
00
prob(z
=-
U)
=
$(z)dz
108
Chapter
4
Figure
4.4
(a) Nominal surfaces and superimposed asperities.
(b)
Contact
between rough surfaces
-
asperity contact.
The expected force
is:
If
the asperity density is assumed to be
q,
the expected number
of
asperities
to be in contact over an element
of
the surface
(&),
where the separation
between the nominal surfaces is
U
can be expressed as:
The
Contact
Between Rough
Surfaces
109
The expected area
of
contact:
00
i3A
=
m,$(&)
1
(z
-
u)~/~~(z)
dz
U
and the expected load within
(da)
is:
00
dP
=
$
qE,B'/2(da)
jU
(z
-
u)~/~~(z) dz
Assuming the standard deviation
of
the asperity heights to be equal to
cr,
the
following dimensionless relationships were used in developing a general for-
mulation for the problem:
0
0
Asperity penetration
U*
=
-
Separation
of
nominal surface at any location
h
=
fi
d
Minimum separation between the nominal surface
d*
=
-
0
0
Radial distance
in
the contact region
p
=
Pressure
p*
=
rn
E',
Jrn
P
Height of asperity
S
=
0
Accordingly, the equations for the contact conditions within an elementary
area
(da)
can be written as:
dP
-
=
<!
q/?1/2a3/2)F3/2(h)
=
average pressure
(d4
where
F,(h)
=
(S
-
h)"@*(s)
ds
r
The two main independent variables are the total load and the surface
roughness. These were used in
a
dimensionless form as follows to evaluate
the contact conditions:
110
Chapter
4
T
=
dimensionless total load
=
2
P/o
E,m
p
=
dimensionless roughness parameter
=
qa,/ZX$
Accordingly:
T
=
JDm
2nPP*(P)dP
U*
=
dimensionless parameter representing the spread
of
pressure over the
contact region (Le., affective radius),
of
the contact area
=
q;
=
dimensionless maximum value
of
the average contact pressure
8a*
I
/3
Tc
qf,
=
dimensionless average contact pressure
=
Numerical results are presented in Greenwood and Tripp
[30]
based on the
previous analysis from which the following conclusions can be stated:
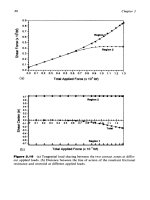
1.
Load has remarkably small effect on the mean real pressure on
top of the asperities. This is illustrated by the numerical results
given in Fig.
4.5.
Consequently the mean real area of contact is approximately
linearly dependent on the applied load.
The proportionality constant between the real area and load
increases with increased root mean square (r.m.s.) roughness
(a)
decreased asperity density and decreased raidus of the aspe-
rities.
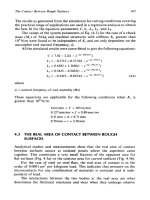
The effective radius of the area over which the pressure is spread
is considerably larger than the Hertzian contact radius for low
loads and approaches the Hertzian contact condition for high
loads. Consequently, the average mean pressure is considerably
lower than the Hertzian pressure for low loads and approaches
it
for high loads. This is illustrated in Fig.
4.6.
2.
3.
4.
It is interesting to note that the first two conclusions are the same as
those noted by Bowden and Tabor
[31]
and the electric contact resistance
measurements reported by Holm
[32].
The constant value of the average
pressure on the real area of asperity contact was assumed to be the yield
stress at the asperity contacts. However, the analysis presented by
Greenwood and Tripp discussed in this chapter provides a rational proce-
The Contact Between
Rough
Surfaces
0.2
-
0.1
111
-
I
I
I
I
0.8
0.7
0.8
1s
0.8
-
w
Figure
4.5
Effect
of
load
on mean real pressure.
A:
q
=
500/mm2,
0
=
5
x
10-~m~,
fi
=
0.2mm;
B:
q
=
940/mm2,
0
=
5
x
10-~mm,
B
=
0.2mm;
C:
q
=
500/mm2,
B
=
9.4
x
10-4
mm,
/I
=
0.2mm. (From
Ref.
30.)
dure based on elastic deformation of the asperities for calculating this con-
stant stress value from the surface roughness data and the elastic constants
of the surface layer. Later investigations showed that a combination of
elastic and plastic asperity contacts can occur for typical surface finishing
processes depending on the load and the thickness
of
the lubricating film.
This will be discussed later in the book.
4.4
THE INTERACTION BETWEEN ROUGH SURFACES DURING
RELATIVE
MOTION
It has been shown in the last section that the contact between elastic bodies
with rough surfaces occurs at discrete points on the top of the asperities. The
interaction takes place at surfaces covered with thin layers of materials,
which have different chemical, physical, and thermal characteristics from
the bulk material. These surface layers which unite under pressure due to the
influence of molecular forces, are damaged when the contact is broken by
relative movement. During the making and breaking
of
the contacts, the
Chapter
4
\
\
\
I
\
I
Rough
(Greenwood)
\/-
I
Dimensionless Radius
Rough
(Greenwood)
Dimensionless Radius
Figure
4.6
Comparison of pressure distribution for rough and smooth surfaces:
(a)
low
load;
(b) high load.
The Contact Between Rough Surfaces
I13
underlying material deforms. The forces necessary to the making and break-
ing of the contacts, in deforming the underlying material constitute the
frictional resistance to relative motion. It can therefore be concluded that
friction has a dual molecular-mechanical nature. The relative contribution
of these two components to the resistance to movement depends on the
types of materials, surface geometry, roughness, physical and chemical
properties of the surface layer, and the environmental conditions in which
the frictional pair operates.
4.5
A
MODEL
FOR
THE MOLECULAR RESISTANCE
Molecular resistance or adhesion between surfaces is a function of the real
area of contact and molecular forces which take place there.
A
theoretical
relationship describing the effect of the molecular forces can be given as:
where
h
=
Planck’s constant
=
6.625
x
10-27
erg-sec
c
=
speed
of
light
I
=
distance between the contacting surfaces
m,
n,
e
=
mass, charge, and volume density
of
electrons in the solid
Adhesive forces are generally
not
significant
in
metal-to-metal contacts
where the surfaces generally have thin chemical or oxide layers.
It
can be
significant, however, in contacts between nonmetals or metals with thin
wetted layers on the surface as well as in the contacts between microma-
chined surfaces.
4.6
A
MODEL
FOR
THE MECHANICAL RESISTANCE
The role of roughness in the frictional phenomena has been a central issue
since Leonardo da Vinci’s first attempt to rationalize the frictional resis-
tance. His postulation that frictional forces are the result
of
dragging one
body up the surface roughness of another was later articulated by Coulomb.
This rationale is based on the assumption that both bodies are rigid and that
no deformation takes place in the process.
I
I4
Cii
up
I
c
r
4
Figure
4.7
Surface
waves
generated
by
asperity
penetration.
A
modern interpretation of the mechanical role
of
roughness is based on
the elastic deformation of the contacting surfaces due to asperity penetra-
tion. The penetrating asperity moving
in
a
tangential direction deforms the
underlying material and gives rise
to
a
semi-cylindrical bulge in front
of
the
identor which is lifted
up
and also spreads sideways as elastic waves. This is
diagrammatically illustrated
in
Fig.
4.7.
The size
of
the bulge depends on the
relative depth
of
penetration
w/p.
where
w
is the penetration depth and
B
is
the radius
of
the asperity. The process is analogous
to
that of the movement
of
a boat creating waves
on
the water surface. According to this theory. the
energy dissipated in the process of deforming the surface
is
the source
of
the
mechanical frictional resistance and the surface waves generated are the
source of frictional noise.
4.7
FRICTION
AND
SHEAR
Both
friction and shear represent resistance
to
tangential displacement. In
the first case, the traction resistance
is
on the surface
or
"external" to the
The Contact Between Rough
Surfaces
I15
Table
4.2
Friction and Shear
Traction Contact Direction of material Characteristic of
force displacement displacement
Friction External Discrete Perpendicular
to
the Sinusoidal waves
Shear Internal Continuous Parallel to the Laminar
movement
movement
body. In the case of shear, the resistance is “internal” in the bulk material. A
comparison between the two phenomena can be summarized in Table
4.2.
It should also be noted that friction occurs when the strength of the
surface layers is lower than the underlying layers. On the other hand, if the
surface layers are harder to deform than the underlying layers, it is expected
that shear would occur. In other words, friction can be associated with a
“positive gradient” of the mechanical properties with depth while shear can
be associated with a “negative gradient” of the material properties with
depth below the surface.
As
illustrated in Fig. 4.8, the former causes gradual
destruction of the surface layer with severity depending on the number of
passes that one surface makes on the other.
A
negative gradient of the
strength of the surface layer would result in rapid destruction of the bulk
material which occurs at the depth where the strength of the material is
below what is necessary to sustain the tangential load.
4.8
RELATIVE PENETRATION DEPTH AS A CRITERION
FOR
THE CONTACT CONDITION
An identor with spherical top is assumed in order to develop a qualitative
criterion for the effect
of
the depth of penetration on the stress condition on
(a)
(4
Figure
4.8
Effect of shear strength gradient on surface damage. (a)
dr/dh
>
0,
destruction of surface layer.
(b)
dt/dh
<
0,
destruction
of
bulk material.
I16
Chapter
4
the surface. The model can be applied on a microscale where the identor is
an asperity, or a macroscale where the indentor is a cutting tool with a
spherical radius. Assuming homogeneous materials and applying the
Hertz theory, the following relationships can be written:
a2
h
=
penentration depth
=
-
R
a
=
0.88
/;
R
qo
=
0.66
.
-
E2
=
maximum contact pressure
G
where
a
=
radius of contact area
R
=
radius of the identor
P
=
applied load
E
=
effective modulus of elasticity
The relative penetration depth can therefore be expressed as:
Substituting for
Pi3
from:
q;
R4I3
0.
4356E4I3
PI3
=
=
1.78(g)2
h
-
0.77444; R4I3
R2I3
R
-
0.4356Pl3 E2I3 R2
-
The above equation shows that the relative depth of penetration can be used
as a dimensionless parameter for evaluating the severity of the contact and
its transition from elastic to plastic to cutting. Figure
4.9
gives an illustration
of
utilizing the penetration ratio for this purpose
[32].
4.9
EFFECT
OF
SLIDING
ON
THE CONTACTING SURFACES
The relative sliding between rough surfaces and the traction forces and
frictional energy generated in the process result in a change in the tempera-
ture and properties of the surface and the layers beneath it. High thermal
The
Contact Between
Rough
Surfaces
I17
Figure
4.9
Effect
of
relative penetration
of
severity
of
contact. (a) Elastic contact:
h/R
-=
0.01
ferrous metals;
h/R
<
0.0001
nonferrous metals. (b) Plastic contact:
h/R
<
0.1 dry contact;
h/R
-=
0.3
lubricated contact. (c) Microcutting:
h/R
=-
0.1
dry contact;
h/R
>
0.3
lubricated contact.
flux can be expected at the asperity contacts for high sliding speeds, and the
corresponding thermal gradients can produce high thermal stresses in the
asperity and material layers near the surface. Because of its importance, the
thermal aspects of frictional contacts will be discussed in greater detail in the
next chapter.
The changes in the surface properties that occur include those caused by
deformation and strain of the surface layer, by the increase in surface tem-
perature and by the chemical reaction with the environment.
Deformation at the surface may produce microcracks in the surface
layer and consequently reduce its hardness. The combination
of
compressive
stress and frictional force and interaction with the environment can cause
structural transformation in the surface material known as mechanochem-
istry. Also, a marked degree
of
plasticity may occur, even in brittle materi-
als, as a result of the nonuniform stress or strain at the surface. High
microhardness may also occur immediately below the surface as a result
of sliding. Its depth varies with the parameters contributing to the work-
hardening process.
It should be noted that if the contact temperature exceeds the recovery
temperature (i.e., the recrystallization temperature of the alloy), the surface
I18
Chapter
4
layers become increasingly soft and ductile.
As
a result, the surface becomes
smoother upon deformation.
Also,
when two different metals are involved
in sliding, one of them softens while the other remains hard. Transfer of
metal occurs and one surface becomes smoother at the expense of the other.
The transfer of metal may occur on a microscale, as well as a macroscale.
The chemical interaction between the surface and the environment is an
important result of the frictional phenomenon. It is well known that appre-
ciably deformed materials are easily susceptible to oxidation and chemical
reactions in general. The chemical layers formed on the surface can signifi-
cantly influence the friction and wear characteristic, as well as the transfer
of
frictional heat into the sliding pair. The chemical reaction can produce thin
layers, which are generally very hard, on thick layers that are very brittle.
Oxide films formed on the surface can have different compositions depending
on the nature of the sliding contacts and the environmental conditions. Steel
surfaces may produce
FeO,
Fe304, or Fe2O3, and copper alloy surfaces can
produce CuzO or CuO depending on the conditions
[32,
331.
For example,
hard Fe2) oxides (black oxide) can exist in the sliding contacts between
rubber (or soft polymers) and a hard steel shaft in water pump seals. They
are known to embed themselves into the soft seal and cause severe abrasive
wear to the hard shaft. On the other hand, conditions can cause Fe304 (red
oxide) to be formed which is known to act as a solid lubricant at the interface.
1.
2.
3.
4.
5.
6.
7.
Albrecht, A.
B.,
“How to Secure Surface Finish in Turning Operations,” Am.
Machin., 1956, Vol.
100,
pp. 133-136.
Chandiramani,
K.
L., and Cook,
N.
H.,
“Investigations on the Nature
of
Surface Finish and Its Variations with Cutting Speed,” Trans. ASME, 1970,
Vol. 86, pp. 134-140.
Olsen,
K.
V.,
“Surface Roughness in Turned Steel Components and the
Relevant mathematical Analysis,” Prod. Engr, 1968, pp. 593606.
Solaja, V., “Wear of Carbide Tools and Surface Finish Generated in Finish
Turning of Steel,” Wear, 1958, Vol. 2, pp. 40-58.
Ansell, C. T., and Taylor,
J.,
“The Surface Finish Properties
of
a Carbide and
Ceramic tool,” Advances in Machine
Tool
Design and Research, Proceedings
of 3rd International MTDR Conference, Pergamon Press, New York, NY,
1962, pp. 235-243.
Taraman,
K.,
“Multi-Machining Output-Multi Independent Variable Turning
Research by Response Surface Methodology,” Int.
J.
Prod. Res., 1974, Vol.
Wu,
S.
M.,
“Tool
Life Testing by Response Surface Methodology Parts
I
and
11,”
Trans. ASME, 1964, Vol. 86, pp.
105.
12(2), pp. 233-245.
The Contact Between Rough Surfaces
119
8.
9.
10.
11.
12.
13.
14.
15.
16.
17.
18.
19.
20.
21.
22.
23.
24.
25.
Hasegawa, M., Seireg, A., and Lindberg, R. A., “Surface Roughness Model for
Turning,” Tribol. Int., 1976, pp. 285-289.
Sata, T., “Surface Roughness in Metal Cutting,” CIRP, Ann. Alen Band, 1964,
Vol. 4, pp. 190-197.
Kronenberg, M.,
Machining Science and Application,
Pergamon Press, London,
England, 1967.
Tobias,
S.
A.,
Machine
Tool
Vibration,
Blackie and Son, London, England,
1965.
Kondo, Y., Kawano,
O.,
and Soto, H., “Behavior of Self Excited Chatter due
to Multiple Regenerative Effect,” J. Eng. Indust., Trans. ASME, 1965,
Vol.
103, pp. 447454.
Sisson,
T.
r., and Kegg, R. L., “An Explanation of Low Speed Chatter
Effects,” J. Eng. Indust., Trans. ASME, 1969, Vol. 91, pp. 951-955.
Armarego, E. J. A., and Brown, R. H.,
The Machining
of
Metals,
Prentice Hall,
Englewood Cliffs, NJ, 1969.
Rakhit, A.
K.,
Sankar, T.
S.,
and Osman, M.
0.
M., “The Influence of Metal
Cutting Forces on the Formation of Surface Texture in Turning,” MTDR,
Sankar,
T.
S.,
and Osman,
M.
0.
M.,
“Profile Characterization of
Manufactured Surfaces
Using
Random Function Excursive Technique,”
ASME J. Eng. Indust., 1975, Vol. 97, pp. 190-195.
Rakhit,
A.
K., Osman, M.
0.
M.,
and Sankar, T.
S.,
“Machine Tool
Vibrations: Its Effect on Manufactured Surfaces,” Proceedings 4th Canadian
Congress Appl. Mech., Montreal, 1973, pp. 463-464.
Wardle,
F.
P.,
Larcy,
S.
J.,
and Poon,
S.
J.,
“Dynamic and Static
Characteristics
of
a Wide Speed Range Machine Tool Spindle,” Precis. Eng.,
Nassipour, F., and Wu,
S.
M., “Statistical Evaluation of Surface Finish and Its
Relationship to Cutting Parameters in Turning,” Int. J. Mach. Tool Des. Res.,
Zhang, G. M., and Kapoor,
S.
G., “Dynamic Generation of Machined
Surfaces,” J. Indust. Eng., ASME, Parts I and
11,
1991, Vol.
113,
pp. 137-159.
Olgac, N., and Zhao,
G.,
“A Relative Stability Study on the Dynamics of the
Turning Mechanism,” J. Dyn. Meas. Cont., Trans. ASME, 1987, Vol. 109, pp.
164-170.
Jemlielniak, K., and Widota,
A.,
“Numerical Simulation of Non-Linear
Chatter Vibration in Turning,” Int.
J.
Mach. Tool Manuf., 1989, Vol. 29,
Tlusty,
J.,
Machine
Tool
Structures,
Pergamon Press, New York, NY, 1970.
Kim,
K.
J., and Ha, J. Y., “Suppression of Machine Tool Chatter Using a
Viscoelastic Dynamic Damper,” J. Indust. Eng., Trans. ASME, 1987, Vol. 109,
Nakayama, K., and Ari, M., On the Storage
of
Data on Metal Cutting
Forces,” Ann. CIRP, 1976, Vol. 25, pp. 13-18.
1970, Vol. 16, pp. 281-292.
1983, Vol. 83, pp. 175-183.
1977, Vol. 17, pp. 197-208.
pp. 239-247.
pp. 58-65.
I20
Chapter
4
26.
27.
28.
29.
30.
31.
32.
33.
Rao, P.
N.,
Rao,
U.
R.
K.,
and Rao,
J.
S.,
“Towards Improved Design of
Boring Bars Part
I
and
11,”
Int.
J.
Mech. Tools Manuf.,
1988,
Vol.
28,
pp.
34-
58.
Tlusty,
J.,
and Ismail,
F.,
“Special Aspects of Chatter in Milling,” ASME
Paper No. 18-Det-18,
1981.
Skelton, R. C., “Surface Produced by a Vibrating
Tool,”
Int.
J.
Mech. tools
Manuf.,
1969,
Vol.
9,
pp.
375-389.
Jang,
D.
Y.,
and Seireg, A., “Tool Natural Frequency as the Control
Parameter for Surface Roughness,” Mach. Vibr.,
1992,
Vol.
1,
pp.
147-154.
Greenwood,
J.
A., and Tripp,
J.,
“The Elastic Contact of Rough Spheres,” J.
Appl. Mech., Trans. ASME, March,
1976,
pp.
153-159.
Bowden,
F.
P., and Tabor,
D.,
Friction and Lubrication
of
Solids,
Oxford
University Press,
1954.
Kragelski,
I.
V.,
Friction and Wear,
Butterworths, Washington,
1965.
Holm,
R.,
Ekctric Contacts Handbook,
Springer, Berlin,
1958.
5
Thermal
Considerations in
Tribology
5.1
INTRODUCTION
This chapter gives a brief review
of
the fundamentals
of
transient heat trans-
fer and of some of the extensive literature on the subject. Some representative
results and equations are given to illustrate the effect of the different para-
meters on the transient temperatures generated between rubbing surfaces.
5.2
THERMAL ENVIRONMENT IN FRICTIONAL CONTACT
The severe thermal environment which may occur in frictional contacts
[I]
due to the combination
of
high pressures and sliding speeds is one of the
main factors in the malfunctioning
of
machine elements such as gears, bear-
ings, cams, brakes, and traction drives. The flash temperature
[2],
which
represents the maximum rise in surface temperature inside the contact
zone, has long been used
as
a design limit against scoring in gears. The
thermocracking or warping of the sliding components and the desorption
of the protective boundary lubrication film are among several failure
mechanisms associated with the high flash temperature. On the other
hand, the thermal environment inside the contact zone may precipitate
the creation of a beneficial chemical film which protects against asperity
interactions for certain material-lubricant combinations and temperature
levels
[3].
Furthermore, both film temperature and contact pressure control
the glass transition for lubricant and consequently the high-slip traction in
elastohydrodynamic lubrication
[4].
121
I22
Chapter
5
Blok
[5]
and Jaeger
[6]
developed the theoretical foundation for the flash
temperature prediction in lubricated dry rubbing solids. The thermal solu-
tion for the lubricating film temperature was developed much later by Cheng
and Sternlicht [7], and Dowson and Whitaker [8]. Jaeger’s formula [6] for the
fast-moving heat source along a semi-infinite plane was utilized in these
studies as a boundary condition along the moving solid surfaces. The possi-
ble modification in heat partition among the moving solids due to the fluid
film existence was not considered. Both the convected heat by lubricant and
the conducted heat in the direction of motion are assumed negligible.
Manton et al.
[9]
investigated the temperature distribution in rolling/sliding
contacts lubricated by a Newtonian oil using the finite difference method.
They carried out their solution for identical steel disks to compare the tem-
perature distribution resulting from using different oil grades. More recently,
the temperature distribution for a rheological fluid was studied by Conry
[
101. Wang and Cheng
[
1
I] introduced the limiting shear stress concept in
their solution for the temperature in spur gear teeth contacts. In both studies
the solution is based on the “constant strength’’ moving heat source theory
[6] which may not be valid at the starting and at the end of the engagement
cycle in gears where the surface curvature changes rapidly with time.
It
has been long recognized that perfectly clean sliding surfaces would
not function as a tribological pair. Accordingly, it is generally accepted that
friction and wear can be considerably influenced by controlling both phy-
sical and chemical properties of surface films and the art of antiwear addi-
tives is an integral part of lubrication technology. Another technique used to
reduce friction and wear is the coating of one or both of the rubbing surfaces
[12, 131 with appropriate layers of different materials. There are several
experimental observations which suggest that a reduction in lubricant film
thickness in elastohydrodynamic lubrication accompanies the chemical film
formtion [14]. These chemical films act as thermal screens on the surfaces,
which might add
to
the inlet viscous heating and the compressibility effect in
reducing the film thickness. A drop in the traction coefficient has also been
reported to occur with the appearance of these chemical films in lubricated
concentrated contacts
[
14, 151. The high temperature rise inside the contact
zone and the difference in thermal expansion between the material of the
layers and the material of the friction pair may cause cracking or complete
destruction of the layer.
A
modification in the heat partition between two
rubbing solids may also be related to the existence of oxide films on their
surface [16]. In cutting tool technology
it
is found that coating a tool with a
layer of low thermal conductivity gives a significantly longer tool life [17].
Other related studies can be found in Refs 18-22.
Because of the considerable interest in the subject and its practical
importance, a comprehensive analysis of the temperature distribution and
Thermal Considerations
in
Tribology
I23
heat partition for layered rolling/sliding solids was undertaken by Rashid
and Seireg [23].
A
computer-based simulation is described in Part I of the
paper which can be used to study temperature distribution in lubricated
layered contacts. The simulation is utilized in the accompanying paper to
generate dimensionless relationships, which can be easily used to predict
heat partition and maximum temperatures in the contacting surfaces and
in the lubricating film for different system parameters. Dimensionless rela-
tionships are also developed for lubricated unlayered contacts and dry
layered contacts. Because of the recent interest in tribological surface coat-
ing, the latter can be utilized to evaluate heat partition and temperature rise
in the contact under different coating parameters and operating conditions.
Some of the results of the study are presented later in this chapter.
5.3
AN INTRODUCTORY TREATMENT
OF
TRANSIENT HEAT
TRANSFER
This section presents some of the fundamental concepts and relationships on
which transient heat transfer is based. It deals primarily with one-directional
conduction of heat and gives some design equations and illustrative exam-
ples of how these relationships are applied. The objective is to give the
designer of tribological systems a basic understanding of the phenomenon
and how it is influenced by the different system parameters, rather than a
rigorous treatment of the subject.
5.3.1
Heat Penetration Depth
If the surface of a conductivity material is subjected to a temperature rise
ATo,
as shown in Fig.
5.1,
the depth
of
heat penetration
d,
at any time
t
after the initiation of the heat
flow
process, can be calculated from:
d=&G
where
k
K
=
thermal diffusivity
=
-
PC
k
=
thermal conductivity
p
=
density
c
=
specific
heat
(5.1)
Equation
(5.1)
is plotted in Fig.
5.1
for steel.
124
Chapter
5
24
20
I
4
0
0
4
8
12 16 20 24
28
32
Time
-
t
(min)
Figure
5.1
Penetration distance
for
steel prior to full penetration
(r
-=
tL).
5.3.2
Time for Penetrating the Full Thickness of a Heated Slab
For this condition,
d
=
L,
the thickness
of
the slab,
Eq.
(5.1) can be rewrit-
ten as:
tL
=
0.08L2min
(L
in inches)
where
tL
=
full penetration time for steel
5.3.3
Temperature Distribution in the Thickness for
t
<
tr
The temperature distribution in the penetrated depth
d
can be calculated
from:
AT
2
-=
(1
-5)
ATQ
(5.2)
Thermal
Considerations
in
Tribology
125
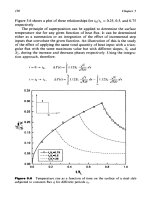
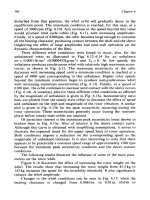
The normalized temperature distribution in the penetrated layer is
plotted in Fig.
5.2
for different ratios of the thickness of the layer to the
thickness of the slab.
After full penetration the temperature at the other surface begins
to
rise.
Assuming no convection of heat from that surface the temperature rise
(AT,)
at any time
t
>
tL
can be calculated from:
This relationship is plotted in Fig.
5.3
in a dimensionless form. The time
scale is also plotted in the figure for steel slabs with thickness
1,
2,
5,
10,
and
1
.o
0.8
0.6
0.4
0.2
0.0
0.0
0.2
0.4
0.6
0.8
1
.o
YlL
Figure
5.2
Temperature distribution
below
the surface prior
to
full
penetration
0
<
tL).
I26
Chapter
5
20
in., respectively. The graph also shows the penetration time
fL
in minutes
for the above conditions.
5.3.4
Temperature Distribution for
f
>
t~
The temperature distribution across the thickness for
t
>
tL
can be calcu-
lated as:
(5.4)
This relationship is plotted in Fig.
5.4
for different values of
ATL/ATo.
It can
be seen from Figures
5.2
and
5.4
that the maximum temperature gradients in
this case occur at the onset
of
the heat flow. It can also be seen from Fig.
5.3
that the temperature distribution in the entire slab becomes uniform with less
than
5%
of deviation of
A
To
after
15
times the full penetration time.
1
.o
0.8
0.2
0.0
0
4
8
12 16 20
t
I
tL
Figure
5.3
Temperature rise at the bottom surface
of
a steel slab due
to
a step
temperature,
ATo,
applied at
the
top surface.
Thermal Considerations in Tribology
127
1
.o
0.8
0.6
to
g
0.4
0.2
0.0
YIL
Figure
5.4
Temperature distribution through the thickness
of
a
steel
slab
for
t
<
tL.
5.4
TEMPERATURE RISE
DUE
TO HEAT INPUT
The frictional heat input at the interface can be calculated as:
Q
=
J
BTU/sec
where
p
=
coefficient of friction
V
=
sliding velocity
J
=
Joule equivalent
of
heat
128
Chapter
5
If the area of contact between the two bodies is
A,
then the heat flux in each
body can be calculated from:
Q
Q2
=
(1
-a)
2
where
a
=
heat partition coefficient which is a measure of the effective thermal
resistance
of
each body
A
simplified equation for the calculation of
a
can be written as:
11
-I-
where
kl,
k2
=
conductivity
of
the bulk material
of
both bodies respectively
kl,
,
k12
=
conductivity
of
the two surface layers
It can be seen that
if
kl,
>>
kl
and
k12
>>
k2,
then:
On the other hand, if
kl,
<<
kl
and
k12
<<
k2,
then:
and in the case of steel bodies separated by an
oil
film or insulative surface
layers
of
the same composition
k,,
=
k,,
.
Therefore,
a
=
(1
-
a)
=
1
/2,
and
the heat flow is equally partitioned between the two bodies. This simple
relationship
is
used for qualitative illustration of the concept
of
heat parti-
tion.
A
procedure for rigorous treatment of the partition is discussed later in
this chapter.
If
a sustained uniform heat
flux,
4,
is applied to the surface of a semi-
infinite solid, the temperature rise on the surface can be calculated as follows:
Thermal Considerations
in
Tribology
129
1.12qJI
a
AT=-
For a slab of depth
L,
subjected to a constant heatflux
q,
the above equation
can be rewritten in dimensionless
form
as:
L
is used as
a
reference dimension and time
is
normalized w.r.t. the corre-
sponding full penetration time
tL.
This relationship is plotted in Fig.
5.5.
The temperature rise due to a constant
flux
q,
applied for a finite period
to,
can therefore be calculated as the superposition between a positive
q
input at
t
=
0,
and a negative
q
at
t
=
to.
Accordingly:
0.35
0.30
0.25
0.20
0.15
0.10
0.05
0.00
0.0
0.2
0.4
0.6
0.8
1
.o
$4
Figure
5.5
stant heat
flux
q
for a period
to,
Maximum surface temperature rise in a steel slab subjected to a con-