Benthic algae as bioindicators of agricultural pollution in the streams and rivers of southern Que´bec docx
Bạn đang xem bản rút gọn của tài liệu. Xem và tải ngay bản đầy đủ của tài liệu tại đây (673.18 KB, 35 trang )
Benthic algae as bioindicators of
agricultural pollution in the
streams and rivers of southern Que
´bec
Benthic algae as bioindicators of agricultural
pollution
in the streams and rivers of southern Que´bec
(Canada)
Isabelle
Lavoie,
1
,
2
∗
Warwick F.
Vincent,
1
,
2
Reinhard
Pienitz,
2
,
3
and Jean
Painchaud
4
1
De´partement de biologie, Universite´ Laval, Que´bec, G1K 7P4
Canada
2
Centre
d’E
´
tudes Nordiques, Universite´ Laval, Que´bec, G1K 7P4
Canada
3
De´partement de ge´ographie, Universite´ Laval, Que´bec, G1K 7P4
Canada
4
Direction du suivi de l’e´tat de l’environnement, ministe`re de l’Environnement du
Que
´bec,
675 Rene´-Le´vesque est, Que´bec, G1R 5V7
Canada
∗
Corresponding
author: E-mail:
ilavoie@t r entu.ca
The objective of this study was to evaluate the effect of agricultural pollution on periphyton in streams
and rivers of southern Que´bec. We sampled benthic algae incubated from mid-July to mid-August on
artificial substrates at 29 sites and analysed the variations in community structure and total community
biomass. Diatom community structure as well as total benthic algae community were analysed. Water
samples were taken to provide background chemical information, and land use data were also obtained.
Preliminary tests showed that colonisation of the artificial substrates (unglazed ceramic tiles) resulted in
biomass levels (Chlorophyll a and ash-free dry weight) and species composition that were not statistically
different from those on natural rock substrates. The canonical correspondence analyses showed that pH,
conductivity and suspended solids were the most
significant
environmental variables accounting for
variations among sites and diatom community structure. No additional resolving power was obtained by
including cyanobacteria, green algae and flagellates. This total community analysis substantially increased
variance and sample processing time while reducing the relationship with environmental variables. These
results indicate that an analysis based exclusively on diatoms provided the optimal approach. Traditional
nutrient measurements (phosphorus and nitrogen) did not explain a significant part of the variance in the
species composition among sites. The ordination analyses clearly separated
agriculturally-impacted
streams
from reference sites, but no
significant
grouping was observed related to the intensity and type of agriculture,
indicating the greater importance of local farming practices. The use of periphyton as a bioindicator provides
an integrated measurement of water quality as experienced by the aquatic biota, and therefore offers a useful
addition to physico-chemical water quality monitoring strategies.
Keywords: artificial substrates, land use, multivariate analyses, nutrients, periphyton, water quality
Introduction
Intense farming has led to severe disturbance of
watersheds throughout the world, resulting in funda-
mental changes in the structure and functioning of
stream ecosystems. Modern intensive agriculture is
responsible for chemical and physical alterations such
as increased contaminant and nutrient runoff, an in-
crease in suspended solids due to erosion, and
changes in discharge and channel morphology
(Skinner et al.,
1997). The traditional physico-chemical
measurements used in
water quality monitoring
programs
such as total
phosphorus
and
suspended
sediment load
are an impor- tant guide to
environmental change. However, they are
43
Aquatic Ecosystem Health & Management, 7(1):43–58, 2004. Copyright
∗
C
2004 AEHMS. ISSN: 1463-4988 print / 1539-4077 online
DOI:
10.1080/14634980490281236
44
Lavoie et al. / Aquatic Ecosystem Health and Management 7 (2004) 43–
58
only representative of short-term conditions found at
the instant of sampling and do not provide
information about the effects of these changes on
biological com-
munities.
The need for a better
comprehension
of inter- actions between
environmental quality and ecosystem integrity has
increased the interest in finding biolog- ical
indicators that provide a more accurate guide to
changes in ecological conditions.
From the earliest years of the last century, peri-
phytic (benthic) algae have been identified as a valu-
able option for the biomonitoring of stream and river
ecosystems (Kolkwitz and Marsson, 1908 cited by
Hill et al., 2000). More recently, this approach has
been applied with success to evaluate a variety of wa-
ter quality problems (e.g., Kutka and Richards, 1996;
Mattila and Ra¨isa¨nen, 1998; Rott et al., 1998;
Hill et al., 2000; Winter and Duthie, 2000a; Munn
et al.,
2002; Potapova and Charles, 2003). Periphytic com-
munities provide an integrated measurement of water
quality as experienced by the aquatic biota and have
many biological attributes that make them ideal or-
ganisms for biological monitoring. Algae lie at the
base of aquatic food webs and therefore occupy a
pivotal position at the interface between biological
communities and their physico-chemical environment
(Lowe and Pan, 1996). Furthermore, benthic algae
have short life cycles and can therefore be expected
to respond quickly to changes in the environment
(McCormick and Stevenson, 1998). However, few
studies to date have examined the potential for algal
bio-monitoring across a gradient of agriculturally im-
pacted streams.
The present study was undertaken to evaluate the
application of periphyton bio-monitoring to enriched
streams within agricultural landscapes as a tool to as-
sess water quality. We hypothesised that periphytic
al- gal community structure would be strongly
influenced by the presence, intensity and type of
farming activity in the surrounding watershed. We
evaluated this hy- pothesis by
examining
the
colonisation
of ceramic sub- strates incubated in 29
streams and rivers in southern Que´bec, Canada,
across a gradient of agricultural im- pacts. By
applying multivariate analysis
to the resultant
patterns
of
benthic
algal
community structure,
we iden- tified
the potential controlling variables and relation- ships
with farming activities. As secondary objectives, we
evaluated to what extent the community biomass and
structure on our artificial substrates represented
natural communities and whether a total algal
commu- nity analysis provided additional
bio-
monitoring
infor- mation beyond that provided by an
analysis restricted to diatoms.
45
Lavoie et al. / Aquatic Ecosystem Health and Management 7 (2004) 43–
58
Materials and methods
Study sites
The substrate comparison was carried out in the
Boyer River (watershed area, 217
km
2
) situated on
the south shore of the St. Lawrence River, Que´bec
(site 1 in Figure 1). The Boyer River discharges into
the St. Lawrence approximately 30 km east of Que
´bec
City. The land use in the watershed is 60%
farmland
and
40% broadleaf-conifer forest. Our sampling site was
within a 10 meter section of the river just downstream
of small riffles. The stream bed was mostly gravel
and rocks with some sandy areas.
The main part of the study was
conducted
at 29
sites in southern Que´bec (Figure 1). While the
objective of the study was to evaluate the diatom
community struc- ture across a gradient of
agriculturally impacted sites, four unimpacted sites
were also sampled in order to have information at the
lower boundary of the enrich- ment gradient. The
sites were chosen from a network of approximately
400 sites that have been routinely monitored for
water quality for more than 20 years by the Que
´bec Ministry of the Environment (MENV)
(Painchaud, 1997). We selected the sites according to
the
availability
of
physico-chemical
data and on the
ba- sis of land use information with the aim of
sampling across a gradient of farm types and
intensities.
Physico-chemical measurements
Water
samples
were
taken
from
the
29
sites
at
weekly intervals from mid-July to mid-August 1999
and were analysed by the MENV for the following
variables: pH, conductivity, temperature, suspended
solids (SS), turbidity (TUR), dissolved total-N (TN),
ammonium
(NH
4
+
-N), nitrate
(NO
3
-N), total phosphorus (TP),
to-
tal dissolved
phosphorus
(TDP), soluble reactive
phos-
phorus (SRP), and dissolved organic carbon (DOC).
The P and N variables were analysed by standard col-
orimetric assays using a Technicon Autoanalyzer.
To- tal nitrogen (TN) was analysed after Kjeldahl
digestion
and TP after acid digestion at
550
◦
C.
Conductivity
and
pH were measured with appropriate meters in the lab-
oratory within several hours of collection. Turbidity
was measured by nephelometry, SS were measured
by dry weight analysis and temperature was measured
on site. The methods for all analyses and detection
lim- its are given in He´bert (1999). Land use
information upstream of each site was provided by
the MENV and included: population in 1996 (pop.
96), municipal area in hectare (M.A.), % cropped
area (% C.A.), % corn
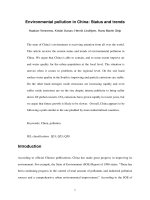
Figure 1. Distribution of sites analysed in the present study. Key to sites
(
∗
indicates
unimpacted reference sites): 1
=
Boyer River; 2
=
Du
Portage Stream; 3
=
Honfleur Stream; 4
=
∗
Etchemin
River; 5
=
Beaurivage River; 6
=
Bras d’Henri River; 7
=
Des Iles-Brule´es River;
8
=
Be´lair River; 9
=
∗
Au
Saumon River; 10
=
Coaticook River; 11
=
Noire River; 12
=
Runnels Stream; 13
=
Chibouet River; 14
=
A la
Barbue River; 15
=
Du Sud-Ouest River; 16
=
Des Hurons River; 17
=
L’Acadie River; 18
=
Des Anglais River; 19
=
Chaˆteauguay River;
20
=
Norton Stream; 21
=
∗
Des
Envies River; 22
=
De l’Achigan River; 23
=
Saint-Esprit River; 24
=
∗
L’Assomption
River; 25
=
Point
du Jour Stream; 26 = Vacher Stream; 27 = Bayonne River; 28 = Saint-Esprit Stream; 29 = Desrochers Stream. The substrate comparison
was conducted at site 1.
crop (% C.C.), % forage (% F.), % row crops (%
R.C.),
% small grains (% S.G.), animal density in animal
units per hectare (A.D.), % beef cattle (% B.C.), %
hog (% H.) and % poultry (% P.).
Artificial substrates
The substrates selected for this study were grey,
non-glazed ceramic tiles of 23
cm
2
, fixed to concrete
blocks with plastic-coated wire. They provided a ho-
mogeneous, near-natural surface
for
colonisation.
Nine ceramic tiles were fixed on each concrete block
in or- der to have triplicate samples for each type of
analysis (chlorophyll a (Chl a), ash-free-dry-weight
(AFDW),
and
taxonomic analysis).
The blocks were placed in
the stream bed in unshaded areas where water was
flowing with the ceramic tiles oriented horizontally.
Excava- tion was necessary at some sites to insure a
minimum of water above each substrate.
For the experiment on artificial substrates in the
Boyer River, we sampled periphytic algae on
natu- ral rocks, sterile substrates and artificial
substrates to evaluate the temporal evolution of
biomass, assessed as AFDW and Chl a, and diatom
community suc- cession on different substrate types.
The sterile sub- strates were natural rocks taken from
the adjacent field and placed on the river bed. The
periphytic commu- nity on the substrates was scraped
every two weeks from May 27 to August 8, 1999
using a template
(13
cm
2
), blade and brush. Known areas of 13 cm
2
were scraped from three separate tiles, sterile rocks
or natural rocks for each analysis (Chl a, AFDW and
taxonomy).
Biomass analysis and community structure
on different substrates
Samples for Chl a and AFDW analyses were
filtered on to GF/C glass fiber filters and additional
samples were preserved with a solution of 10%
paraformalde- hyde and glutaraldehyde (Lovejoy et
al., 1993) for tax- onomic analysis. Chlorophyll a
was extracted in 95%
ethanol at
60
◦
C
(Nusch, 1980) and
quantified
by spec-
trophotometry at 480, 663 and 750 nm. Samples were
then acidified for phaeophytin correction. Pigment
con-
centrations were calculated using Goltermann’s
(1971) equation.
Ash-free-dry-weight
was determined
by dry-
ing the samples for 24 h at
80
◦
C
followed by combus-
tion in a
muffle
furnace at
500
◦
C
for 2 h (see review
by
Aloi, 1990).
Samples for diatom analysis were cleaned using a
mixture
of 1:1
sulphuric
and
nitric acid
and
mounted
on slides
with
Naphrax
(Pienitz
et
al.,
1995).
Diatoms
were then identified and counted with a Zeiss
Axiovert 10
inverted microscope at 1000× magnification. A mini-
mum of 400 valves were enumerated for each sample
(Prygiel and Coste, 1993). Diatom
identifications
were based mainly on Krammer and Lange-Bertalot
(1986,
1988, 1991a, b).
Analysis of variance (ANOVA; SIGMASTAT
ver- sion 2.03) was used to assess differences in
periphytic biomass between the three types of
substrates studied in the Boyer River from May to
August 1999. Data were tested for deviations from
normality and homo- geneity of variance, and
transformations were made if necessary to fulfil the
assumptions for ANOVA.
Effects of agricultural development
For the main study,
artificial substrates
were
scraped for biomass and taxonomic analyses after a 4
wk incu- bation (mid-July to mid-August 1999).
Chlorophyll a,
AFDW
and
diatom community
structure
were analysed following the above methods.
The total algal commu- nity structure (diatoms and
non-diatom taxa) was also analysed in order to
evaluate if this broader analysis of all algal
components would add information beyond that
provided by the observations on the diatom com-
munity. The overall benthic algal
community
was
anal- ysed by FNU microscopy (Lovejoy et al., 1993)
and by calculating the biovolume (Kirschtel, 1993;
Hillebrand
et al., 1999) of each taxon. Non-diatom algae identifi-
cations were based mainly on Smith (1950),
Bourrelly (1966a, 1966b, 1970), Prescott (1970) and
Findlay and Kling (1979a, b).
Multivariate statistical analyses for the evaluation
of benthic algal community structure at each site were
conducted using CANOCO version 4.0 (ter Braak and
S
ˆ
milauer, 1998). Data were tested for deviations
from normality and
transformations
were made if
necessary. Diatom species were included in
ordinations if they made up >1% in at least 2 sites.
Taxa for the overall benthic
community
were
included in the analyses if the biovolume was >1% in
at least one site.
Detrended correspondence analysis (DCA)
was
first used to determine the maximum amount of
variation in the diatom species data and the overall
benthic al- gal data. The results (3.0 SD and 4.1 SD
respectively for the first axis) suggested that a test
based on a uni- modal response model was most
appropriate. Canoni- cal
correspondence
analysis
(CCA) was therefore used to observe relationships
between diatom community structure and water
quality variables. All diatom taxa were square-root
transformed in order to reduce the influence of the
most abundant species, whereas rare species were
downweighted. Environmental variables with
variance inflation factors >5 (as in Winter and
Duthie, 2000a) were not used in the analysis because
of their
multicolinearity.
A forward selection (based
on t
-tests) was then conducted to identify the variables
that each explained
significant
directions of variance
in the distribution of the taxa. The statistical
significance of the relationship between algal taxa
and environmental variables was evaluated using
Monte Carlo permuta- tion tests (199 random
permutations; p < 0.05).
Results
Substrate comparison
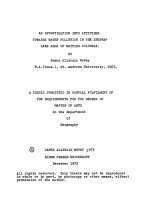
Periphyton biomass measured as Chl a and AFDW
fluctuated
greatly during the sampling season, ranging
from 0.77 µg cm
−
2
to 26 µg cm
−
2
Chl a and from 3
to
79 g m
−
2
AFDW on all substrates (Figure 2). Two-
way
ANOVA of Chl a and AFDW showed a highly
signif- icant influence of the sampling date on
biomass vari-
ation (Chl a:
F
(5
,
36)
= 151.42, p < 0.001 and AFDW:
F
(5
,
36)
= 98.67, p < 0.001) and showed that there were
no significant differences between the three types of
substrates (Chl a:
F
(2
,
36)
=
2.08, p
=
0.14 and AFDW:
F
(2
,
36)
= 1.32, p
=
0.28). However,
the
interaction
term
was significant (Chl a:
F
(10
,
36)
= 6.52, p < 0.001 and
AFDW:
F
(10
,
36)
= 3.04, p = 0.007), indicating that
Figure 2. Periphytic biomass expressed as ash-free-dry-weight (upper graph) and Chl a (lower graph) on natural, sterile and artificial
substrates in the Boyer River, 1999.
substrate type
did
influence
the
strength
of the
temporal
variation.
Some data did not respect
normality
after be- ing transformed. However, as
noted by Scheffe´ (1959) and Montgomery (2001),
ANOVAs are relatively in- sensitive to moderate
deviations from normality and
Land use analyses
Mean values for the physico-chemical variables at
each site are shown in Table 2 and land use
information
is shown in Table 3. Conductivity, TN, NH
+
-N, NO
−
-
4 3
this deviation is unlikely to affect the major effects
ob-
served here. Previous studies on lake epiphytic algae
have shown that 5 to 6 independent replicates may be
necessary
for
periphyton biomass estimation
to
address certain questions (Cattaneo et al., 1993). Our
analysis of triplicate variability in the present study
showed that the
coefficients
of variation for natural,
sterile and arti-
ficial
substrates were 21%, 17% and
23%, respectively,
for Chl
a
analysis and 30%, 17%
and 23%,
respectively, for AFDW, giving an
adequate degree of resolution for enrichment effects.
Diatom community structure also fluctuated
markedly throughout the course of the 3 mo of sam-
pling (Lavoie et al., 2003). The ANOVA conducted
on diatom community structure (percent total number
of valves for the six dominant species) showed the
major influence of sampling date and the minor
influence of substrate type. Different treatments
explained, on aver- age, less than 2% of the total
variance while the contri- bution of
sampling
date
averaged
more than 42% of the
total variance (Table 1). Log 10 or
√
arcsin
transforma-
tions were necessary in order to respect
normality.
N,
TP, TDP, SRP,
pH,
SS
and
turbidity
were
all
markedly
and
significantly
lower at the reference sites (Table
4). Total phosphorus and TN values ranged from
0.02 to
0.53 mg l
−
1
and from 0.21 to 4.75 mg l
−
1
respectively.
The
mean
TP
was
0.02
mg
l
−
1
(at
the
detection
limit)
for
the reference sites and 0.19 mg l
−
1
for the agricultural
sites and the mean TN was 0.275 mg l
−
1
for the refer-
ence sites and 1.56 mg l
−
1
for the
agricultural sites.
The
waters were typically alkaline with pH values up to
8.7 and conductivity ranging from 24.6 to 1120 µS
cm
−
1
.
A Pearson correlation matrix showed that there were
only a few significant relationships between land use
and water quality, notably conductivity (Table 5). All
forms of P were highly correlated with conductivity.
Total nitrogen and
NH
4
+
-N were also correlated with
conductivity. Animal density was positively
correlated with conductivity, TN,
NH
4
+
-N, TP,
suspended solids
and turbidity while % beef cattle, % hog and %
poultry had no significant relationship with physico-
chemical variables. Percent cropped area, % row
crop, % small grains and % corn crop were positively
correlated with nutrients and conductivity.
Table 1. Summary of ANOVA statistics for the evaluation of substrate and date of sampling effect in the Boyer River.
Taxa Substrate Effect Sampling Date Effect Interaction Term
Cymbella sinuata F = 0.5
p = 0.63
0.4% of total variance
Nitzschia spp. F = 2.3
p = 0.12
0.99% of total variance
Navicula seminulum F = 0.4
p = 0.65
0.5% of total variance
Navicula cryptocephala F = 2.1
p = 0.14
1.8% of total variance
Navicula saprophila F = 17.4
p < 0.001
7.4% of total variance
subminuscula
F
=
3
.
0
9
p
=
0
.
0
6
5.8%
variance
F = 38.6
p < 0.001
74% of total variance
F = 76.6
p < 0.001
84% of total variance
F = 22.9
p < 0.001
69% of total variance
F = 34.6
p < 0.001
75% of total variance
F = 76.0
p < 0.001
81% of total variance
F = 8.88
p < 0.001
42% of total variance
F = 3.07
p = 0.006
Interaction
F = 3.27
p = 0.004
Interaction
F = 1.47
p = 0.191
No interaction
F = 1.76
p = 0.104
No interaction
F =
2.02
p =
0.06
No interaction
F = 1.92
p = 0.075
No interaction
4
9
Table 2. Mean physico-chemical values and mean Chl a and AFDW concentrations at the 29 sites during the period of sampling (mid-July to mid-August 1999).
Site
DOC
(mg C
l
−
1
)
COND
(µS
cm
−
1
)
Total-N
(mg N
l
−
1
)
NH
3
(mg N
l
−
1
)
NO
3
-N
(mg N
l
−
1
)
SRP
(mg P
l
−
1
)
Total-P
(mg P
l
−
1
)
TDP
(mg P
l
−
1
) pH
SS
(mg
l
−
1
)
TEMP
(˚C)
TUR
(NTU)
AFDW
(g
m
−
2
)
Chl
a
(µg
cm
−
2
)
1 9.2 293.5 1.95 0.04 1.67 0.07 0.15 0.09 8.1 39.5 20.1 23.7 25.7 3.2
2 12.3 235.0 1.16 0.06 0.85 0.07 0.15 0.11 8.2 14.8 18.2 7.3 3.6 3.5
3 8.7 304.0 3.04 0.02 2.85 0.08 0.13 0.10 8.2 8.3 17.3 3.8 33.6 8.8
4
∗
6.3 40.9 0.36 0.02 0.14 0.01 0.02 0.01 7.2 2.8 15.0 0.8 1.1 5.6
5 10.0 217.0 0.52 0.05 0.13 0.02 0.06 0.03 8.2 7.0 21.8 4.9 14.1 2.2
6 10.9 350.2 1.35 0.06 0.95 0.10 0.19 0.14 8.7 9.8 25.5 4.6 16.1 0.2
7 12.4 525.0 1.00 0.04 0.56 0.06 0.14 0.08 8.5 13.3 24.3 4.1 6.8 1.6
8 5.3 480.0 4.75 0.04 4.50 0.28 0.34 0.33 8.5 5.0 15.9 1.6 23.0 36.9
9
∗
8.8 99.0 0.31 0.02 0.05 0.01 0.02 0.01 7.6 3.2 21.0 1.3 10.1 0.5
10 5.0 252.6 0.61 0.04 0.38 0.01 0.04 0.01 8.1 7.8 23.7 3.0 4.6 0.9
11 11.2 211.0 0.87 0.05 0.39 0.03 0.09 0.06 8.1 5.5 23.0 2.4 23.8 4.0
12 11.1 212.0 0.84 0.07 0.26 0.06 0.13 0.09 8.1 8.3 23.2 4.2 17.1 1.7
13 10.8 682.5 2.12 0.05 1.62 0.13 0.19 0.16 8.4 11.8 26.5 4.8 4.8 0.7
14 8.3 577.5 1.50 0.07 0.99 0.03 0.17 0.05 8.2 45.0 24.3 20.6 23.4 2.8
15 11.3 640.0 1.65 0.08 1.03 0.21 0.30 0.26 8.3 23.0 23.3 12.3 9.8 3.7
16 8.3 1045.0 3.38 0.96 1.68 0.31 0.53 0.38 8.1 33.3 24.0 21.3 3.9 3.6
17 7.9 967.5 0.48 0.05 0.03 0.09 0.14 0.13 8.3 3.5 23.5 2.3 13.7 0.8
18 9.5 401.5 0.51 0.02 0.04 0.14 0.23 0.18 8.0 6.8 24.6 2.5 12.3 2.3
19 4.0 145.5 0.32 0.02 0.13 0.08 0.10 0.09 8.7 8.0 22.1 0.7 28.5 1.6
20 14.0 717.5 0.86 0.12 0.48 0.37 0.51 0.46 8.3 18.0 23.8 10.3 9.0 1.8
21
∗
6.4 24.6 0.21 0.02 0.02 0.01 0.02 0.01 7.0 1.8 22.4 0.8 9.3 0.6
22 6.1 288.6 0.91 0.10 0.44 0.04 0.10 0.05 8.0 26.3 21.0 14.5 17.0 12.4
23 5.3 380.6 1.00 0.05 0.70 0.03 0.09 0.04 7.9 25.0 19.0 14.7 1.1 0.4
24
∗
4.8 33.7 0.22 0.02 0.02 0.01 0.02 0.01 7.1 2.0 20.3 0.4 4.6 0.4
25 10.3 535.0 3.00 0.11 2.54 0.03 0.09 0.04 7.8 31.0 20.3 23.5 28.9 10.6
26 4.4 725.0 4.20 0.74 2.56 0.25 0.36 0.29 7.8 16.5 18.5 5.4 27.6 8.0
27 5.7 1120.0 1.34 0.05 1.03 0.09 0.20 0.12 8.1 21.8 19.3 9.0 12.3 2.3
28 3.8 477.5 1.06 0.03 0.80 0.04 0.07 0.05 8.0 4.8 18.7 2.0 16.4 5.2
29 5.1 550.0 0.55 0.03 0.17 0.14 0.16 0.16 8.2 4.4 19.4 2.1 8.3 3.2
∗
Reference
sites.
50
Lavoie et al. / Aquatic Ecosystem Health and Management 7 (2004) 43–
58
Table 3. Land use information for the catchments upstream of each sampling site.
Site
Pop.
1996
M.A.
(ha)
C.A.
%
R.C.
%
S.G.
%
C.C. F.
% %
A.D.
a.u. ha
−
1
B.C. H. P.
% % %
1 6550 21049 52 5 11 4 35 1.58 54 41 4
2 454 2089 43 2 11 1 29 1.23 72 22 4
3 415 2410 67 7 16 6 44 1.98 43 53 2
4
∗
426 9974 2 0 0 0 1 1.19 57 39 2
5 15500 70029 26 3 3 3 20 3.06 36 59 4
6 2969 15717 38 7 3 7 27 4.57 27 67 6
7 504 2147 66 21 4 21 41 5.56 27 61 12
8 432 3771 23 1 2 1 20 2.48 41 51 8
9
∗
3450 99605 4 0 1 0 3 1.10 83 9 0
10 11535 34646 37 7 4 6 25 1.23 79 18 0
11 43213 144923 35 14 3 12 18 2.05 34 58 6
12 1591 10856 32 13 2 11 17 2.79 25 70 4
13 3015 16313 66 41 8 34 17 1.80 27 60 12
14 4252 12861 60 39 5 30 13 3.48 10 71 18
15 2587 8588 67 44 7 35 16 1.63 57 39 3
16 18602 26387 64 44 6 29 12 0.75 48 42 7
17 21423 36583 71 55 5 35 11 0.32 71 11 14
18 10112 51244 40 24 3 12 12 0.58 83 7 7
19 58 425 42 17 3 11 21 0.77 83 6 3
20 4969 21632 40 27 3 9 9 0.44 74 5 15
21
∗
821 6227 11 0 3 0 7 0.67 90 0 5
22 40993 63673 22 13 3 7 6 1.34 21 66 9
23 9837 21917 48 28 5 19 14 1.21 27 62 8
24
∗
436 66694 0 0 0 0 0 1.34 43 16 33
25 6676 7055 38 18 8 7 11 0.46 73 13 9
26 2997 2481 69 49 6 32 14 0.66 39 45 4
27 12804 35851 38 16 6 11 15 1.76 29 15 55
28 795 2699 83 47 10 32 25 0.87 37 58 4
29 529 1721 71 47 6 29 17 0.69 38 48 4
∗
Reference
sites. Pop
=
total human resident population in the catchment in 1996; (M.A.)
=
municipal area in
hectare; (% C.A.)
=
% cropped area; (% C.C.)
=
% corn crop; (% F.)
=
% forage; (% R.C.)
=
% row crops; (%
S.G.)
=
% small grains; (A.D.) = animal density in animal units per hectare; (% B.C.) = % beef cattle; (% H.) = %
hog and (% P.) = % poultry.
Benthic algal colonisation varied markedly from
site to site, with biomass ranging from 1.1 g m
−
2
to
33.6 g m
−
2
AFDW and from 0.2 µg cm
−
2
to 36.9
µ
g
cm
−
2
Chl a. The agriculturally impacted sites had a
mean of 15.4 g m
−
2
AFDW (SD = 9.3) and 4.9
µ
g
cm
−
2
Chl a (SD = 7.4) compared with 6.3 g m
−
2
AFDW (SD
=
4.2) and 1.8 µg cm
−
2
Chl a (SD
=
2.5) for the reference sites. Chl a was correlated with
temperature,
NO
3
-N, TN and % cropped area (r =
−0.515, p < 0.01; r = 0.765, p < 0.005; r = 0.684, p
< 0.005 and r
=
0.667, p < 0.005, respectively). Ash
free dry weight was correlated with
NO
3
-N (r
=
0.495,
p < 0.01).
Community composition was also very different
among the sampling sites, with diatom biovolume
ranging from 5% to 98% (mean = 55.6%; SD =
30.6) of the total benthic algal community. The most
abundant non-diatom taxa expressed as biovolume
were Scenedesmus spp., cf. Serratus sp., filamen-
tous chlorophytes and a pigmented 5 µm flagel-
late. In terms of cell concentrations, the cyanobac-
terium Leptolyngbya was abundant. The most
abundant species of diatoms at the agriculturally
influenced sites were Cocconeis placentula,
Cocconeis pedicu-
lus, Cyclotella meneghiniana,
Navicula
cryptocephala, Navicula lanceolata and
Surirella brebissonii. At the
3
4
Table 4. Water quality conditions at the reference (unimpacted) and agricultural sites. Nutrient values are
in mg
l
−
1
, conductivity in µS cm
−
1
and suspended sediments in mg
l
−
1
. The significance of differences
between the two types of sites was determined by Mann-Whitney Rank Sum Test.
Unimpacted Sites Agricultural Sites Rank Test
Mean Range Mean Range p-value
Conductivity 49.55 74.4 493.36 974.5
∗∗∗
pH 7.23 0.6 8.19 0.9
∗∗∗
Suspended solids 2.45 1.4 15.94 41.5
∗∗∗
Total-N 0.275 0.15 1.559 4.43
∗∗∗
NO
−
-N 0.058 0.12 1.071 4.47
∗∗
NH
+
-N
0.02
∗
0.0 0.118 0.94
∗∗
Total-P
0.02
∗
0.0 0.186 0.49
∗∗∗
SRP
0.01
∗
0.0 0.11 0.36
∗∗∗
∗
detection
limit,
∗∗
p
< 0.01,
∗∗∗
p
<
0.005.
reference sites, Achnanthes minutissima sp.1, Fragi-
laria capucina and Brachysira neoexilis were more
common. Deleting rare species reduced the number in
the
subsequent multivariate analyses
from 171 to 61
for diatom data and from 151 to 93 for the overall
com- munity data. All samples were used in the
CCAs. A list of species seen in this study may be
obtained by application to I. Lavoie.
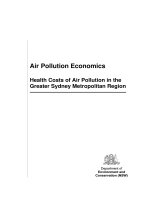
The first CCA analysis was performed using only
water quality data. The CCA identified pH, conduc-
tivity and suspended solids as variables that each ex-
plained significant (p < 0.05) and independent direc-
tions of variance in the diatom data. The eigenvalues
of CCA axis 1 (0.48) and axis 2 (0.23) were similar
to those for DCA (0.57 and 0.27), indicating that the
physico-chemical variables used accounted for most
of the diatom species variance. The first two axes for
environmental variable ordination explained 82.7% of
the variance in diatom
community
structure,
indicating that pH, conductivity, and suspended solids
accounted for the major gradients in the diatom
community
struc- ture. The cumulative percentage of
variance in species distribution was 28%. These
values of variance ex- plained by environmental
variables or species distribu- tion are slightly higher
than the range
commonly
found in the literature (e.g.,
Fallu and Pienitz, 1999; Winter and Duthie, 2000a).
The first axis was highly corre- lated with pH,
indicating that this variable is important for site and
species distribution (Figure 3). Site and species
distribution showed a clear separation between the
four
reference
sites and the rest of the agriculturally
impacted sites.
Another CCA analysis was performed to include
all water quality variables as well as land use data for
each
sampling site. Adding land use characteristics did not
increase the percentage of variance explained and pH,
conductivity, and suspended solids were still the only
variables that each explained
significant
(p < 0.05)
and independent directions of variance in the diatom
data (not shown).
Since reference sites and farming sites were prin-
cipally separated by the pH gradient, we conducted
another CCA without the reference sites in an at-
tempt to obtain a better distribution among the farm-
ing sites as a function of land use and water quality.
The only
significant
variable that remained in the
ordi- nation was suspended solids. The cumulative
percent- age of variance in species distribution was
8.7% (not shown). The site ordination excluding the
reference sites showed a more even distribution, but
grouping as a function of agriculture type or intensity
was still not evident.
The results obtained by conducting a CCA on the
overall benthic algal community were similar to those
obtained for the benthic diatom data. The four
reference sites were clearly separated from the
agriculturally im- pacted sites and no grouping as a
function of farming type was observed (Figure 4).
The only variable that explained significant variance
(p < 0.05) in the data was conductivity. The
variance explained by the taxa distribution was 6%.
Discussion
Substrate comparison
Previous studies using artificial substrates for peri-
phyton colonisation have led
to
divergent views
on
their
0.653
∗∗∗
0.038 1
% B.C.
−0.177 −0.002 −0.155 −0.267 −0.209 −0.066 −0.326 −0.195 1
% H. 0.155
−0.051
0.056 0.313 0.162 0.137 0.302 0.348
−
0.883
∗
% P. 0.086 0.117 0.03 −0.1 0.033 −0.118 0.016 −0.233 −0.287
DOC 0.067 0.126 −0.133 0.219 −0.074 0.105 −0.047 0.238 −0.001
COND
0.090
−0.278
0.596
∗∗∗
0.211
0.83
∗∗∗
0.264
0.774
∗∗∗
0.034
−0.137
Total-N
−0.108 −0.341
0.521
∗∗∗
0.339 0.196 0.388 0.194 0.245
−0.227
NH
3
0.162
−0.073
0.638
∗∗∗
0.328 0.406 0.067
0.375
∗
−0.136 −0.128
NO
3
-N
−0.191 −0.365
0.35 0.349 0.032
0.442
∗
0.039 0.342
−0.201
SRP
−0.177 −0.333
0.254 0.274 0.33 0.075 0.249 0.081 0.063
Total-P
−0.019 −0.261
0.41
∗
0.11
0.484
∗∗
0.177
0.401
∗
0.041
−0.113
TDP
−0.088 −0.227
0.217
0.392
∗
0.452
∗
0.058
0.379
∗
0.007 0.026
pH 0.054
−
0.202 0.044 0.148 0.29 0.262 0.334
0.592
∗∗∗
−
0.254
SS 0.159
−
0.173
0.462
∗
0.098
0.244 0.332 0.233 0.059
−0.299
TEMP 0.233 0.206
−
0.03
0.962
∗∗∗
0.273
−0.195
0.326
−0.018 −0.045
TUR 0.209
−
0.117
0.484
∗∗
0.147
0.184 0.344 0.144 0.001
−0.223
% R.C. 0.056
−0.254
0.542
∗∗∗
% S.G.
−0.176
−
0.421
∗
0.277
% C.C. 0.031
−0.251
0.452
∗
Table 5. Pearson correlation matrix for the relationships among physico-chemical variables and land use data. See Table 3 for the
definition of abbreviations.
Pop. M.A. A.D. % C.A. % R.C. % S.G. % C.C. % F. % B.C.
∗∗
% H. % P. DOC COND Total-N NH
3
NO
3
-N RSP Total-P
1
0.491
∗∗
1
0.557
∗∗
0.546 1
0.334
0.958
∗∗∗
0.301 1
0.611
∗∗∗
0.573
∗∗∗
0.535
∗∗∗
0.47
∗∗
1
0.717
∗∗∗
0.582
∗∗∗
0.664
∗∗∗
0.435
∗
0.898
∗∗∗
1
0.674
∗∗∗
0.491
∗∗
0.537
∗∗∗
0.366
0.945
∗∗∗
0.93
∗∗∗
pH 0.329
−0.086
0.329
0.434
∗
0.238 0.006 0.252
0.387
∗
0.414
∗
SS 0.198 0.255 0.186 0.359 0.34 0.365 0.277 0.142
0.43
∗
TEMP
−0.045
0.25
0.46
∗
0.292
−0.282
0.11
−
0.373
∗
0.045 0.159
TUR 0.105 0.296 0.211 0.339 0.328 0.349 0.274 0.11
0.392
∗
TDP pH SS TEMP TUR
TDP
1
pH
0.397
∗
1
SS 0.193 0.175
1
TEMP 0.193 0.353
0.181 1
TUR 0.148 0.098
0.962
∗∗∗
0.147 1
∗
p
< 0.05,
∗∗
p
< 0.01,
∗∗∗
p
< 0.005.
Figure 3. Canonical correspondence analysis biplots showing diatom species scores (a) and sample scores (b) as well as significant (p
<
0.05) and independent (variance inflation factor <5) environmental variables.
Figure 4. Canonical correspondence analysis biplots showing the overall taxa scores (a) and sample scores (b) as well as significant (p
<
0.05) and independent (variance inflation factor <5) environmental variables.
ability to reproduce natural conditions. Tuchman and
Stevenson (1980) found that sterilised rocks and clay
tiles represented the natural community poorly and in
a
comparative
study of lakes of differing trophic
status, Ellis et al. (2001) found that the nature of the
substrate
(glass, wood, plastic) considerably affected
the patterns of colonisation of periphytic algae.
Similarly, Leland and Porter (2000) and Hill et al.
(2000) have shown the
influence
of natural substrate
type on benthic algae assemblages. These results
contrast with a review on the use of artificial
substrates for benthic algal studies which suggests
that choice of material is not crucial and that any
substrate-induced variations are less im- portant than
those introduced by trophy, temperature and the time
available for colonisation (Cattaneo and
Amireault,
1992). Eulin and Le Cohu (1998) compared
periphytic algae on natural and artificial (mica schist)
substrates and also concluded that the
specific
compo-
sition of communities did not show significant differ-
ences between the two substrates studied.
The experiment in the Boyer River showed that
the type of ceramic tiles chosen for the present study
(unglazed with good surface rugosity) provided a rea-
sonable analogue to rocky substrates. Since the pur-
pose of the experiment was to evaluate the use of
algae as an indicator of farming activity, the use of
artifi- cial substrates eliminated any potential effect
of differ- ent surfaces or substrate geochemistry.
These effects, however, may be small relative to
those
associated
with differences in water quality.
The use of artificial sub-
strates substantially
increased
the
logistic difficulties
of sampling and it
may be preferable to select sites where there are
natural rocky substrates for sampling.
Land use effects on benthic algal biomass
and community structure
Benthic algal Chl a was correlated with TN,
NO
3
-N and temperature while AFDW was correlated
with
NO
3
-N. However, the correlation analyses
sug- gest that the periphyton community structure
was pri- marily influenced by pH, conductivity and
suspended solids. This result is consistent with that
of Mosisch et al. (1999) who found that periphyton
biomass ac- crual under unshaded conditions was N-
limited (most agriculturally impacted sites in this
study were un- shaded). In our experiment, benthic
algal biomass was uncorrelated with P, again
consistent with the study of Mosisch et al. (2001)
who found that P-enrichment appeared to have no
positive effect on periphyton ac- crual. The lack of
any biomass-phosphorus relation- ship suggests that
P is not a limiting element for ben-
thic algal growth in the streams and rivers sampled
in this study and that the ecological impact of P- and
N-loading from agricultural sources is very different.
Phosphorus-loading results
in
higher biomass
of
plank- tonic algae in fresh water (Correll, 1998),
while our data suggest a greater
influence
of N-
loading (or a cor- relate of TN and nitrate) on benthic
agal biomass. This would imply that excess N cycles
mostly through the benthic foodweb, while excess P
may have a greater
influence
on the plankton. The
ecological impact of N- and P-loading is also likely
to differ in terms of spa- tial scale, since excess
production of planktonic algae will be exported
further and faster in lotic ecosystems than excess
production of benthic algae. Thus, the im- pact of N-
versus P-loading on the structure and func- tion of
freshwater ecosystems
will differ markedly. It is also
possible that the turnover rates for N and P differ
substantially, with much faster recycling rates
(shorter nutrient spiral length sensu Wetzel, 2002) for
P. This suggests that analyses of N rather than P
would provide a more accurate guide to the overall
nutrient status of the stream.
The results obtained from CCA showed that pH,
conductivity
and
suspended
solids
were
the
most
signif- icant environmental variables explaining
species com- position and the ordination of sites.
Canonical corre- spondence analyses clearly
separated reference sites from the overall farming
sites indicating that the spe-
cific composition
of
diatoms
and total algal community
responded
strongly
to these two
disparate
sets of condi-
tions.
Diatom community structure
in
farming sites
and
reference
sites was
principally distributed
along the
pH gradient. Excluding the reference sites from the
CCA analysis showed that pH was no longer a
significant variable and that suspended solids was the
most impor- tant variable explaining the farming site
distribution. The pH values in agriculturally
influenced
streams had a tendency to be higher,
possibly related to farming practices but also to the
soil type in which agricultural activities are localised.
Our more detailed studies on the overall benthic
al- gal community added substantially to the total
analysis time due to difficulties in identifying all
algal groups and
differentiating
viable
diatom
frustules,
that
is,
those with cellular content. It did
not, however, add any sig- nificant information
beyond our analyses restricted to the total diatom
community. The large additional ef- fort required for
a full community analysis does not therefore seem
justified in future work, except where there are
specific
water quality issues such as unsightly
Cladophora growth or geosmin production by
benthic cyanobacteria that can taint water supplies.
Other studies have shown the importance of con-
ductivity (Biggs, 1990; Leland and Porter, 2000;
Munn et al., 2002) and pH (Pan et al., 1996) for algal
com- munity composition in streams and rivers. The
results of Hill et al. (2000) provide another example
where N and P were not significant environmental
variables for evaluating the use of periphyton
assemblage data as an index of biotic integrity. As
hypothesised by Pan et al. (1996), regression and
calibration models based on P and diatoms may not
be as robust and predictable for P-enriched rivers and
streams as they are for lakes. However, reliable
models evaluating diatom response to TN and TP
have been developed (e.g., Pan et al.,
1996; Leland and Porter, 2000; Winter and Duthie,
2000a;
Munn
et
al.,
2002).
The
lack
of
a
relationship
be-
tween
diatom
species
and
N
and
P
observed
in
this
study could also reflect our distribution of sites. We
found that almost all our sites clustered together at
the highly enriched end of the gradient, and were far
separated from the four unimpacted sites. The
inclusion of inter-
mediate levels
of
enrichment would
likely have
allowed a more sensitive analysis of
nutrient effects on diatom community structure.
In our multivariate analyses, traditional nutrient
measurements (P and N concentrations) did not ex-
plain a significant part of the variance in the species-
specific composition among different sites. However,
TN,
NH
4
-N and all
forms
of P as well as pH were
corre- lated to conductivity (Table 5). An increase in
conduc- tivity can be associated with erosion and
runoff loaded with major ions. Phosphorus and
nitrate are also af-
fected
by
the extent
of
runoff and
soil erosion.
Turbidity (suspended solids) could also
be linked to P and nitrate since erosion (responsible
for a higher turbidity) leads to a loss in soil and
nutrient-rich organic matter. We thus conclude that
pH, conductivity and SS measure- ments were better
integrative guides of water quality in these
agriculturally impacted ecosystems than specific
nutrient variables.
The results showed
a
clear difference in diatom
com- munity structure between the farming and
reference sites (Figures 3 and 4). However, contrary
to our hy- pothesis and even with the ordination of
sites accord- ing to species composition along
conductivity and SS gradients, no grouping was
observed as a function of farming type or intensity.
For example, sites 8 and 28 were very close to each
other in the site ordination as a function of diatom
community (Figure 3), but land use for those 2 sites
was very different (Table 3). Site
8 was characterised by a low percentage of cultivated
area (23%) and a high animal density (2.48 a.u.
ha
−
1
)
while site 28 had a high percentage of cultivated area
(83%) and a low animal density (0.9 a.u.
ha
−
1
). The
dominant crop and livestock production also differed
between sites 8 and 28. Moreover, some sites that had
similar land use characteristics also had very different
diatom community structure, such as sites 19 and 25
(Figure 3 and Table 3). These results suggest that lo-
cal farming practices such as soil tillage, presence of
a buffer zone, ecological agriculture and crop type as
well as geological properties of each site have a
strong over-riding influence on water quality
properties and periphyton community structure.
Discharge is another major
physical
variable
(not
measured
in
this
study)
that might have influenced the
community composition of the benthic algae (Biggs
et al., 1998a, b, 1999; Lavoie et al., 2003). The rivers
varied in size from meters to tens of meters in width.
However, despite this variabil- ity all of the
agricultural sites clustered within a single highly
impacted group. This substantial separation of all
farming sites from the reference sites draws atten-
tion to the strong impact of agriculture in this region
irrespective of intensity and farm type. In part this
may reflect differences in geology given that
agriculture in this region is primarily within regions
on sedimentary bedrock and flood plain soils, while
our unimpacted sites included two on the Canadian
Shield. However, the magnitude of this separation
implies that there is a need for substantial
improvements in environmen- tal management in the
agricultural catchments of this region to achieve any
shift in water quality towards natural baseline
conditions.
In many European countries, water quality moni-
toring is routinely and effectively achieved using bi-
ological indices based on benthic diatoms. For exam-
ple, the Czech SLA diatom index was developed by
Sla´decˇek (1986) to evaluate saprobity levels
(degree of organic
enrichment).
The French Polluo-
Sensitivity- Index (Coste, 1982) and the French
Biotic Diatom Index (Lenoir and Coste, 1996) were
developed to evaluate general stream water quality.
Similarly, the English Trophic Diatom Index (Kelly
and Whitton,
1995) and the German trophic index (SHE; Steinberg
and Schiefele, 1998) were
developed
and applied to
as- sess stream trophic status. The present study and
other work in Canada also show the potential of
diatom com- munities as an indicator of water quality
(this study; Reavie and Smol, 1998; Vis et al., 1998;
Winter and Duthie, 2000a, b, c; Winter and Duthie,
2001; Belore et al., 2002; Wunsam et al., 2002).
However, there are no quantitative indices currently
in use in water quality monitoring programs in
Canada. This study suggests that conductivity, pH
and suspended solids are ma- jor variables that
separate
community
structures across
environmental gradients. Further work is required to
study the potential of diatoms as biological indicators
of water quality on a broader array of
impacted
streams that are more evenly distributed across
gradients of nu- trient enrichment, and to develop
indices that would be easily integrated within routine
water
management
and monitoring strategies.
Acknowledgements
We wish to thank the Direction du suivi de
l’environnement of the Que´bec Ministry of the
Envi- ronment for water quality analyses as well as
for their help and constant interest in the project. We
also thank the Centre
d’E
´
tudes Nordiques for
equipment and lo- gistic support. Thanks to Karine
Bonneville for field assistance and Dr. K.M. Somers,
Dr. S. Campeau, and Dr. M A. Fallu for advice on
statistical analyses. This project was funded by FCAR
and NSERC.
References
Aloi, J., 1990. A critical review of recent freshwater periphyton
field methods. C. J. Fish. Aquat. Sci. 47, 656–670.
Belore,
M.,
Winter,
J.,
Duthie,
H.,
2002.
Use of
diatoms
and
macroin- vertebrates as bioindicators of water quality in
Southern Ontario rivers. Can. Wat. Res. J. 27, 457–484.
Biggs, B., 1990. Periphyton communities and their environments in
New Zealand rivers. N. Z. J. Mar. Freshwat. Res. 24, 367–386.
Biggs, B., Goring, D., Nikora, V., 1998a. Subsidy and stress
responses
of stream periphyton to gradients in water velocity as a
function of community growth form. J. Phycol. 34, 598–607.
Biggs, B., Stevenson, R., Lowe, R., 1998b. A habitat matrix con-
ceptual model for stream periphyton. Archiv
fu¨
r Hydrobiol.
143,
21–56.
Biggs, B., Smith, R., Duncan, M., 1999. Velocity and sediment
disturbance of periphyton in headwater streams, biomass and
metabolism. J. N. Am. Benth. Soc. 18, 222–241.
Bourrelly, P., 1966a. Les Algues d’Eau Douce, Initiation a` la
Syste´matique. Tome I: Les Algues Vertes.
E
´
ditions N.
Boube´e et Cie, Paris.
Bourrelly, P., 1966b. Les Algues d’Eau Douce, Initiation a` la
Syste´matique. Tome II: Les Algues Jaunes et Brunes.
E
´
ditions N. Boube´e et Cie, Paris.
Bourrelly, P., 1970. Les Algues d’Eau Douce, Initiation a` la Syste
´matique. Tome III: Les Algues Bleues et Rouges.
E
´
ditions N.
Boube´e et Cie, Paris.
Cattaneo, C., Amireault, M., 1992. How artificial are artificial sub-
strata for periphyton? J. N. Am. Benth. Soc. 11, 244–356.
Cattaneo,
C.,
Legendre,
P.,
Niyonsenga,
T., 1993.
Exploring
periphy- ton unpredictability. J. N. Am. Benth. Soc. 12, 418–
430.
Correll, D., 1998. The role of phosphorus in the eutrophication of
receiving waters: A review. J. Environ. Qual. 27, 261–266.
Coste, M., 1982.
E
´
tude des me´thodes biologiques d’appre
´ciation
quantitative de la qualite´ des eaux. Rapport Q. E. Lyon A.
F. Bassin
Rhoˆ
ne-Me´dite´rane´e-Corse,
CEMAGREF.
Ellis, R., Neish, B., Trett, M., Best, J., Weightman, A., Morgan,
P., Fry, J., 2001. Comparison of usefulness of three types of
artifi- cial substrata (glass, wood and plastic) when studying
settlement patterns of periphyton in lakes of different trophic
status. J. Mi- crobiol. Meth. 45, 167–170.
Eulin, A., Le Cohu, R., 1998. Epilithic diatom communities dur-
ing the colonization of artificial substrates in the River
Garonne (France). Comparison with the natural communities.
Archiv
fu¨
r Hydrobiol. 143, 79–106.
Fallu, M A., Pienitz, R., 1999. Lacustrine diatoms from Jamesie-
Hudsonie (Quebec)
and
reconstituted
model of
dissolved
organic carbon. Ecoscience 6, 603–620.
Findlay, D., Kling, H., 1979a. A species list and pictoral reference
to
the phytoplankton of central and northern Canada-Part I.
Fish-
eries
and
Marine
Service
Manuscript
Report
No.
1503,
Manitoba.
Findlay, D., Kling, H., 1979b. A species list and pictoral reference
to
the phytoplankton of central and northern Canada-Part II.
Fish-
eries
and
Marine
Service
Manuscript
Report
No.
1503,
Manitoba.
Goltermann, H., 1971. Methods for Chemical Analysis of
Fresh-
waters. IBP Handbook no. 8, H. Goltermann (ed.).
Blackwell
Scientific.
He´bert, S., 1999. Qualite´ des eaux du
fleuve
St-Laurent,
1990–
1997.
Ministe`re de l’Environnement, Direction des e´cosyste`mes
aqua- tiques. Que´bec. 38 pp and 4 appendices.
Hill, B., Herlihy, A., Kaufmann, P., Stevenson, R., McCormick,
F.,
Johnson,
C.,
2000. Use
of
periphyton assemblage data
as an
index of biotic integrity. J. N. Am. Benth. Soc. 19, 50–67.
Hillebrand,
H.,
Du¨
rselen,
C D.,
Kirschtel,
D.,
Pollingher,
U.,
Zohary, T., 1999. Biovolume calculation for pelagic and
benthic microal- gae. J. Phycol. 35, 403–424.
Kelly, M., Whitton, B., 1995. The Trophic Diatom Index: A new
index for monitoring eutrophisation in rivers. J. Appl. Phycol.
7,
433–444.
Kirschtel, D., 1993. BIOVOL Program. Dept. Bot., Marsh Life-
Science Building, Univ. Vermont, Burlington, VT, U.S.A
Krammer, K., Lange-Bertalot, H., 1986. Bacillariophyceae.1. Teil:
Naviculaceae. In: H. Ettl, G. Ga¨rtner, J. Gerloff, H.
Heynig, D. Mollenhauer (Eds.),
Su¨
β
wasserflora von
Mittleuropa, Band
2/1. Gustav Fischer Verlag, Stuttgart/New
York.
Krammer, K., Lange-Bertalot, H., 1988. Bacillariophyceae.
2.
Teil: Bacillariaceae, Epithemiaceae, Surirellaceae. In: H. Ettl,
J. Gerloff, H. Heynig, D. Mollenhauer (Eds.),
Su¨
β
wasserflora von Mittleuropa, Band 2/2 Gustav Fischer Verlag,
Stuttgart/ New York.
Krammer, K.,
Lange-Bertalot,
H., 1991a.
Bacillariophyceae.
3.
Teil:
Centrales, Fragilariaceae, Eunotiaceae.
In: H. Ettl, J.
Gerloff, H.
Heynig,
D.
Mollenhauer (Eds.), Su¨
β
wasserflora
von
Mittleuropa, Band 2/3. Gustav Fischer Verlag,
Stuttgart/Jena.
Krammer, K., Lange-Bertalot, H., 1991b. Bacillariophyceae.
4.
Teil: Achnanthaceae, Kritische
Erga¨
nzungen zu Navicula
(Li- neolatae und Gomphonema). In: H. Ettl, J. Gerloff, H.
Heynig, D. Mollenhauer (Eds.),
Su¨
β
wasserflora von
MittleuropA, Band
2/4. Gustav Fischer Verlag,
Stuttgart/Jena.
Kutka, F., Richards, C., 1996. Relating diatom assemblage struc-
ture to stream habitat quality. J. N. Am. Benth. Soc. 15, 469–
480.
Lavoie, I., Vincent, W., Pienitz, R., Painchaud, J., 2003. Effet du
de´bit sur la dynamique temporelle des algues pe´riphytiques
dans une rivie`re
influence´e
par les activite´s agricoles. Rev.
des Sci. de l’Eau 16, 55–77.
Leland, H., Porter, S., 2000.
Distribution
of benthic algal in the
upper Illinois River basin in relation to geology and land use.
Freshwat. Biol. 44, 279–301.
Lenoir, A., Coste, M., 1996. Development of a practical diatomic
index of overall water quality applicable to the French National
Water Board Network. In: B.A. Whitton, E. Rott (Eds.), Use of
Algae for Monitoring Rivers II, pp. 29–43. Institut
fu¨
r
Botanik, Universita¨t Innsbruck, Austria.
Lovejoy, C., Vincent, W., Frenette, J J., Dodson, J., 1993.
Microbial gradients in a turbid estuary: Application of a new
method for protozoan community analysis. Limnol. Oceanogr.
38, 1295–
1303.
Lowe, R., Pan, Y., 1996. Benthic algal communities as biological
monitors. In: M. L. Bothwell, R. L. Lowe (Eds.), Algal
Ecology: Freshwater Benthic Ecosystems, pp. 705–739.
Academic Press, San Diego, CA.
Mattila, J., Raeisaenen, R., 1998. Periphyton growth as an
indicator of
eutrophication;
an
experimental approach.
Hydrobiologia
377,
15–23.
McCormick, P., Stevenson, R., 1998. Periphyton as a tool for eco-
logical assessment and management in the Florida Everglades.
J. Phycol. 34, 726–733.
Montgomery, D., 2001. Design and Analysis of Experiments,
5th edition. John Wiley & Sons, Inc. New York.
Mosisch,
T.,
Bunn,
S.,
Davies,
P.,
Marshall,
C.,
1999. Effects
of
shade and nutrient manipulation on periphyton growth in a
subtropical stream. Aquat. Bot. 64, 167–177.
Mosisch, T., Bunn, S., Davies, P., 2001. The relative importance
of shading and nutrients on algal production in subtropical
streams. Freshwat. Biol. 46, 1269–1278.
Munn, M., Black, R., Gruber, S., 2002. Response of benthic algae
to environmental gradients in an agriculturally dominated land-
scape. J. N. Am. Benth. Soc. 21, 221–237.
Nusch, E., 1980. Comparison of different methods for chloro-
phyll and phaeopigment determination. Ergebn. Limnol. 14,
14–
36.
Painchaud, J., 1997. La qualite´ de l’eau des rivie`res du Que
´bec: e´tat et tendances. Ministe`re de l’Environnement et de la
Faune, Direction des e´cosyste`mes aquatiques.
Pan, Y., Stevenson, R., Hill, B., Herlihy, A., Collins, G., 1996.
Using diatoms as indicators of ecological conditions in lotic
systems: A regional assessment. J. N. Am. Benth. Soc. 15,
481–495.
Pienitz, R., Smol, J., Birks, H., 1995. Assessment of freshwater di-
atoms as quantitative indicators of pas climate change in the
Yukon and Northwest Territories, Canada. J. Paleolim. 13,
21–
49.
Potapova, M., Charles, D., 2003. Distribution of benthic diatoms
in U.S. rivers in relation to conductivity and ionic composition.
Freshwat. Biol. 48, 1311–1328.
Prescott, G., 1970. Algae of the Western Great Lakes Area. Wm. C.
Brown Co. Publishers, Iowa.
Prygiel, J., Coste, M., 1993. Utilisation des indices
diatomiques
pour la mesure de la qualite´ des eaux du bassin Artois-
Picardie: Bilan et perspectives. Ann. Limnol. 29, 255–267.
Reavie, E., Smol, J., 1998. Epilithic diatoms of the St. Lawrence
River and their relationships to water quality. Can. J. Bot. 76,
251–257.
Rott,
E.,
Duthie,
H.,
Pipp,
E.,
1998. Monitoring organic pollution
and
eutrophication
in the Grand River, Ontario, by means of
diatoms. Can. J. Fish. Aquat. Sci. 55, 1443–1453.
Scheffe´, H., 1959. The Analysis of
Variance.
John Wiley & Sons,
Inc.
New York.
Skinner, J., Lewis, K., Bardon, K., Tucker, P., Catt, J., Chambers,
B.,
1997. An overview of the environmental impact of agriculture
in the U. K. J. Environ. Manage. 50, 111–128.
Sla´dec˘ek, V., 1986. Diatoms as indicators of organic pollution.
Acta
Hydrochim. Hydrobiol. 14, 555–566.
Smith, G., 1950. The Fresh-Water Algae of the United States.
2nd edition. McGraw-Hill Book Co. Inc., New York.
Steinberg, C., Schiefele, S., 1988. Biological indication of trophy
and pollution of running waters. Z. Wasser-Abwasser-
Forsch.
21, 227–234.
ter Braak, C.,
S
ˆ
milauer, P., 1998. CANOCO Reference Manual
and User’s Guide to Canoco for Windows: Software for
Canoni- cal Community Ordination (version 4).
Microcomputer Power, Ithaca, NY, USA.
Tuchman, M.,
Stevenson,
J., 1980.
Comparison
of clay tile,
sterilized rock and natural substrate diatom communities in a
small stream in southeastern Michigan, USA. Hydrobiologia
75, 73–79.
Vis, C.,
Cattaneo,
A.,
Pinel-Alloul,
B., 1998.
Periphyton
as an
indica- tor of water quality in the St. Lawrence River (Quebec,
Canada). Environm. Pollu. 101, 13–24.
Wetzel, R., 2002. Limnology: Lake and River Ecosystems, Third
edition, Academic Press, New York.
Winter, J.,
Duthie,
H.,
2000a.
Epilithic
diatoms
as
indicators
of
stream total N and total P concentration. J. North Am. Benth.
Soc. 19,
32–49.
Winter,
J.,
Duthie,
H.,
2000b. Stream biomonitoring
at an
agricultural test site using benthic algae. Can. J. Bot. 78, 1319–
1325.
Winter, J., Duthie, H., 2000c. Stream epilithic, epipelic and
epiphytic diatoms: Habitat fidelity and use in biomonitoring.
Aquat. Ecol.
34, 345–353.
Winter, J., Duthie, H., 2001. Relating benthic diatom community
structure to nutrient loads and water quality in Southern
Ontario streams. Verhand. Internat. Verein. Limnol. 27, 3902–
3906.
Wunsam, S., Cattaneo, A., Bourassa, N., 2002. Comparing diatoms
species, genera and size in biomonitoring: A case study from
streams in the Laurentians (Que´bec, Canada). Freshwat.
Biol.
47, 325–340.