Optimization of Cost by Using 7 QC Tools docx
Bạn đang xem bản rút gọn của tài liệu. Xem và tải ngay bản đầy đủ của tài liệu tại đây (167.77 KB, 12 trang )
International Journal of Engineering Studies
ISSN 0975- 6469 Volume 1, Number 3 (2009), pp. 149–160
© Research India Publications
Optimization of Cost by Using 7 QC Tools
Nitin K. Mandavgade¹ and Santosh. B. Jaju²
Department of Mechanical Engineering, G. H. Raisoni College of Engineering,
CRPF Gate No.3, Digdoh Hills, Hingna Road, Nagpur 440016 (India).
1
E-mail: and
2
E-mail:
Abstract
Quality plays very important role in today’s highly competitive industrial
environment. Quality leads to an improvement in productivity. By improving
quality, the method of optimization reduces process operational costs and
variation in product. Quality, productivity & cost of operation relatively
depended to each other. The main goals of quality management are customer
satisfaction by delivery of defect free products at quality cost. Controlled
processes are the most important ways to reach this goal. The primary
objective of quality control in any organization is to reduce the costs of its
operation. If control efforts do not lead to any saving in costs or cost reduction
then, in principle there is no need for quality control. However, in most control
activities, cost saving are real and they remain a principle objective of quality
control for most organizations.
Keywords: Quality, quality control, cost optimization, inspection.
Introduction to quality control
Many companies in the world are gradually promoting quality as the central customer
value and regard it as a key concept of company strategy in order to achieve the
competitive edge. Quality improvement decisions are viewed as the catalyst for
substantial technological developments being made in the manufacturing sector.
Quality Costs are a measure of the costs specifically associated with the achievement
or non-achievement of product or service quality –including all product or service
requirements established by the company and its contract with customers and society.
Measuring and reporting the quality cost is the first step in a quality management
program. Quality costs allow us to identify the soft targets to which improvement
efforts can be applied.
150 Nitin K. Mandavgade and Santosh. B. Jaju
Three types of cost are generally associated with quality control:
1. Assignment costs.
2. Prevention costs.
3. Non-conformance costs.
Assignment costs are the cost which an organization incurs in measuring quality
characteristics to ensure that they conform to quality standards. This cost typically
includes costs of inspection including labour , materials, and cost of approval or
certification when organizations meet quality standards and so on. Prevention costs
involve cost when organizations undertake measures to prevent poor quality of
products or performance. Example of prevention cost would include the costs
associated with quality planning, design and development of quality measurement
instruments, quality training and so on. Finally non conformance costs also called
failure costs occur when an organization fails to meet quality standards. This may be
due to poor quality of labour, materials and overhead, i.e. expenses accumulated.
Seven Quality Control Tools
The various tools are used to check the quality of the product to define weather the
product is a quality one or not and to take the further necessary actions to bring the
process under control.
• Check sheet
• Pareto chart
• Flow chart
• Cause and effect diagram
• Histogram
• Scatter diagram
• Control chart
Check sheet
The function of a check sheet is to present information in an efficient, graphical
format. This may be accomplished with a simple listing of items. However, the utility
of the check sheet may be significantly enhanced in some instances by incorporating a
depiction of the system under analysis into the form.
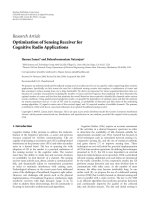
Pareto Chart
Pareto charts are extremely useful because they can be used to identify those factors
that have the greatest cumulative effect on the system and thus screen out the less
significant factors in an analysis.
Ideally, this allows the user to focus attention on a few important factors in a
process.
Optimization of Cost by Using 7 QC Tools 151
Figure 1: Pareto Chart.
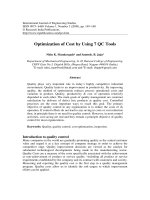
Flowchart
Flowcharts are pictorial representations of a process. By breaking the process down
into its constituent steps, flowcharts can be useful in identifying where errors are
likely to be found in the system. In quality improvement work, flowcharts are
particularly useful for displaying how a process currently functions or could ideally
function.
Figure 2: Flowchart.
152 Nitin K. Mandavgade and Santosh. B. Jaju
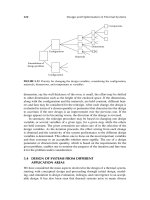
Cause and Effect Diagram
This diagram, also called an Ishikawa diagram (or fish bone diagram) is used to
associate multiple possible causes with a single effect. Thus, given a particular effect,
the diagram is constructed to identify and organize possible causes for it.
Figure 3: Cause and effect Diagram.
Causes in a cause & effect diagram are frequently arranged into four major
categories. While these categories can be anything, given below:
• Manpower, methods, materials, and machinery (recommended for
manufacturing)
• Equipment, policies, procedures, and people (recommended for administration
and service).
Histogram
A histogram is a specialized type of bar chart. Individual data points are grouped
together in classes, so that you can get an idea of how frequently data in each class
occur in the data set. Histograms provide a simple, graphical view of accumulated
data.
Optimization of Cost by Using 7 QC Tools 153
Figure 4: Histogram.
Scatter Diagram
Scatter diagrams are graphical tools that attempt to depict the influence that one
variable has on another. A common diagram of this type usually displays points
representing the observed value of one variable corresponding to the value of another
variable.
Figure 5: Scatter Diagram.
Control Chart
The control chart is the fundamental tool of statistical process control as it
indicates the range of variability that is built into a system (known as common
cause variation). Thus, it helps determine whether or not a process is operating
154 Nitin K. Mandavgade and Santosh. B. Jaju
consistently or if a special cause has occurred to change the process mean or
variance.
Problem: Optimization of cost by using 7 quality control tools.
Step1:-Introduction to the problem
In operation 67 of control valve cylinder head (as shown in Figure 6) of the diameter
15.840/15.862 mm was getting oversize.
Figure 6: Control Valve Cylinder Head.
Background of problem selection:-
This problem was selected because in-house rejection was alarming and also
product returned from the line at vendor (automotive industry in central India) was
repeated time to time (refer figure 7 & 8). Total rejections in house are 10 units and
product returned is 16 units.
Figure 7: Line rejection.
Critical area
Line Rejection Trend Op67 Dia 15.840/15.862mm in CVCH
3
2
5
33
00000000
0
2
4
Months
No of parts rejected
month wise
Nos
3253300000000
JULY AUG SEP OCT NOV DEC JAN
Optimization of Cost by Using 7 QC Tools 155
Figure 8: In House rejections.
Problem Selected:-Elimination of rejection due to diameter 15.840/15.862 mm
which was getting oversize.
Target: - Zero defects in diameter 15.840/15.862 mm of Operation 67.
Step 2:- Observation
Information regarding process and operation are observed.
(1) Operation done on vertical milling machine.
(2) All the tools are operated like 14.68 mm drill hole, mill to correct the axis &
then reamer.
(3) Rigid clamping fixture.
(4) This is operated after the operation 50 done. In solid stage without putting on
any machine.
(5) Tool change frequency decided for every operation as discussed.
(6) Coolant used for reaming is kerosene or solvent 2445.
(7) Variable type gauging i.e. Air plug Gauge is used for in-process inspection of
this reamed bore with 1 in 5 inspection frequency.
Step 3:- Identification of Probable Causes:- Probable causes are identified and
represented in the form of cause and effect diagram as shown in figure 9.
In-House Rejection Trend Op67 Dia 15.840/15.862mm in CVCH
11
2
33
00
0
2
4
Months
No of parts rejected month wise
Nos
1123300
JULY AUG SEP OCT NOV DEC JAN
156 Nitin K. Mandavgade and Santosh. B. Jaju
Figure 9: Identification of probable causes.
Step 4: Brainstorming
The most probable causes (Identified by cause and effect diagram and Brainstorming)
Cause1: Insufficient knowledge of operator.
Cause2: Hardness inconsistency in raw material.
Cause3: Intermittent supply of coolant.
Cause4: Tool run out not checked before putting on the machine & after the part
detected oversize.
Analysis done to test the validity of probable causes
Cause1:Test1: Insufficient Knowledge of operator.
Observation:-After interviewing the machine operator it was confirmed that they are
having adequate operating and inspection knowledge.
Also, there was standard operating procedure available near the machine which
were regularly followed
Result: In valid cause for the problem.
Cause 2: Test 1: hardness less in rejected components
Specification 179 to 229 BHN.
Actual observation; 189,198,182,192,194.
Also, hardness of 5 ok components were checked and it was observed that
hardness was with in specification.
Actual observation: 190,195,192,185,198.
Result: In valid cause for the problem.
Cause 3: Test 1: Intermittent supply of coolant
Observation: To get the proper finish kerosene or solvent 2445 is applied
continuously to the reamer to avoid the chip rubbing & proper cutting.
Optimization of Cost by Using 7 QC Tools 157
Result: Invalid caused for the problem
Since all most probable causes were found invalid, focus was shifted to other
causes.
Cause 4: Tool run out not checked before putting the tool on the machine.
Observation: to know the reason for rejection, the tool was checked for the run out
but found with in 10 microns.
Result: Invalid cause for the problem.
Why the rejected parts were oversize in between?
For this we have checked the run out of the tool when the part was rejected. After
analyzing the problem after deep studies that the raw material is grey cast iron. For
machining of cast iron does not need any coolant, it may be cut in dry condition. As in
our case also, the operation for drilling and hole milling kept as in dry cutting
condition. As the property of the cast iron is to produce dust with small flakes of chip,
such dust get fly off along with current air by the fans put in the shop floor & get
accumulated every where. In-due course of time this dust get accumulated on the BT
40 taper of the tool holder & causes to have run out in the tool. As the tool run out
increase the bore to become oversize.
Result: Valid cause for the problem.
Step 5:- counter measure:
Short term:
• Instruction was given to all the operators & the officials about the valid cause
of the size for getting over size.
• Part checking frequency was changed from 1in 5 to 100% in process
inspection.
Long term:
• All the taper of the tools & the spindle to be clean after every 12 hours.
• Air connection was given through the spindle to blow off the dust in the
spindle taper for accumulating it.
Step 6:- Implementation of countermeasure:
All the action are implemented at once.
Step 7:- Standardization:
Standard operating procedure for operation 67 update. Standard operating procedure
for operation 67 was revised by putting these important points.
Step 8:- Direct benefit:
Cost saving as no internal rejection for the same reason.
Result: After implementation no Problem was observed from the last 3 months.
158 Nitin K. Mandavgade and Santosh. B. Jaju
Cost analysis
Raw Material i.e. casting is given by automotive industry from Approved Vendor M/S
CASPRO LTD, Kolhapur.
Costs-
• Raw material Cost : Rs.248/piece.
• Machining Cost : Rs.200/piece.
• Total costs : Rs.448 /Piece.
Various consumables costs for Operation 67-
Tooling costs Description-
Sr.
No.
Tools Materials Cots in
Rs
Life in
parts
Costs
1 Combination drill HSS 1200 4000 0.3
2 Milling cutter Carbide 1750 6000 0.29
3 Drill dia 14.5 mm Solid carbide 8500 30,000 0.28
4 Hole mill Solid carbide 8500 30,000 0.28
5 Grooving HSS 650 1000 0.65
6 Reaming Carbide 1250 20,000 0.0625
Total tooling costs/ piece 1.86
Tool holder cost: Rs. 3000
3000*6 (for above six operation) = Rs. 18,000
1.5 lakh is the life of the tool holder so the cost of tool holder per piece is
18000/150000= Rs. 0.12 /piece.
lubricant cost:-
SAE20W40 IS USED.
5 LIT. Tank per shift.
Rs125/lit.
5*125 = Rs625/shift.
90 Parts are produced in one shift.
652/90 = Rs6.94/piece.
Coolant cost: - Kerosene is used as coolant in order to improve the surface finish &
to avoid the corrosion.
5 lit require per shift.
Rs35/lit
35*5=Rs175/shift.
90 Parts are produced in one shift.
175/90=Rs.0.50/piece
Cotton waste: It is approximately Rs0.10/piece
Optimization of Cost by Using 7 QC Tools 159
Cleaning Agents: solvent 2445 is used as coolant. 10 lit require per day.
Rs 65/lit, Rs 650 /day, 650/300= Rs.2.16 /piece
Inspection cost
1. Gauging Cost: It is approximately Rs2/piece.
2. Inspector Cost: The salary paid to the inspector is Rs.5000/month.He works
for 26 days in one month. So the money paid by the company for 1 day = 5000/26=
Rs192/day.He inspect approximately 300 parts in 1 day.
Cost for inspecting one piece = 192/300 = Rs0.64/piece.
Machining Cost
Labour Cost
The salary paid to the labour (machine operator) is Rs3500/month.He works for 26
days in one month. So the money paid y the company for 1 day = 3500/26=
Rs134/day.He produce a 90 parts in 1 day. Cost for producing one piece =
134/90=Rs.1.49/piece
Machine Depression Cost
Generally there is 10-15% depression cost, But machine are in maintained condition
so there is only 10% depression cost in 1 year.
Cost of machine is Rs18 lakh. If we consider for 5 years 180000/5 = Rs3.6lakh
180000-36000=RS 144000 in 5 years.
For 1 year = 30,000/year.
For 1 month =30,000/12=Rs. 2500/month.
For 1 day = 2500/26=Rs. 96/day.
For 1 part = 96/270parts in one day=Rs.0.35/piece.
Total Cost Associated In Operation 67 =
All cost associated in tooling + all cost associated Inspection cost + machining cost +
Raw material cost.
Total cost=0.3+0.29+0.28+0.28+0.65+0.0062+0.12+6.95+0.5+0.10+2.16+2.00+0.64
+1.49+0.35+248 = Rs.264.116 / piece in op67
There are 3 to 4 Parts are rejected due to diameter 15.840/15.862mm over size in
1 month.
Costs saved per month = 264.116 *4 = Rs 1056.46 /month
Cost saved per year = 1056.46*12 =Rs 12,677.57/ year
Conclusion
Quality leads to an improvement in productivity. Quality, productivity & cost of
operation relatively depended to each other. The main goals of quality management
are customer satisfaction by delivery of defect free products at quality cost. In
operation 67 of control valve cylinder head (as shown in Figure 6) of the diameter
160 Nitin K. Mandavgade and Santosh. B. Jaju
15.840/15.862 mm was getting oversize. We have studied the problems and actually
solved the problem by using seven quality control tools which result in good amount
of saving in cost of product and overall reputation of the company get improved.
References
[1] Company manual.
[2] Chaddha, R., 1999, “Quality costs and financial performance: A pilot study,”
IE Journal, Vol. XXVIII, No. 5, pp19-25.
[3] Jaju, S.B., Shrivastava, R.L., and Lakhe, R.R., 2003, “Performance Analysis
through quality costs: a case study,” Industrial Engineering Journal, Vol.
XXXIII, No.6, June 2004, pp 15-20.
[4] Jaju, S. B., Lakhe, R. R. and Bhagade, S. S., 2007, “Mathematical
Interrelationships among Quality Cost Categories for a Manufacturing Sector”
Industrial Engineering Journal, Vol. XXXVI, No.3 March 2007 pp 32-41.
[5] Juran J. M., 1974, Quality Control Handbook, McGraw Hill, New York.
[6] Roden, S., and Dale, B.G., 2001, “Quality costing in a small engineering
company: Issues and difficulties,” The TQM Magazine, Vol. 13, No.6, pp388-
399.
Appendix
0.001
LTC 20
3 D.C. NO. QTY. 1000.0000
MM
1 2 34567 8
SAMPLE D2 A2 D4
15.851 15.853 15.852 15.848 15.852 15.865 15.842 15.849 1 1.123 2.560 3.270
15.849 15.852 15.860 15.852 15.880 15.842 15.848 15.851 2 1.128 1.880 3.270
15.851 15.852 15.852 15.880 15.851 15.853 15.866 15.853 3 1.693 1.020 2.570
15.849 15.852 15.852 15.842 15.853 15.850 15.840 15.851 4 2.059 0.730 2.230
15.842 15.853 15.852 15.849 15.852 15.848 15.842 15.853 5 2.326 0.590 2.110
15.851 15.853 15.86 15.88 15.88 15.865 15.866 15.853 Xmax.= 15.8800
15.842 15.852 15.852 15.842 15.851 15.842 15.84 15.849 Xmin.= 15.8400
0.009 0.001 0.008 0.038 0.029 0.023 0.026 0.004
= 0.01490 4 NOS.
15.8484 15.8524 15.8536 15.8542 15.8576 15.8516 15.8476 15.8514
= 15.8514 0 NOS.
0.0362
FREQ. CU. FREQ.
5 15.8066 15.8147 0 0
0.000400 15.8147 15.8228 0 0
15.8228 15.8309 0 0
15.86019 15.86019 15.8602 15.8602 15.8602 15.8602 15.86019 15.8602 15.8309 15.8390 0 0
15.8426 15.8426 15.8426 15.8426 15.8426 15.8426 15.8426 15.8426 15.8390 15.8471 8 8
0.0314 0.0314 0.0314 0.0314 0.0314 0.0314 0.0314 0.0314 15.8471 15.8552 37 45
0.0000 0.0000 0.0000 0.0000 0.0000 0.0000 0.0000 0.0000 15.8552 15.8633 1 46
15.8514 15.8514 15.8514 15.8514 15.8514 15.8514 15.8514 15.8514 15.8633 15.8714 2 48
0.0149 0.0149 0.0149 0.0149 0.0149 0.0149 0.0149 0.0149 15.8714 15.8795 0 48
15.8795 15.8876 2 50
15.8876 15.8957 0 50
M4 V ALUE
15.8957 15.9038 0 50
0
1
2
3
4
NO.OF DECIMALS:
L.T.L
0.00780
15.860191
U.T.L.
15.84
15.862
NO. OF PARTS ABOVE U.T.L. =
Interval = Selecting no. of classes =
1.10000
Shift Of '
' from 'D' =
29/10/08
STATISTICAL PROCESS CONTROL STUDY
AGROFAB MACHINERIES ( I ) PVT.LTD
W119/120 M.I.D.C. HINGNA RIOAD NGP.
L.COUNT:APG
1.05000
U.C.L.
={
+A2x
}
L.C.L.
={
-A2x
}
U.C.L.
={
x D4}
L.C.L.
={
x D3}
15.84261
0.031439
0
0.0401 Specification Width(S) = 0.0221
INTERVAL
NO.OF NON CONFORMING PART =
ALL DIMENSIONS ARE IN INCHES / MM
R.G.KINHIKAR
15.8390 No. of readings= 50.0000
PROCESS NEEDS CORRECTION ,Cp & Cpk SHOULD BE >=1.33
Cp=(S/6σ)=
Cpk={1-K}xCp)=
INSTRUMENT:
SPECIFIC:
OPERATION:
.CYLINDER HEAD
50
MACHINE:
A 0051315D01
0.0001
4
Std.Dev."σ"=
SUPPLIER
15.8510
15.840/15.862
OP67
NOS.
0.0100
0.0010
MINIMUM DECIMAL VALUE
1.0000
0.1000
Index (K)={2 x (D-
) / S}=
0.008100
NO. OF PARTS BELOW L.T.L. =
8
39015.847115.855215.863315 .871415.879515.887615.895
7
8
30915.839015.847115.855215 .863315.871415.879515.887
6
HISTOGRAM
15.83
15.835
15.84
15.845
15.85
15.855
15.86
15.865
1
2
3
4
5
6
7
8
9
10
8 -CHART
A
V
G
.
0
0.01
0.02
0.03
0.04
1
2
3
4
5
6
7
8
9
10
2-CHART
R
A
N
G
…