DATABASE SYSTEMS (phần 11) pot
Bạn đang xem bản rút gọn của tài liệu. Xem và tải ngay bản đầy đủ của tài liệu tại đây (1.49 MB, 40 trang )
388
I
Chapter
12 Practical
Database
Design
Methodology
and
Use of UML Diagrams
represented as a rectangle
with
two small rectangles or tabs overlaid
on
its left side. An
interface is a group of operations used or created by a
component
and is usually represented
by a small circle. Dependency relationship is used to model
the
relationship between two
components is represented by a
dotted
arrow pointing from a
component
to
the
component
it depends on. For databases,
component
diagrams stand for stored data such as tablespaces
or partitions. Interfaces refer to applications
that
use
the
stored data.
D.
Deployment
Diagrams
Deployment
diagrams represent
the
distribution of
components
(executables, libraries,
tables, files) across
the
hardware topology.
They
depict
the
physical resources in a system,
including nodes,
components
and
connections,
and
are basically used to show the
configuration of
run-time
processing elements
(the
nodes)
and
the
software processes that
reside
on
them
(the
threads).
Now
we will describe
the
behavioral diagrams
and
expand
on
those
that
are of
particular interest.
E.
Use
Case
Diagrams
Use
case diagrams are used to model
the
functional interactions
between
users and the
system. A
scenario
is a sequence of steps describing an
interaction
between
a user and a
system. A
use
case is a set of scenarios
that
have
a
common
goal.
The
use case diagram
was introduced by Jacobson
7
to visualize use cases.
The
use case diagram shows actors
interacting
with
use cases
and
can
be understood easily
without
the
knowledge of any
notation.
An
individual use case is
shown
as an oval
and
stands for a specific task
performed by
the
system.
An
actor,
shown
with
a stick person symbol, represents an
external
user,
which
may be a
human
user, a representative group of users, a
certain
role of
a person in
the
organization, or
anything
external
to
the
system.
The
use case diagram
shows possible interactions of
the
system
(in
our case, a database system)
and
describes as
use cases
the
specific tasks
the
system performs. Since they do
not
specify any
implementation
detail
and
are very easy to understand,
they
are a good vehicle for
communicating
between
the
end
users
and
developers
and
help
in easier user validation
at an early stage. Test plans
can
also be easily generated using use cases diagrams.
Figure
12.7 shows
the
use case diagram
notation.
The
include
relationship is used to factor out
some
common
behavior from two or more of
the
original use cases - it is a form of
reuse.
For example, in a university
environment
shown
in Figure 12.8,
the
use cases "register for
courses"
and
"enter
grades" in
which
actors
student
and
professor are involved, include a
common
use case called "validate user." If a use case incorporates two or more
significantly different scenarios, based
on
circumstances or varying conditions,
the
extend
relationship is used to show
the
subcases
attached
to
the
base case (see Figure 12.7)
Interaction
diagrams.
Interaction diagrams are used to model the dynamic
aspects of a system.
They
basically consist of a set of messages exchanged between a set
of Objects.
There
are two types of interaction diagrams, Sequence and Collaboration.
7. See Jacobson et at. (1992)
12.3 Use of UML Diagrams as an Aid to
Database
Design Specification I
389
«include»
~:o
Included Use Case
«include»
Use Case
«extend»
.>
0
Extended Use Case
Actor_3
FIGURE
12.7 The use-case diagram notation.
F.
Sequence
Diagrams
Sequence
diagrams describe
the
interactions
between
various objects over time.
They
basically
give a dynamic view of
the
system by showing
the
flow of messages between
objects.
Within
the
sequence diagram, an object or an actor is
shown
as a box at
the
top
ofadashed vertical line,
which
is called
the
object's lifeline. For a database, this object is
typically
something physical (like a
book
in
the
warehouse)
that
would be
contained
in
thedatabase, an
external
document
or form such as an order form, or an external visual
screen
which may be
part
of a user interface.
The
lifeline represents
the
existence of
object
over time.
Activation,
which
indicates
when
an object is performing an action, is
represented as a rectangular box
on
a lifeline. Each message is represented as an arrow
between
the
lifelines of
two
objects. A message bears a
name
and
may
have
arguments
and
control information to explain
the
nature
of
the
interaction.
The
order of messages is
read
from top
to
bottom. A sequence diagram also gives
the
option
of self-call,
which
is
390
I Chapter 12 Practical Database Design
Methodology
and Use of UML Diagrams
~:o
Validate User
«include»
«include»
~ +Q
Apply for Aid A
~ +l
Register for Course
Student
Professor
Financial Aid
Officer
FIGURE
12.8
An example use case diagram for a University Database.
basically just a message from an object to itself.
Condition
and
Iteration
markers
can
also
be
shown
in sequence diagrams to specify
when
the
message should be
sent
and to
specify
the
condition
to send multiple markers. A
return
dashed line shows a
return
from the
message
and
is
optional
unless it carries a special meaning.
Object
deletion is shown with
a large X. Figure 12.9 explains
the
notation
of
the
sequence diagram.
G.
Collaboration
Diagrams
Collaboration
diagrams represent interactions
between
objects as a series of sequenced
messages. In
Collaboration
Diagrams
the
emphasis is
on
the
structural organization of the
objects
that
send
and
receive messages whereas in Sequence Diagrams
the
emphasis ison
the
time-ordering of
the
messages.
Collaboration
diagrams show objects as icons and
number
the
messages;
numbered
messages represent an ordering.
The
spatial layout of
collaboration diagrams allows linkages
among
objects
that
show
their
structural
relationships. Use of collaboration
and
sequence diagrams to represent interactions isa
matter
of choice; we will hereafter use only sequence diagrams.
H.
Statechart
Diagram
Statechart
diagrams describe
how
an object's state changes in response to external events.
To describe
the
behavior of an object, it is
common
in most object-oriented
techniques to draw a state diagram to show all
the
possible states an object
can
get into in
12.3 Use
of
UML
Diagrams as an
Aid
to Database Design Specification I 391
ObjectClass or
Actor
o
I
I
Lifetime
ObjectClass or
Actor
o
I
I
message
ObjectClass or
Actor
o
I
I
,
,
,
Message to Self
Focus of Control/Activation
I
I
I
I
I
I
I
I
r
-:-
0
*
,-
,-
,-
,-
,-
,-
,-
Object
DeconstructionlTermination
FIGURE
12.9
The sequence diagram notation.
itslifetime.
The
UML
state
charts
are based
on
David
Harel's8 statecharts.
They
basically
show
a
state
machine
consisting of states, transitions,
events
and
actions
and
are very
useful
in
the
conceptual
design of
the
application
that
works against
the
database of
stored
objects.
The
important
elements
of a
statechart
diagram
shown
in Figure 12.10 are as follows.
• States:
shown
as boxes
with
rounded
corners,
represent
situations in
the
lifetime of
an object.
• Transitions:
shown
as solid arrows
between
the
states,
they
represent
the
paths
between
different
states
of
an
object.
They
are
labeled
by
the
eventname
[guard]
faction;
the
event
triggers
the
transition
and
the
action
results from it.
The
guard
is an
additional
and
optional
condition
that
specifies a
condition
under
which
the
change
of
state
may
not
occur.
• Start/Initial
State:
shown
by a solid circle
with
an outgoing arrow to a state.
• Stop/Final
State:
shown
as a
double-lined
filled circle
with
an arrow
pointing
into
it
from a state.
8.
See
Hare! (I987).
392
I Chapter 12 Practical Database Design
Methodology
and Use
of
UML
Diagrams
Start/Initial State
State
State 3
transition
State 2
State consists of
three parts
•
Stop/Accepting/
Final State
Name
dol Action
"
"
"
"
"
Name
Activities
Embedded Machine
Activities and Embedded
Machine are optional
FIGURE 12.10 The statechart diagram notation.
Statechart
diagrams are useful in specifying
how
an object's
reaction
to
a
message
depends
on
its state.
An
event
is
something
done
to
an
object
such
as being sent a
message;
an
action
is
something
that
an
object
does
such
as
sending
a message.
I.
Activity
Diagrams
Activity
diagrams
present
a
dynamic
view
of
the
system by
modeling
the
flow of control
from activity to activity.
They
can
be considered as flowcharts
with
states.
An
activity isa
state
of
doing
something,
which
could
be a real-world process or
an
operation
on
some
class in
the
database. Typically,
activity
diagrams are used to
model
workflow
and
internal
business
operations
for an application.
12.3 Use of UML Diagrams as an Aid to Database Design Specification I 393
12.3.4 A
Modeling
and
Design
Example: University
Database
Inthis section we will briefly illustrate
the
use of
the
UML
diagrams we presented above
to
design
a sample relational database in a university setting. A large
number
of details are
left
out to conserve space; only a stepwise use of these diagrams
that
leads towards a con-
ceptual
design
and
the
design of program
components
is illustrated. As we indicated
before,
the
eventual
DBMS
on
which
this database gets
implemented
may be relational,
object-oriented or object-relational.
That
will
not
change
the
stepwise analysis
and
mod-
eling
of the application using
the
UML
diagrams.
Imagine a scenario
with
students enrolling in courses
which
are offered by professors.
Theregistrar's office is in charge of
maintaining
a schedule of courses in a course catalog.
They
have
the
authority to add
and
delete courses
and
to do schedule changes.
They
also
set
enrollment limits
on
courses.
The
financial aid office is in charge of processing
student's
aid applications for
which
the
students
have
to apply. Assume
that
we
have
to
design
a database
that
maintains
the
data
about
students, professors, courses, aid, etc. We
also
want to design
the
application
that
enables us
to
do
the
course registration, financial-
aid
application processing,
and
maintaining
of
the
university-wide course catalog by
the
registrar's
office.
The
above requirements may be depicted by a series of
UML
diagrams as
shown
below.
As mentioned previously
one
of
the
first steps involved in designing a database is to
gather
customer requirements
and
the
best way to do this is by using use case diagrams.
Suppose
one of
the
requirements in
the
University Database is to allow
the
professors to
enter
gradesfor
the
courses they are
teaching
and
for
the
students to be able to register for
courses
and apply for financial aid.
The
use case diagram corresponding to these use cases
can
bedrawn as
shown
in Figure 12.8.
Another helpful
thing
while designing a system is to graphically represent some of
the
states
the
system
can
be in.
This
helps in visualizing
the
various states
the
system
can
be in during
the
course
of
the
application.
For example, in our university database
the
variousstates
which
the
system goes
through
when
the
registration for a course
with
50
seats is
opened
can
be
represented
by
the
statechart
diagram in Figure 12.11.
Note
that
it shows
the
states of a course while
enrollment
is in process. During
the
enrolling
state,
the "Enroll
Student"
transition
continues
as long as
the
count
of enrolled
students
is less
than
50.
Now having made
the
use case
and
state
chart
diagram we
can
make a sequence
diagram
to visualize
the
execution
of
the
use cases. For
the
university database,
the
sequence
diagram corresponding to
the
use case:
student
requests to register
and
selects a
particular
course
to
register is
shown
in Figure 12.12.
The
prerequisites and course
capacity
are
then
checked
and
the
course is
then
added to
the
student's schedule if
the
prerequisites
are
met
and
there
is space in
the
course.
The above
UML
diagrams are
not
the
complete
specification of
the
University
database.
There
will be
other
use cases
with
the
Registrar as
the
actor
or
the
student
394
I Chapter 12 Practical Database Design
Methodology
and Use
of
UML Diagrams
Course Enrollment
do/Enroll Students
cancel
Cancelled
Enroll Student/set count =a
cancel
Enroll Student [ count
< 50 ]
count
=50
Section Closing
exit/'closesection
FIGURE 12.11 An example statechart diagram for the University Database.
appearing
for a
test
for a course
and
receiving
a grade in
the
course,
etc.
A complete
methodology
for
how
to arrive at
the
class diagrams from
the
various diagrams
we
illustrated
above
is
outside
our
scope
here.
It
is
explained
further
in
the
case
study
(Appendix
B). Design
methodologies
remain
a
matter
of
judgement,
personal
preferences,
etc.
However, we
can
make
sure
that
the
class
diagram
will
account
for
all
the
specifications
that
have
been
given
in
the
form of
the
use cases,
statechart
and
sequence
diagrams.
The
class
diagram
in Figure 12.13 shows
the
classes with the
structural
relationships
and
the
operations
within
the
classes
that
are derived
from
these
diagrams.
These
classes will
need
to be
implemented
to
develop
the
Universiy
Database
and
together
with
the
operations,
it will
implement
the
complete
class
schedule/enrollment/aid
application.
For
clear
understanding
only
some of the
important
attributes
are
shown
in classes
with
certain
methods
that
originate
from
the
shown
diagrams.
It
is
conceivable
that
these
class diagrams
can
be constantly
upgraded
as
more
details
get
specified
and
more
functions
evolve
in
the
University
Application.
12.4
Rational Rose, A UML Based Design Tool I
395
1:'0'&"'00
IIC~'Og
I
I I
I I
I I
I I
I I
requestRegistration I getCourseListing I
I I
:Student
I
I
I
I
[getSeatsLeft - Truej/updateSchedule
~
selectCourse
:r
addCpurse
getPreReq
getSeatsLeft
I
I
I
I
getPreq = true &&
U
I
'-
-
FIGURE
12.12 A sequence diagram for the University Database.
12.4
RATIONAL
ROSE, A
UML
BASED
DESIGN TOOL
12.4.1
Rational
Rose
for Database Design
Rational
Rose is
one
of
the
most
important
modeling tools used in
the
industry to develop
information systems. As we
pointed
out
in
the
first two sections of this chapter, database
is
a central
component
of most information systems,
and
hence,
Rational
Rose provides
the
initial specification in
UML
that
eventually leads to
the
database development. Many
extensions
have
been
made in
the
latest versions of Rose for
data
modeling
and
now
Rational
Rose provides support for conceptual, logical
and
physical database modeling
and
design.
12.4.2
Rational
Rose
Data
Modeler
Rational
Rose
Data
Modeler is a visual modeling tool for designing databases.
One
of
the
reasons
for its popularity is
that
unlike
other
data
modeling tools it is
UML
based; it
396
I Chapter 12 Practical Database Design Methodology and Use of UML Diagrams
EMPLOYEE
DEPARTMENT
MANAGES
~
«PK»
PK_DEPARTMENT1 0
0 1
*
~
«FK»
FK_DEPARTMENT70
~
«Unique»
TC_DEPARTMENT240
0 1*
1
«Non-Identifying»
El Number: INTEGER
«Non-Identifying»
D Name: CHAR(15)
c
__
WORKS_FOR 'D
Location: CHAR(15)
1.
.* 1 D NumberOfEmployees: INTEGER
D MgrSsn : INTEGER
D MgrStartDate : DATE
~
Ssn : INTEGER
D Fname: CHAR(15)
D Minit: CHAR(l)
D Lname : CHAR(15)
D Sex: CHAR(l)
D Salary: INTEGER
D Address: CHAR(20)
~
Ssn : INTEGER
D Bdate: DATE
~
Number: INTERGER
~
PROJECT_Number: INTEGER
H = :.: :.:.: ==~::.: t::;;; ::::-: ::~=::-:===-:: 1
~
Name: CHAR(15)
~
EMPLOYEE Ssn: INTEGER
~
«PK»
PK_PROJECT20
~
«FK»
FK_PROJECT30
El Number; INTEGER
El Name: CHAR(15)
D Location: CHAR(15)
~
DEPARTMENT_Number: INTEGER
D Hours: TIME(2)
I0 *
DEPENDENT
ITO
El Name: CHAR(15)
D
SEX:
CHAR(l)
D BirthDate : DATE
D Relationship: CHAR(15)
10
Ssn : INETGER
~
«PK»
PK_DEPENDENT30
~
«FK»
FK_DEPENDENT10
~
«PK»
PK_T_000
~
«FK»
EMPLOYEE20
~
«FK»
EMPLOYEE60
~
«FK»
EMPLOYEE100
I
11
«Identifying»
HAS_DEPENDENTS
~
«NON-Identifying»
SUPERVISION
-,
«Identifying»
WORKS_ON
1
«NON-Identifying»
CONTROLS
0 *
PROJECT
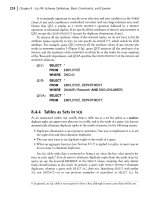
FIGURE 12.13 A graphical data model diagram in Rational
Rose.
provides a
common
tool
and
language to bridge
the
communication
gap between
data-
base designers
and
application developers. It makes it possible for database
designers,
developers
and
analysts to work together, capture
and
share business requirements and
track
them
as they change
throughout
the
process. Also, by allowing
the
designers to
12.4 Rational Rose, A UML Based Design Tool I
397
model
and design all specifications on
the
same platform using
the
same
notation
it
improves
the
design process
and
reduces
the
risk of errors.
Another major advantage of Rose is its process modeling capabilities
that
allow
the
modeling
of
the
behavior of database as we saw in
the
short example above in
the
form of
use
cases,
sequence diagrams,
and
statechart diagrams.
There
is
the
additional machinery
ofcollaboration diagrams to show interactions between objects
and
activity diagrams to
model
the flow of
control
which we did
not
elaborate upon.
The
eventual goal is to
generate
the
database specification
and
application code as
much
as possible.
With
the
Rose
Data Modeler we
can
capture triggers, stored procedures etc. (see
Chapter
24 where
active
databases
contain
these features) explicitly
on
the
diagram
rather
than
representing
them
with
hidden
tagged values
behind
the
scenes.
The
Data Modeler also provides
the
capability
to
forward engineer a database in terms of constantly changing requirements
and
reverseengineer an existing implemented database
into
its conceptual design.
12.4.3
Data Modeling Using Rational
Rose
Data
Modeler
There
are many tools
and
options available in Rose
Data
Modeler for
data
modeling.
Rational
Rose
Data
Modeler allows creating a
data
model based on
the
database structure
orcreating a database based
on
the
data
model.
Reverse
Engineering. Reverse Engineering of
the
database allows
the
user
to
create
a
data
model based on
the
database structure. If we
have
an existing DBMS
database
or DDL file we
can
use
the
reverse engineering wizard in
Rational
Rose Data
Modeler
to generate a
conceptual
data
model.
The
reverse engineering wizard basically
reads
the schema in
the
database or DDL file,
and
recreates it in a
data
model.
While
doing
so, it also includes
the
names of all
quoted
identifier entities.
Forward
Engineering and
DDL
Generation. We
can
also create a
data
model''
directly
from scratch in
Rational
Rose.
Having
created
the
data
model we
can
also use it
to generate
the
DDL in a specific DBMS from
the
data
model.
There
is a Forward
Engineering
Wizard in Modeler,
which
reads
the
schema in
the
data
model or reads
both
the
schema in
the
data
model
and
the
tablespaces in
the
data
storage model
and
generates
the
appropriate DDL code in a DDL file.
The
wizard also provides
the
option
of
generating
a database by executing
the
generated DDL file.
Conceptual Design in
UML
Notation.
As
mentioned
earlier,
one
of
the
major
advantages
of Rose is
that
it allows modeling of databases using
UML
notation.
ER
9.Theterm
data
model used by
Rational
Rose Modelre corresponds to our
notion
of an application
model.
398
I
Chapter
12 Practical
Database
Design
Methodology
and
Use of UML
Diagrams
diagrams most often used in
the
conceptual design of databases
can
be easily built using
the
UML
notation
as class diagrams in Rational Rose, e.g.
the
ER schema of our company
example in
Chapter
3
can
be redrawn in Rational Rose using
UML
notation
as follows.
This
can
then
be converted
into
a graphical form by using
the
data
model diagram
option
in Rose.
The
above diagrams correspond partly to a relational (logical) schema although they
are at a conceptual level.
They
show
the
relationships among tables via
the
primary key
(PK)-foreign key (FK) relationships. Identifying relationships specify
that
a child table
cannot
exist without
the
parent table (Dependent tables), whereas non-identifying
relationships specify a regular association between two independent tables. For better and
clear understanding, foreign keys automatically appear as
one
of
the
attributes in
the
child
entities. It is possible to update
the
schemas directly in their text or graphical form. For
example,
the
relationship between
the
EMPLOYEE and PROJECT called WORKS-ON
may be deleted and Rose automatically takes care of all
the
foreign keys, etc. in
the
table.
Supported Databases. Some
of
the
DBMSs
that
are currently supported by Rational
Rose include
the
following:
• IBM DB2 versions MVS
and
UDB
S.x, 6.x, and 7.0.
•
Oracle
DBMS versions 7.x
and
S,x.
•
SQL
Server QL Server DBMS versions
6.5,7.0
& 2000.
• Sybase Adaptive Server version 12.x.
The
SQL
92 Data Modeler does
not
reverse engineer
ANSI
SQL
92 DDLs, however
it
can
forward engineer
SQL
92
data
models to DDLs.
Converting Logical Data
Model
to
Object
Model
and Vice Versa. Rational
Rose
Data
Modeler also provides
the
option
of converting a logical database design to an
object model design and vice versa. For example
the
logical data model shown in Figure
12.14
can
be converted to an object model.
This
sort of mapping allows a deep
understanding of
the
relationships between
the
logical model and database and helps in
keeping
them
both
up to date
with
changes made during
the
development process. Figure
12.16 shows
the
Employee table after converting it to a class in an object model. The
various tabs in
the
window
can
then
be used to enter/display different types of
information.
They
include operations, attributes and relationships for
that
class.
Synchronization Between the Conceptual Design and the Actual
Database.
Rose Data Modeler allows keeping
the
data model and database synchronized.
It
allows
visualizing
both
the
data
model
and
the
database and then, based
on
the differences, it
gives
the
option
to update
the
model or change
the
database.
Extensive
Domain
Support.
The
Data Modeler allows database designers to
create a standard set of user-defined data types and assign
them
to any column in
the
data
12.4 Rational
Rose,
A UML Based Design Tool I
399
fig1
£CJUse
Case
View
:.:::
D
Logical
View
"
ill
Global
DataTypes
,'J
tli:l
Schemes
d tfl.]
:<ochema)}
COMPANY
my[ornpan,YD
atamodelDlagrdin
DEPARTMENT
Number
Name
Location
NlJmberOIEnli,.ilo!r'ee~
Mgr~;m
MglStartDate
• <,PK: J
P,_DEPARTMENT1
DEPENDENT
Name
Se»
B"thDale
Relationship
•
«PKn
PK_DEPENDENT3
EMPLOYEE
Fname
Minit
Lnene
Sex
Salary
Address
PI( 3m
Bdale
•
),PK·:
PK T 00
[-ffiJJ-,
fli(
Number
PK
Name
Location
Hour,
• «PK» PK
PROJECT2
~
Associ -
FIGURE
12.14 A logical data model diagram definition in Rational Rose.
model.
Properties of
the
domain
are
then
cascaded
to
assigned columns.
These
domains
can
then be
maintained
by a standard group
and
deployed
to
all modelers
when
they
begin
creating new models by using
the
Rational
Rose Framework.
Easy
Communication
Among
Design Teams. As
mentioned
earlier, using a
common
tool allows easy
communication
between teams. In
Data
Modeler an application
developer
can access
both
the
object
and
data
models
and
see how they are related
and
thus
make informed
and
better
choices about
how
to build
data
access methods.
There
is
also
the option of using Rational Rose Web Publisher to allow
the
models
and
the
metadata
beneath
these models to be available to everyone
on
the
team.
~
t
r:
400
I
Chapter
12 Practical
Database
Design
Methodology
and
Use of UML
Diagrams
Person
FinancialAid
~
name
~
Ssn
~
~
aidType
~
aidAmount
~
assignAidO
Catalog
~
~
enterGradesO
~
offerCourseO
~
····0
~
~
getPreReqO
/
~
getSeatsLeftO
~
getCourseListingO
~
····0
L
__
,_-
__
/
~
~
requestRegistrationO
~
applyAidO
~
·····0
Course
Registration
~
~
findCourseAddO
~
cancelCourseO
~
addCourseO
~
viewScheduleO
~
0
Schedule
~
~
updateScheduleO
I i
~
showScheduleO
[J
0
~
time
~
classroom
~
seats
~
~
oropcourset)
~
addCourseO
~
· ·0
FIGURE 12.15
The
design
of
the
university
database
as a class
diagram.
What
we
have
described above is a partial description of
the
capabilities of the
tool
as it related to
the
conceptual
and
logical design phases in Figure 12.1.
The
entire
range
of
UML
diagrams we described in
Section
12.3
can
be developed and maintained in
Rose.
For further details
the
reader is referred to
the
product literature. Appendix B developsa
full case study
with
the
help of
UML
diagrams and shows
the
progression of
design
through different phases. Figure 12.17 gives a version of
the
class diagram in Figure
3.16
drawn using
Rational
Rose.
12.5
Automated
Database
Design Tools I 401
FIGURE
12.16 The class OM_EMPLOYEE
corresponding
to
the
table Employee in
Figure
12.14.
12.5
AUTOMATED
DATABASE
DESIGN TOOLS
The
database design activity predominantly spans Phase 2 (conceptual design), Phase 4
(data
model mapping, or logical design)
and
Phase 5 (physical database design) in
the
design
process
that
we discussed in
Section
12.2. Discussion of Phase 5 is deferred to
Chapter
16 in
the
context
of query optimization. We discussed Phases 2
and
4 in detail
with
the use of
the
UML
notation
in
Section
12.3
and
pointed
out
the
features of
the
tool
Rational
Rose,
which
support these phases. As we
pointed
out
before, Rational Rose is
more
than just a database design tool.
It
is a software
development
tool
and
does database
modeling
and
schema
design in
the
form of class diagrams as part of its overall object-
oriented
application
development
methodology. In this section, we summarize
the
fea-
tures
and shortcomings of
the
set of commercial tools
that
are focussed
on
automating
the
process
of conceptual, logical
and
physical design of databases.
When database technology was first introduced, most database design was carried
out
manually
by
expert
designers, who used
their
experience
and
knowledge in
the
design
process.
However, at least two factors indicated
that
some form of
automation
had
to be
utilized
ifpossible:
1.
As an application involves more
and
more complexity of
data
in terms of rela-
tionships
and
constraints,
the
number
of options or different designs to model
the
same information keeps increasing rapidly.
It
becomes difficult to deal
with
this
complexity
and
the
corresponding design alternatives manually.
402
I
Chapter
12 Practical
Database
Design
Methodology
and
Use of UML Diagrams
WORKSJOR
EMPLOYEE
~
Fname
~
Minit
~
Lname
~
Ssn
~
Bdate
~
Sex
~
Address
~ Salary
~
age()
~
change_department()
~
change_projects()
DEPENDENT
n +supervi ee
MANAGES
~
StartDate
~
Name
~
Number
0 1
DEPARTMENT
~
Name
~
Number
~
add_employee()
~
number_oCemployeeO
~
change_major()
1 O n
1
n
LOCATION
~
Sex
~
BirthDate
~
Relationship
WORKS-ON
~
Hours
[':'I
add_employee()
~
add_project()
~
change_manager()
FIGURE 12.17
The
Company
Database
Class Diagram (Fig.3.16)
drawn
in Rational Rose.
2.
The
sheer size of some databases runs
into
hundreds of entity types
and
relation-
ship types making
the
task of manually managing these designs almost
impossible.
The
meta
information related to
the
design process we described in Section
12.2
yields
another
database
that
must be created, maintained,
and
queried as a
data-
base in its
own
right.
The
above factors
have
given rise to many tools on
the
market
that
come under
the
general category of CASE
(Computer-Aided
Software Engineering) tools for
database
design. Rational Rose is a good example of a
modern
CASE
tool. Typically these
tools
consist of a
combination
of
the
following facilities:
1.
Diagramming:
This
allows
the
designer to draw a conceptual schema diagram,
in
some tool-specific notation. Most notations include entity types, relationship
types
that
are shown either as separate boxes or simply as directed or undirected lines,
car-
dinality constraints shown alongside
the
lines or in terms of
the
different
types
of
12.5 Automated Database Design Tools I
403
arrowheads or min/max constraints, attributes, keys, and so on.
lO
Some tools display
inheritance hierarchies and use additional
notation
for showing
the
partial versus
total and disjoint versus overlapping nature of
the
generalizations.
The
diagrams are
internally stored as conceptual designs and are available for modification as well as
generation of reports, cross reference listings, and
other
uses.
2.
Model
mapping:
This
implements mapping algorithms similar to
the
ones we pre-
sented in Sections 9.1
and
9.2.
The
mapping is
system-specific-most
tools gener-
ate schemas in
SQL
DDL
for Oracle,
DB2,
Informix, Sybase,
and
other
RDBMSs.
This
part
of
the
tool is most amenable to automation.
The
designer
can
edit
the
produced
DDL
files if needed.
3.
Design
normalization:
This
utilizes a set of functional dependencies
that
are sup-
plied at
the
conceptual
design or after
the
relational schemas are produced during
logical design.
The
design decomposition algorithms from
Chapter
15 are applied
to decompose existing relations
into
higher
normal
form relations. Typically, tools
lack
the
approach of generating alternative 3NFor
BCNF
designs
and
allowing
the
designer to select among
them
based
on
some criteria like
the
minimum
number
of relations or least
amount
of storage.
Most tools incorporate some form of physical design including
the
choice of indexes.
A
whole
range of separate tools exists for performance
monitoring
and
measurement.
The
problem
of
tuning
a design or
the
database
implementation
is still mostly
handled
as a
human
decision-making activity.
Out
of
the
phases of design described in this chapter,
one
area where
there
is hardly any commercial tool support is view integration (see
Section
12.2.2).
We will
not
survey database design tools here,
but
only
mention
the
following
characteristics
that
a good design
tool
should possess:
1.
An
easy-to-use
interface:
This
is critical because it enables designers to focus
on
the
task at
hand,
not
on
understanding the tool. Graphical and
point
and
click inter-
faces are commonly used. A few tools like
the
SECS!
tool from France use natural
language input. Different interfaces may be tailored to beginners or to expert
designers.
2. Analytical components: Tools should provide analytical
components
for tasks
that
are difficult to perform manually, such as evaluating physical design alternatives
or detecting conflicting constraints among views.
This
area is weak in most cur-
rent tools.
3.
Heuristic
components: Aspects of
the
design
that
cannot
be precisely quantified
can be
automated
by
entering
heuristic rules in
the
design tool to evaluate design
alternatives.
10.
We
showed
the ER,
EER,
and UML classdiagramnotations in Chapters 3 and 4. See Appendix A
for
an
idea
ofthe different typesof diagrammaticnotations used.
404
I
Chapter
12 Practical
Database
Design
Methodology
and
Use of UML Diagrams
4. Trade-off
analysis:
A
tool
should present
the
designer
with
adequate comparative
analysis
whenever
it presents multiple alternatives
to
choose from. Tools should
ideally incorporate an analysis of a design change at
the
conceptual design level
down
to physical design. Because of
the
many alternatives possible for physical
design in a given system, such tradeoff analysis is difficult to carry
out
and
most
current
tools avoid it.
5.
Display
of
design
results:
Design results, such as schemas, are
often
displayed in dia-
grammatic form. Aesthetically pleasing
and
well laid
out
diagrams are
not
easy to
generate automatically. Multipage design layouts
that
are easy to read are another
challenge.
Other
types of results of design may be shown as tables, lists, or reports
that
can
be easily interpreted.
6.
Design
verification:
This
is a highly desirable feature. Its purpose is to verify that
the
resulting design satisfies
the
initial requirements. Unless
toe
requirements are
captured
and
internally represented in some analyzable form,
the
verification can-
not
be attempted.
Currently
there
is increasing awareness of
the
value of design tools,
and
they are
becoming a must for dealing
with
large database design problems.
There
is also an
increasing awareness
that
schema
design
and
application design should go
hand
in hand,
and
the
current
trend
among CASE tools is to address
both
areas.
The
popularity of
Rational
Rose is due to
the
fact
that
it approaches
the
two arms of
the
design
process
shown
in Figure 12.1 concurrently, approaching database design
and
application design
as
a unified activity.
Some
vendors like
Platinum
provide a tool for
data
modeling
and
schema design (ERWin)
and
another
for process modeling
and
functional
design
(BPWin).
Other
tools (for example, SECSI) use expert system technology to guide the
design process by including design expertise in
the
form of rules. Expert
system
technology is also useful in
the
requirements collection
and
analysis phase, which
is
typically a laborious
and
frustrating process.
The
trend is to use
both
metadata
repositories
and
design tools to achieve
better
designs for complex databases. Without a
claim of being exhaustive, Table 12.1 lists some popular database design
and
application
modeling tools.
Companies
in
the
table are listed in alphabetical order.
12.6 SUMMARY
We started this
chapter
by discussing
the
role of information systems in organizations;
database systems are looked
upon
as a
part
of information systems in large-scale
applica-
tions. We discussed
how
databases fit
within
an information system for information
resource
management
in an organization
and
the
life cycle they go through. We then
dis-
cussed
the
six phases of
the
design process.
The
three phases commonly included as a
part
of database design are conceptual design, logical design
(data
model mapping), and
phys-
ical design. We also discussed
the
initial phase of requirements collection and
analysis,
which is often considered to be a
predesign
phase.
In addition, at some
point
during
the
design, a specific DBMSpackage must be chosen. We discussed some of
the
organizational
12.6
Summary
I
405
TABLE
12.1
SOME
OF THE
CURRENTlY
AVAILABLE
AUTOMATED
DATABASE
DESIGN
TOOLS
TOOl
COMPANY
FUNCTIONALITY
_
_
Embarcadero
Technologies
Oracle
Popkin
Software
Platinum
Technology
Persistence
Inc.
Rational
Rogue
Ware
Resolution
Ltd.
Sybase
Visio
ER
Studio
DB
Artisan
Developer 2000
and
Designer 2000
System
Architect
2001
Platinum
Enterprise Modeling
Suite: ERwin, BPWin, Paradigm
Plus
Powertier
Rational
Rose
RWMetro
XCase
Enterprise
Application
Suite
Visio Enterprise
Database Modeling
in ER
and
IDEFlx
Database administration
and
space
and
security manage-
ment
Database modeling, application
development
Data
modeling, object model-
ing, process modeling, struc-
tured analysis/design
Data, process,
and
business com-
ponent
modeling
Mapping from
0-0
to relational
model
Modeling
in
UML
and applica-
tion
generation in
c++
and
JAVA
Mapping from
0-0
to relational
model
Conceptual
modeling up to code
maintenance
Data
modeling, business logic
modeling
Data
modeling, design
and
reengineering Visual Basic
and
Visual c+ +
criteria
that
come
into
play in selecting a DBMS. As performance problems are detected,
and
as new applications are added, designs
have
to be modified.
The
importance of
designing
both
the
schema
and
the
applications (or transactions) was highlighted. We
discussed
different approaches
to
conceptual
schema
design
and
the
difference between
centralized
schema design
and
the
view
integration
approach.
We introduced
UML
diagrams as an aid to
the
specification of database models and
designs.
We
introduced
the
entire
range of structural
and
behavioral diagrams
and
then
described
the
notational
detail about
the
following types of diagrams: use case, sequence,
statechart.
Class diagrams
have
already
been
discussed in Sections 3.8
and
4.6,
respectively.
We showed
how
requirements for a university database are specified using
these
diagrams
and
can
be used
to
develop
the
conceptual
design of
the
database.
Only
406
I
Chapter
12 Practical
Database
Design
Methodology
and
Use of UML Diagrams
illustrative details
and
not
the
complete specification were supplied. Appendix B
develops a complete case study of
the
design
and
implementation
of a database.
Then
we
discussed
the
currently popular software
development
tool-Rational
Rose
and
the
Rose
Data
Modeler-that
provides support for
the
conceptual
design
and
logical design
phases
of database design. Rose is a
much
broader tool for design of information systems at
large.
Finally, we briefly discussed
the
functionality
and
desirable features of commercial
automated
database design tools
that
are more focussed
on
database design as opposed to
Rose. A tabular summary of features was pesented.
Review Questions
12.1.
What
are
the
six phases of database design? Discuss
each
phase.
12.2.
Which
of
the
six phases are considered
the
main
activities of
the
database
design
process itself? Why?
12.3.
Why
is it
important
to design
the
schemas
and
applications in parallel?
12.4.
Why
is it
important
to use an
implementation-independent
data
model
during
conceptual schema design?
What
models are used in
current
design tools? Why!
12.5. Discuss
the
importance of Requirements
Collection
and
Analysis.
12.6. Consider an actual application of a database system of interest. Define the
requirements of
the
different levels of users in terms of
data
needed, types of
queries,
and
transactions to be processed.
12.7. Discuss
the
characteristics
that
a
data
model for conceptual schema design
should
possess.
12.8.
Compare
and
contrast
the
two
main
approaches to conceptual schema design.
12.9. Discuss
the
strategies for designing a single conceptual schema from
its
requirements.
12.10.
What
are
the
steps of
the
view integration approach to conceptual
schema
design?
What
are
the
difficulties during
each
step?
12.11.
How
would a view integration tool work? Design a sample modular architecture
for such a too!'
12.12.
What
are
the
different strategies for view integration.
12.13. Discuss
the
factors
that
influence
the
choice of a
DBMS
package for
the
information system of an organization.
12.14.
What
is system-independent
data
model mapping? How is it different
from
system-dependent
data
model mapping?
12.15.
What
are
the
important
factors
that
influence physical database design?
12.16. Discuss
the
decisions made during physical database design.
12.17. Discuss
the
macro
and
micro life cycles of an information system.
12.18. Discuss
the
guidelines for physical database design in
RDBMSs.
12.19. Discuss
the
types of modifications
that
may be applied to
the
logical
database
design of a relational database.
12.20.
What
functions do
the
typical database design tools provide?
12.21.
What
type of functionality would be desirable in automated tools to
support
optimal design of large databases?
Selected Bibliography I
407
Selected Bibliography
There is a vast
amount
of literature on database design. We first list some of
the
books
thataddress database design. Batini et al. (1992) is a comprehensive
treatment
of concep-
tual
and logical database design. Wiederhold (1986) covers all phases of database design,
with
an emphasis
on
physical design.
O'Neil
(1994) has a detailed discussion of physical
design
and transaction issues in reference to commercial
RDBMSs.
A large body of work on
conceptual modeling
and
design was
done
in
the
eighties. Brodie et al. (1984) gives a col-
lection
of chapters
on
conceptual
modeling,
constraint
specification
and
analysis,
and
transactiondesign. Yao (1985) is a collection of works ranging from requirements specifi-
cation
techniques to
schema
restructuring. Teorey (1998) emphasizes
EER
modeling
and
discusses
various aspects of
conceptual
and
logical database design. McFadden
and
Hoffer
(1997)
isa good
introduction
to
the
business applications issues of database management.
Navathe
and
Kerschberg (1986) discuss all phases of database design
and
point
out
theroleof
data
dictionaries. Goldfine
and
Konig (1988)
and
ANSI
(1989) discuss
the
role
ofdata dictionaries in database design. Rozen
and
Shasha
(1991)
and
Carlis
and
March
(1984)
present different models for
the
problem of physical database design.
Object-
oriented
database design is discussed in Schlaer
and
Mellor (1988), Rumbaugh et al.
(1991),
Martin
and
Odell
(1991),
and
Jacobson (1992).
Recent
books by Blaha
and
Premerlani
(1998)
and
Rumbaugh et al. (1999) consolidate
the
existing techniques in
object-oriented design. Fowler
and
Scott
(1997) is a quick
introduction
to
UML.
Requirements collection
and
analysis is a heavily researched topic. Chatzoglu et al.
(1997)
and Lubars et al. (1993) present surveys of
current
practices in requirements
capture,
modeling,
and
analysis. Carroll (1995) provides a set of readings
on
the
use of
scenarios
for requirements gathering in early stages of system development.
Wood
and
Silver
(1989) gives a good overview of
the
official
Joint
Application
Design
(lAD)
process.
Potter et al. (1991) describes
the
Z
notation
and
methodology for formal
specification
of software. Zave (1997) has classified
the
research efforts in requirements
engineering.
A large body of work has
been
produced on
the
problems of schema
and
view
integration,
which is becoming particularly relevant now because of
the
need
to integrate
a
variety
of existing databases.
Navathe
and
Gadgil (1982) defined approaches
to
view
integration.
Schema
integration methodologies are compared in Batini et al. (1986).
Detailed
work
on
n-ary view integration
can
be found in
Navathe
et al. (1986), Elmasri et
al.
(1986),
and Larson et al. (1989).
An
integration tool based
on
Elmasri et al. (1986) is
described
in
Sheth
et al. (1988).
Another
view integration system is discussed in Hayne
and
Ram (1990).
Casanova
et al. (1991) describes a
tool
for modular database design.
Motro
(1987) discusses integration
with
respect to preexisting databases.
The
binary
balanced
strategy to view integration is discussed in Teorey
and
Fry (1982). A formal
approach
to view integration,
which
uses inclusion dependencies, is given in Casanova
and
Vidal
(1982). Ramesh
and
Ram (1997) describe a methodology for integration of
relationships
in schemas utilizing
the
knowledge of integrity constraints; this extends
the
previous
work of
Navathe
et al. (1984a).
Sheth
at al. (1993) describe
the
issues of
building
global schemas by reasoning about
attribute
relationships
and
entity
equivalences.
N
avathe
and
Savasere (1996) describe a practical approach to building
408
I
Chapter
12 Practical
Database
Design Methodology
and
Use of UML Diagrams
global schemas based on operators applied to schema components.
Santucci
(1998)
provides a detailed
treatment
of refinement of EERschemas for integration.
Castano
et al.
(1999) present a comprehensive survey of
conceptual
schema analysis techniques.
Transaction design is a relatively less thoroughly researched topic. Mylopoulos et at.
(1980) proposed
the
TAXIS
language,
and
Albano
et al. (1987) developed
the
GALILEO
system,
both
of
which
are comprehensive systems for specifying transactions. The
GORDAS language for
the
ECR model (Elmasri et al. 1985)
contains
a transaction
specification capability.
Navathe
and
Balaraman (1991)
and
Ngu (1991)
discuss
transaction modeling in general for semantic
data
models. Elmagarmid (1992) discusses
transaction models for advanced applications. Batini et al. (1992, chaps. 8, 9, and 11)
discuss
high
level
transaction
design
and
joint
analysis of
data
and
functions. Shasha
(1992) is an
excellent
source on database tuning.
Information
about
some well-known commercial database design tools
can
be found
at
the
Web
sites of
the
vendors (see company names in Table 12.1). Principles behind
automated
design tools are discussed in Batini et al. (1992, chap. 15).
The
SEeSI tool from
France is described in Metais et al. (1998).
DKE (1997) is a special issue on natural
language issues in databases.
DATA
STORAGE, INDEXING,
QUERY
PROCESSING,
AND
PHYSICAL
DESIGN
Disk
Storage, Basic File
Structures, and Hashing
Databases are stored physically as files of records,
which
are typically stored on magnetic
disks.
This
chapter
and
the
next
deal
with
the
organization of databases in storage
and
the
techniques for accessing
them
efficiently using various algorithms, some of which require
auxiliary
data
structures called indexes. We start in
Section
13.1 by introducing
the
con-
cepts
of computer storage hierarchies
and
how
they
are used in database systems.
Section
13.2
isdevoted to a description of magnetic disk storage devices
and
their
characteristics,
and
we also briefly describe magnetic tape storage devices. Having discussed different
storage
technologies, we
then
turn
our
attention
to
the
methods for organizing
data
on
disks.
Section 13.3 covers
the
technique
of double buffering,
which
is used to speed
retrieval
of multiple disk blocks. In
Section
13.4 we discuss various ways of formatting
and
storing records of a file
on
disk.
Section
13.5 discusses
the
various types of operations
thatare typically applied to records of a file. We
then
present rhree primary methods for
organizing
records of a file on disk: unordered records, discussed in
Section
13.6; ordered
records,
in
Section
13.7;
and
hashed
records, in
Section
13.8.
Section 13.9 very briefly discusses files of mixed records
and
other
primary methods
for
organizing records, such as B-trees.
These
are particularly relevant for storage of
object-oriented databases,
which
we discuss later in
Chapters
20
and
21.
Section
13.9
describes
RAID
(Redundant
Arrays of Inexpensive (or
Independent)
Disks)-a
data
storage
system architecture
that
is used commonly in large organizations for
better
reliability
and performance. Finally, in
Section
13.10 we describe storage area networks, a
more
recent approach for managing stored
data
on networks. In
Chapter
14 we discuss
411
412 I
Chapter
13 Disk Storage, Basic File Structures,
and
Hashing
techniques for creating auxiliary
data
structures, called indexes,
that
speed up
the
search
for
and
retrieval of records.
These
techniques involve storage of auxiliary data, called
index files, in addition to
the
file records themselves.
Chapters 13 and 14 may be browsed through or even omitted by readers who have
already studied file organizations.
The
material covered here is necessary for understanding
Chapters 15
and
16
that
deal with query processing and query optimization.
13.1
INTRODUCTION
The
collection of
data
that
makes up a computerized database must be stored physically
on
some
computer
storage medium.
The
DBMS software
can
then
retrieve, update, and
process this
data
as needed.
Computer
storage media form a
storage
hierarchy
that
includes
two main categories:
•
Primary
storage.
This
category includes storage media
that
can
be operated on
directly by
the
computer
central
processing
unit
(CPU),
such as
the
computer main
memory
and
smaller
but
faster cache memories. Primary storage usually provides
fast
access to
data
but
is of limited storage capacity.
•
Secondary
storage.
This
category includes magnetic disks, optical disks, and
rapes.
These
devices usually
have
a larger capacity, cost less,
and
provide slower access to
data
than
do primary storage devices. Data in secondary storage
cannot
be processed
directly by
the
CPU; it must first be copied
into
primary storage.
We will first give an overview of
the
various storage devices used for primary and
secondary storage in
Section
13.1.1
and
will
then
discuss
how
databases are typically
handled
in
the
storage hierarchy in
Section
13.1.2.
13.1.1 Memory Hierarchies and Storage
Devices
In a
modem
computer
system
data
resides
and
is rransported throughour a hierarchy of
storage media.
The
highest-speed memory is
the
most expensive
and
is therefore available
with
the
least capacity.
The
lowest-speed memory is offline tape storage,
which
is
essen-
tially available in indefinite storage capacity.
At
the
primary
storage
level,
the
memory hierarchy includes at
the
most expensive
end
cache
memory,
which
is a static RAM
(Random
Access Memory).
Cache
memory is
typically used by
the
CPU to speed up
execution
of programs.
The
next
level of
primary
storage is DRAM (Dynamic
RAM),
which
provides
the
main
work area for
the
CPU
for
keeping programs
and
data
and
is popularly called
main
memory.
The
advantage of
DRAM
is its low cost,
which
continues
to decrease;
the
drawback is its volatility!
and
lower
speed
compared
with
static RAM.
At
the
secondary
storage
level,
the
hierarchy includes
magnetic
disks, as well as mass storage in
the
form of CD-ROM
(Compact
Disk-Read-Only
~._
1. Volatile memory typically loses its
contents
in case of a power outage, whereas nonvolatile
mem-
ory does not.
13.1
Introduction
I
413
Memory)
devices,
and
finally tapes at
the
least expensive
end
of
the
hierarchy.
The
storage
capacity is measured in kilobytes (Kbyte or 1000 bytes), megabytes (Mbyte or 1
million
bytes), gigabytes
(Gbyte
or 1 billion bytes),
and
even
terabytes (1000 Gbvtes).
Programs reside
and
execute
in
DRAM.
Generally, large
permanent
databases reside
onsecondary storage,
and
portions of
the
database are read
into
and
written
from buffers
in main memory as needed.
Now
that
personal computers
and
workstations
have
hundreds of megabytes of
data
in
DRAM,
it is becoming possible to load a large fraction of
the database
into
main
memory. Eight to 16 gigabytes of
RAM
on
a single server are
becoming
commonplace.
In some cases,
entire
databases
can
be
kept
in
main
memory
(with
a backup copy
on
magnetic
disk), leading to
main
memory
databases; these are
particularlyuseful in
real-time applications
that
require extremely fast response times.
An
example
is
telephone
switching applications,
which
store databases
that
contain
routing
and
line information in
main
memory.
Between
DRAM
and
magnetic disk storage,
another
form of memory, flash memory, is
becoming
common,
particularly because it is nonvolatile. Flash memories are high-
density,
high-performance
memories using
EEPROM
(Electrically Erasable Programmable
Read-OnlyMemory) technology.
The
advantage of flash memory is
the
fast access speed;
thedisadvantage is
that
an
entire
block must be erased
and
written
over at a
time.i
Flash
memory
cards are appearing as
the
data
storage
medium
in appliances
with
capacities
ranging
from a few megabytes to a few gigabytes.
These
are appearing in cameras, MP3
players,
USB storage accessories, etc.
CD-ROM
disks store data optically and are read by a laser.
CD-ROMs
contain prerecorded
data
that
cannot
be overwritten.
WORM
(Write-Once-Read-Many) disks are a form of optical
storage
used for archiving data; they allow data to be written
once
and
read any number of
times
without
the
possibility of erasing.
They
hold about half a gigabyte of data per disk and
last
much longer
than
magnetic disks. Optical
juke
box memories use an array of
CD-ROM
platters,
which are loaded
onto
drives on demand. Although optical juke boxes have
capacities
in
the
hundreds of gigabytes, their retrieval times are in
the
hundreds of
milliseconds,
quite a bit slower
than
magnetic disks.
3
This. type of storage is continuing to
decline
because of
the
rapid decrease in cost and increase in capacities of magnetic disks.
The
DVD
(Digital Video Disk) is a recent standard for optical disks allowing 4.5 to 15 gigabytes of
storage
per disk. Mostpersonal computer disk drives now read
CD-ROM
and
DVD
disks.
Finally,
magnetic
tapes are used for archiving
and
backup storage of data. Tape
jukeboxes-which
contain
a
bank
of tapes
that
are catalogued
and
can
be automatically
loaded
onto
tape
drives-are
becoming
popular as
tertiary
storage to
hold
terabytes of
data.
For example,
NASA's
EOS
(Earth
Observation
Satellite) system stores archived
databases
in this fashion.
Many large organizations are already finding it
normal
to
have
terabyte-sized
databases.
The
term
very
large
database
cannot
be defined precisely any more because
2.
For
example,
the INTEL
DD28F032sA
is a 32-megabit capacity flashmemorywith 70-nanosecond
access
speed,
and 430
KB/second
write transfer rate.
3.
Their
rotational speedsare lower (around 400 rpm), giving higher latency delaysand low transfer
rates
(around
100 to 200
KB
/second).