Advances in Steel Structures - part 50 pptx
Bạn đang xem bản rút gọn của tài liệu. Xem và tải ngay bản đầy đủ của tài liệu tại đây (758.55 KB, 10 trang )
470 S.K. Clubley and R.Y. Xiao
Table 1: Summary of typical tested specimens.
Plate
Thickness
(mm)
Failure Load
(KN)
Maximum Slip
(mm)
Failure Mode
12 900 1.95 Brittle
10 870 4.70 Ductile
8 850 3.40 Ductile
6 820 5.63 Ductile
5 770 6.00 Ductile
3. NON-LINEAR NUMERICAL MODELLING
A comprehensive numerical programme was conducted on the tested specimens. The initial stages
of numerical modelling have been concentrated on the definition of the geometric model, associated
constraints and the constituent material properties. Subsequent selection of finite element types in
the computer program will determine the mathematical model applied to achieve solution
convergence. This in turn will govern the level of physical behavioural model accuracy. Both
material and geometric non-linearity were considered. The data obtained from the laboratory is
limited and does not detail behaviour at varying geometric specification. A wide range of
parameters was selected to examine their influence on the shear strength of Bi-Steel plates.
Numerical analysis has enabled all geometric and material properties to be varied. From this
research, conclusions about Bi-Steel behaviour and corresponding theoretical modelling are
suggested.
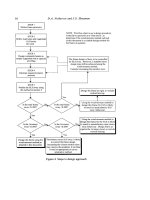
Figure 4: Meshed geometric model prior to solution.
Geometric non-linearity will occur if the model is allowed to experience large strain displacement.
Following initial geometric construction the model requires a mesh of nodes and elements as shown
in Figure 4. Symmetry has been used to provide efficient computing. Meshing parameters and
subsequent specification can prove detrimental to the success of the solution. The level of mesh
refinement will largely govern solution accuracy and the cost of associated computation time. Bi-
Steel is a complicated three-dimensional problem and requires careful use of isoparametric elements
to construct curved surfaces. Within the
Ansys program Solid45 and Solid65 were chosen to
represent steel and concrete entities respectively. Solid45 has eight nodes each with three degrees of
Testing and Modellling of Bi-Steel Plate Subject to Push-Out Loading
471
freedom; design is primarily that of three-dimension consideration. Rate dependent and independent
behaviour is permitted through load application with tolerance for stress stiffening, large deflections
and large strain capability. Tetrahedral shape definition is to be avoided in favour of prismatic
assignment. Solid65 is capable of cracking in three orthogonal directions in tension, crushing in
compression, plastic deformation and creep. The element is defined by eight nodes each having
three degrees of freedom. All models were computed on
Silicon Graphics Octane
machines and
solved on a mainframe
Silicon Graphics Power Challenge 2000
tandem CPU array.
3.1 Modelling without use of a contact element.
Initial computing simulation without a gap element between steel and concrete materials involves
the use of entity merge commands in areas considered to be key load paths. The merge will
represent full interaction at steel and concrete interface. The increase in recorded data is
representative of over stiffening. For this reason it was considered appropriate to invoke area merge
commands between contact surfaces of the shear connector and concrete only. Entity interface at
these two points would ensure load path transference between the concrete core and steel skin
across the whole plate length. The standard non-contact modelling may be considered as the
benchmark for subsequent gap element as shown in Figure 5. Loading is assumed uniform over
area, eccentricity is zero and an arbitrary friction constant is defined. The material specification
used was typical of the material used in the laboratory tests.
Figure 5: Standard contact Bi-Steel model (concrete omitted for clarity).
Initial data analysis indicated the presence of over stiffness and the subsequent tendency to produce
failure loads generally in excess of what could be reasonably expected under laboratory conditions.
Considering the models individually, the most accurate models are those with reduced plate
thickness, which typically experience ductile deformation. Large plate sizes appear accurate during
early to mid stages of load application. All of the aforementioned modelling errors are a result of
the unrealistically high surface interaction invoked at the shear connector. The result summary
graph, Figure 6, indicates a key relationship between plate and connector spacing which was also
later noted with increased accuracy in the contact element model study. It would appear that the
greatest governing factor defining failure strength is plate spacing. Connector pitch adjusts failure
load marginally, producing a group of lines clustered and collecting in a similar fashion around a
locus. A change in the mode of failure appears between plate spacing one hundred and two hundred
millimetres, indicating the possibility of plastic hinge formation and the corresponding relocation at
varying model geometry.
472
S.K. Clubley and R.Y. Xiao
Figure 6: Plate spacing, connector spacing and plate thickness influence on shear strength.
From the regression analysis in Figure 6 the following equations define failure load as a function of
plate spacing. In Figure 6 the regression trendline is indicated in bold.
9 6mm steel plates
9 8mm steel plates
F = 0.02D 2 - 10D + 390 (1)
F = 0.009D 2 - 4.6D + 77
(2)
Where: F = Failure load per shear connector (KN)
D = Plate spacing (mm)
3.2 Modelling with a contact element.
Following the benchmark analysis of the standard model the next stage of accuracy progression is
the introduction of a gap element. Upon initial consideration of software documentation and
element libraries it was decided that Contac52 would represent the interface between steel and
concrete surfaces and provide a more realistic load path for transmission of normal and shear force.
Contac52 allows numerous parameter definitions, most importantly values for normal and
tangential stiffness, Kn & Ks. The gap element may be judged analogous to a spring assembly.
Consequently, incorrect stiffness definition will produce either unrealistic elastic 'bounce' during
load application or too large an inertia to movement caused by shear action. The introduction of
tangential stiffness, Ks, is a key step regarding the modelling of energy dissipation during shear
action, characteristic of a classical push-out test. The ability to successfully transfer energy and
maintain the desired load path propagation is defined by modelling accuracy of physical chemical
bonds and corresponding friction force generated. Upon examination of the relative slip versus load
graph produced by numerical analysis shown in Figure 7, it has been noted that large geometry
models slip considerable less in longitudinal direction UX than smaller specification models.
Behaviour appears not subject to proportionality with respect to their global size. This performance
is curious due to the expected deflection of large span beams according to classical structural
Testing and Modellling of Bi-Steel Plate Subject to Push-Out Loading
473
mechanics. A possible explanation for this may be due to the fact that shear connectors can be
divided into two categories, either rigid or flexible. The corresponding classification provides for
alternate failure mechanisms. Rigid connectors tend to exhibit higher stress concentrations in the
concrete surrounding them resulting in crushing. Flexible connectors are generally more consistent
in failure behaviour. Therefore, smaller size equals increased rigidity, which implies in the case of
Bi-Steel, extended crushing appears locally to shear connectors. Relative slip is possible through
and past crushed concrete zone with applied force not transferred to steel plates fully due to reduced
surface area. Consequently, relative slip of concrete versus steel increases. In contradiction, large
span shear connector equals increased flexibility producing reduced concentrated local crushing.
Traction force and corresponding friction force increases, which implies passage through crushed
matrix reduces.
Figure 7: Relative slip versus load comparison for varied spacing of 6mm thick plate.
When plate spacing is increased to three hundred millimetres or greater, all regions of maximum
stress intensity are generated at weld interface with considerable local problems of concrete
crushing. In addition, the nearest load path is the adjacent steel plate resulting in large UZ wave
displacement particularly evident at large connector spacing. The concrete core has now ceased to
become an effective load path. Subsequently, smaller plate sizes are capable of displaying ductile
deformation before ultimate load as indicated at the weld interface. Therefore, the curve reduction
noted is smaller, but large plate thickness inhibit ductile behaviour due to increased local stiffness
which in turn promotes earlier failure at the weld interface with regression of a plastic hinge into the
shear connector. Connector spacing of one hundred millimetres or less is very unlikely to deform in
a UZ wave shape even for small plate thickness at high loads. This factor allows the whole plate
surface area to remain in contact with the concrete surface with retention of the chemical interface
bond. Increased shear action is necessary to remove the resistance to shear force.
474 S.K. Clubley and R.Y. Xiao
4. MATHEMATICAL MODELLING OF PLATE DEFLECTED SHAPE
A mathematical model is required to support the Bi-Steel design process. This must compare
favourably with previous experimental data and in addition correlate with numerical modelling
already conducted. The solution to the problem is sought with the application of the Laplace
equation.
4.1 Formulation of deflected shape by the Laplace equation.
Consider that plate displacement surface between shear connectors is governed by the Laplace
Equation 3. This assumption comes from the plate measurements recorded in the laboratory tests.
Testing and Modellling of Bi-Steel Plate Subject to Push-Out Loading
Hence the UZ deformation shape of the plate is described by:
~ u(x, y) 4A I 1 1
=~ e -y
sinx +-e -3y sin3x +
~r 3
(5)
475
4.2 Validation against the test data.
The value of the interaction displacement is defined by the UZ displacement at the first shear
connector, weld perimeter. Currently, this is obtained from numerical modelling analysis in the
absence of concise 'real' world physical data. It was found that the equation was very accurate at the
considered point of contraflexure but accuracy reduced moderately at peak/trough values. Typically
accuracy error moved between 0.1% and 40% for displacement predictions at midpoint and
peak/troughs respectively. Quantitatively, the discrepancy in each case is only several hundredths of
a millimetre. Measurement this small would be extremely difficult to record consistently in the
laboratory during specimen loading. Table 2 indicates the accuracy of Equation 5.
Table 2: UZ deformation shape error at midpoint between shear connectors.
Plate Size 6 8 10 12 14 16
(mm)
Numerical
2.77 2.89 5.23 1.94 0.83 0.34
Modelling (ram)
Equation (5)
2.59 2.99 5.00 1.89 0.82 0.36
Answer (ram)
% Error 6.94 3.34 4.60 2.65 1.22 5.56
Difference
It is shown that greatest error is achieved consistently on plate sizes that promote ductile wave
displacements of the Bi-Steel plate between the shear connectors. However, co-ordinates of
peak/trough displacement at one third, two thirds distance between the shear connectors display a
consistent error difference of approximately 30% regardless of the steel plate thickness. Further
evaluation indicates that higher load conditions produce increased displacement stability, while
lower load predictions become more difficult to make accurately. Generally, the Laplace equation
was consistently more accurate at the one-third point than at two-thirds distance between shear
connector one and two. Error difference experienced between the two positions was typically in the
region of 20%.
5. CONCLUSIONS
The following conclusions can be drawn based on the testing, numerical modelling and
mathematical analysis for Bi-Steel plates.
1. From the recent testing it has revealed that Bi-Steel rods and plates have significant shear
strength. The shear strength is greatly affected by several important parameters. These include
plate spacing, rod spacing and rod diameter.
2. From load-deformation relationships it can be seen that Bi-Steel plates have high ductility and
deformation capacity. For very thick plates (> 14mm), the failure can be brittle if Bi-Steel rod
numbers are small. The failure will be initiated by the shear failure of local welds.
476
S.K. Clubley and R.Y. Xiao
3. Graphical plots from numerical analysis show plate thickness and plate spacing govern stress
distribution at local weld perimeter. Rod spacing will largely determine the out of plane UZ
plate deformation shape.
4. Preliminary design formulae for shear strength of Bi-Steel plate have been proposed. These
include the consideration of plate spacing and rod diameter. A general equation is being
developed for design purposes.
5. The deformation shape of Bi-Steel plates has been established through the derivation of the
Laplace equation. Validation against the test results has proved Equation (5) is accurate. This
will be very useful for the serviceability design of Bi-Steel plate.
Further testing, numerical simulation and design procedures are being conducted. These research
results will be published in stages according to the plan.
Acknowledgements:
This research was jointly funded by British Steel Plc and a CASE studentship from the Engineering
and Physical Science Research Council (EPSRC).
References:
1. MOY S. S. J., XIAO R. Y. and LILLESTONE D. Tests for British Steel on the shear strength of
the studs used in the Bi-Steel system. University of Southampton - Department of Civil &
Environmental Engineering, 199.8, May.
2. OEHLERS D. J. and SVED G. Composite beams with limited slip capacity shear connectors.
Journal of Structural Engineering, 1995, Volume 121, June, 932-938.
3. KALFAS C., PAVLIDIS P. and GALOUSSIS E. Inelastic behaviour of shear connection by a
method based on FEM. Journal of Constructional Steel Research, 1997, Volume 44, No. 1-2, 107-
114.
4. UY B. and BRADFORD M. A. Local buckling of thin steel plates in composite construction:
Experiment and theory. Proceedings of the Institution of Civil Engineers - Structures and
Buildings, 1995, Volume 110, November, 426-440.
5. UY B. and BRADFORD M. A. Elastic local buckling of steel plates in composite steel - concrete
members. Journal of Engineering Structures, 1996, Volume 18, No. 3, 193-200.
6. SCHUURMAN R. G. and STARK J. W. B. Longitudinal shear resistance of composite slabs.
Proceedings of the Engineering Foundation Conference, 1997, 89-103.
7. AN L. and CEDERWALL K. Push-out tests on studs in high strength and normal strength
concrete. Journal of Constructional Steel Research, 1996, Volume 36, No.l, 15-29.
8. OEHLERS D. J. and JOHNSON R. P. The strength of stud shear connections in composite
beams. The Structural Engineer, 1987, Volume 65B, No.2, June, 44-48.
9. ANWAR HOSSAIN K. M. and WRIGHT H. D. Performance of profiled concrete shear panels.
Journal of Structural Engineering- ASCE, 1998, Volume 124, 368-381.
10. KEMP A. R. and TRINCHERO P. E. Horizontal shear failures around connectors used with
steel decking. Proceedings of the Engineering Foundation Conference, 1997, 104-118.
11. CLUBLEY S. K., XIAO R. Y. and MOY S. S. J., Computational structural analysis and testing
of Bi-Steel plates- Six and Twelve month progress report for British Steel. University of
Southampton - Department of Civil & Environmental Engineering, 1999, June, 145 & 270 pages.
RECTANGULAR TWO-WAY RC SLABS
BONDED WITH A STEEL PLATE
J. W. Zhangl, J.G. Teng 2 and Y.L. Wong 2
1 Department of Structural Engineering, Southeast University, Nanjing, China.
2 Department of Civil and Structural Engineering
The Hong Kong Polytechnic University, Hong Kong, China.
ABSTRACT
External bonding of steel plates has been widely used for retrofitting RC structures. Many studies have
been carried out on RC beams bonded with steel plates, but little research exists on two-way RC slabs
strengthened using this technique. This paper is therefore concerned with the strength of rectangular
two-way RC slabs bonded with steel plates subject to a central patch load. Experimental results on
square RC slabs bonded with square steel plates are first summarized. A yield line analysis of
rectangular two-way plated RC slabs is then presented based on experimental observations of the
formation of yield lines. Finally, a design procedure based on the yield line analysis is proposed for
practical use, which incorporates an empirical modification factor based on the experimental results.
KEYWORDS: Slabs, Steel Plates, Yield Line Analysis, Strengthening, Bonding, Adhesive
INTRODUCTION
Among the many strengthening techniques available, the method of plate bonding has been an attractive
one in recent years, due to its simplicity and speed of application and minimum increases in structural
self-weight and size. Steel plates and fibre-reinforced plastic (FRP) plates have both been used in plate
bonding, depending on the requirement of a particular situation. Steel plates have been used very widely
to strengthen RC beams and also slabs.
Two recent cases of plate bonding to slabs are reported in Civil Engineers Australia (1995) and
Godfrey and Sharkey (1996), and both used steel plates. Although a great deal of research has been
carried out in recent years on this method of strengthening for RC beams, the only previous study on
two-way slabs is that by Erki and Hefferman (1995) which reported some tests on small two-way
slabs bonded with FRP sheets to enhance the punching shear failure load.
This paper is therefore concerned with the strength of rectangular two-way RC slabs bonded with steel
plates subject to a central patch load. High patch loads requiting strengthening of structures often arise
in practice. Examples include local loads due to the installation of a piece of heavy equipment and
column loads on floor slabs due to the removal or addition of columns. Experimental results on square
477
478
J.W. Zhang et al.
RC slabs bonded with square steel plates are first summarized. A yield line analysis of rectangular two-
way plated RC slabs is then presented based on experimental observations of the formation of yield
lines. Finally, a design procedure based on the yield line analysis is proposed for practical use, which
incorporates an empirical modification factor based on the experimental results. It should be remarked
that if a single steel plate is too big for convenient handling in construction, a number of
orthogonally placed steel strips may be used instead to achieve the same amount of external
reinforcement. The work presented here is equally applicable to such slabs.
EXPERIMENTS
ON SQUARE SLABS
Experimental Results
A total of five square RC slabs bonded with square steel plates were tested by the authors (Zhang et
al., 1999). Only a brief summary of the experimental results in relation to the yield line analysis to be
TABLE 1
PROPERTIES OF MATERIALS
Materials
Concrete
Rebar
Type
1800x 1800x70 (mm)
Mild steel d76.5,@ 150mm
centres, in both directions,
average concrete cover for
the two directions =16.5mm
Steel plate Mild steel
Adhesive ET epoxy resin
*Assumed values
Elastic Compressive Yield Ultimate
modulus strength stress tensile stress
(N/mm 2 )
(Nlmm z )
(N/mm z ) (N/mm 2 )
- 26.4 - -
200000*
200000*
5960
340
431
- 335 417
94 - 11
TABLE 2
EXPERIMENTAL RESULTS AND COMPARISON WITH YIELD LINE ANALYSIS
Specimen
SB1
(control)
Dimensions of
steel plate (in mm)
and plate-to-slab
area ratio (%)
No plate
Initial cracking
loadPcr
(kY)
and relative
increase
Ycr
against
SB1 (%)
21 (0.00)
Experimental
ultimate load
Pe
(kN) and relative
increase Ye against
SBI(%)
55.0 (0.00)
Theoretical
ultimate
load
Pu
(1~)
45.2
SB2 500•215 (8.65) 40 (90.5) 67.5 (22.7) 56.0
SB3 500•215 (8.65) 40 (90.5) 65.0 (18.2) 56.0
SB4 850•215 (25.0) 60 (186) 85.0 (54.5) 75.7
SB5 1400• 1400• 1 100 (376) 165 (200) 200
(67.8)
Pu
ee
0.82
0.83
0.86
0.92
1.21
presented in this paper is given here. The slabs all had the same dimensions of 1800 mm x 1800 mm
x 70 mm. They were simply supported with a span of 1700 mm between supports and subject to a
Rectangular Two-Way RC Slabs Bonded with a Steel Plate
479
central patch load over an area of 150 mm x 150 mm. Details of the material properties and
dimensions of the bonded steel plates are given in Tables 1 and 2 respectively. Table 2 also gives the
initial cracking loads and ultimate loads of the test slabs.
These experiments showed that bonding of steel plates to the soffit of slabs can greatly increase both the
cracking load and the ultimate load of two-way RC slabs. Debonding of the steel plate from the slab is
unlikely as in all four tests on plated slabs, no debonding failure was found. This is contrary to the case
of plated beams. In this sense, the plate bonding method is more suited for slabs than for beams. Failure
of the plated slabs was by the formation of yield lines and the failure mode was ductile. The final
cracking patterns and hence yield line patterns of slabs SB2, SB3 and SB4 are similar. Most of the
cracks were on the soffit of the slab. At the edges of the steel plate, an abrupt change in stiffness and
strength occurs. As a result, main cracks occurred around the plate perimeter. In addition, in each
zone between the corner of the steel plate and that of the slab, there were four or five main diagonal
cracks. The final cracking patterns of slab SB4 are shown in Figure 1. Slab SB5 which was bonded
with a large steel plate had a different yield line pattern.
Figure 1 Final Cracking Patterns of Slab SB4
Figure 2 Triangular Yield Line Pattern
for a Square Plated Slab
TABLE 3
ACCURACY OF THE TRIANGULAR YIELD LINE PATTERN
Slabs
k 2
( k 3 )
SB1 0.0882
SB2 0.294
SB3 0.294
SB4 0.5
SB5
k 1
0.267
0.207
0.207
0.146
Pe
(kN)
55
67.5
65
85
Pu (kN)
45.2
56.0
56.0
75.7
Error (%)
-17.8
-17.0
-13.8
-10.9
0.824 0.052 165 200 21.2
Yield Line Analysis
Based on the experimentally observed yield line pattems, yield line analyses (Johansen, 1962; Jones
and Wood, 1967; Kong and Evans, 1987) were carried out for the test slabs (Zhang et al., 1999). In
particular, three of four different yield line pattems explored were suitable for slabs with cracking
patterns similar to those shown in Figure 1, with the fourth being suitable for slab SB5. The differences
in these three yield line patterns lie in the assumption of yield line patterns in the zones between the
comers of the steel plate and the slab.