The Ecology of the Cambrian Radiation - Andrey Zhuravlev - Chapter 2 ppsx
Bạn đang xem bản rút gọn của tài liệu. Xem và tải ngay bản đầy đủ của tài liệu tại đây (3.22 MB, 38 trang )
PART I
The Environment
02-C1099 8/10/00 2:02 PM Page 9
02-C1099 8/10/00 2:02 PM Page 10
CHAPTER TWO
Alan G. Smith
Paleomagnetically and Tectonically
Based Global Maps for Vendian
to Mid-Ordovician Time
Recent revisions to the early Paleozoic time scale have been used to recalibrate ages
assigned to stratigraphically dated paleomagnetic poles of that era. In particular, a
value of 545 Ma has been used for the base of the Cambrian. Selected poles have
then been used to derive apparent polar wander paths (APWPs) for the major conti-
nents—Laurentia, Baltica, Siberia, and Gondwana—for late Precambrian to Late
Ordovician time. The scatter of the paleomagnetic data is high for this interval, and
the number of suitable Precambrian poles is very low, with confidence limits (ex-
pressed as a
95
) commonly Ͼ20Њ and occasionally Ͼ40Њ. The scatter is attributed to
“noisy” paleomagnetic data rather than to any non-uniformitarian effects such as
large-scale “true” polar wander, significant departures from the geocentric axisym-
metric dipole field model, very rapid plate motions, and the like. There is a clear need
for many more isotopically dated poles of late Precambrian to Cambrian age from
all the major continents. The data from Laurentia are considered the most reliable.
Maps have been made for 620 – 460 Ma at 40 m.y. intervals. For the 460 Ma
map the orientation and position of all the major continents have been determined
by paleomagnetic data; the longitude separation has been estimated from tectonic
considerations. The 500 Ma map has been similarly constructed, except that Baltica’s
position has been interpolated between a mean pole at 477 Ma and its position on a
visually determined reassembly at 580 Ma (“Pannotia”). The 540 Ma map is inter-
polated between the positions of Gondwana, Baltica, and Siberia at 533 Ma, 477 Ma,
and 519 Ma, respectively, and their position in Pannotia. There is a significant dif-
ference between the paleomagnetically estimated latitude of Morocco at this time
and the latitudes implied by archaeocyaths there. This discrepancy is tentatively at-
tributed to incorrect age assignments to poles of this age, rather than to a period of
rapid true polar wander or some such effect. The 580 Ma map represents the time
when Pannotia—a late Precambrian Pangea—is considered to have just started
to break up. Laurentia’s position, interpolated between mean poles at 520 Ma and
02-C1099 8/10/00 2:02 PM Page 11
12 Alan G. Smith
589 Ma is used to orient the reassembly. The 620 Ma map is also oriented by inter-
polating between Laurentian mean poles at 589 Ma and 719 Ma, with East Gond-
wana lying an arbitrary distance from the remainder of Pannotia.
THOSE TECTONIC MODELS that suggest that during late Precambrian and early Pa-
leozoic time Baltica and Siberia were close to one another and fringed by more or less
laterally continuous island arcs imply that even if the two continents were geographi-
cally isolated, faunal interchange between them should have been possible. Other tec-
tonic models may not have this requirement.
The maps suggest that nearly all the tillites in the 620–580 Ma interval were de-
posited poleward of 40Њ, rather than reflecting high obliquity or a “snowball Earth.”
Because of the way in which the maps have been made, some Vendian tillites from
Australia lie at much higher latitudes on the maps than the local paleomagnetic data
suggest.
Storey (1993) has reviewed significant insights that have recently been made into
the likely configurations of Neoproterozoic and early Paleozoic continents. This chap-
ter attempts to illustrate some of these developments in five global paleocontinental
maps for Vendian to Late Ordovician time, 620 –460 Ma, at 40 m.y. intervals. The Ven-
dian continents were formed by the breakup of Rodinia, an older “Pangea” that existed
at about 750 Ma (McMenamin and McMenamin 1990; Hoffman 1991; Powell et al.
1993; Burrett and Berry 2000). The Rodinian fragments aggregated some time in the
later Vendian time to form a possible short-lived second Precambrian “Pangea.” This
aggregation has been named Pannotia, meaning all the southern continents (Powell
1995), and the term is adopted here despite some controversy (Young 1995). Pan-
notia in turn broke up in latest Precambrian time as a result of the opening of the Ia-
petus Ocean. Most of the Pannotian fragments eventually came together as Wegener’s
classic Pangea of Permo-Triassic age. Less detailed maps spanning this interval have
been produced by Dalziel (1997), and other maps for shorter intervals are available
in the literature (e.g., Scotese and McKerrow 1990; Kirschvink 1992b). The approach
adopted here gives primacy to the paleomagnetic and tectonic data. In this it differs
somewhat from the approach of some other workers—for example, McKerrow et al.
(1992), who use paleoclimate and faunal data as the primary constraints and show
them to be consistent with some of the paleomagnetic data.
It is assumed that the opening of the Iapetus Ocean began at 580 Ma, causing the
breakup of Pannotia. Pannotia’s configuration has been found here by visual re-
assembly of continents that have been oriented initially by their own paleomagnetic
data. Its orientation for the 580 Ma map has been determined by the interpolated
mean 580 Ma pole for Laurentia. Most of West Gondwana is assumed to have been
joined to Laurentia, Baltica, and Siberia at 620 Ma, with East Gondwana lying some-
where offshore. The amount of separation is arbitrary, and Pannotia minus East Gond-
02-C1099 8/10/00 2:02 PM Page 12
PALEOMAGNETICALLY AND TECTONICALLY BASED GLOBAL MAPS
13
wana and some pieces of West Gondwana have been oriented by Laurentian paleo-
magnetic data to make the 620 Ma map. The 540 Ma map is an interpolation between
the 580 Ma reassembly and paleomagnetic data from Laurentia, Baltica, Siberia, and
Gondwana. Paleomagnetic poles from these four continents have been used to make
the 500 Ma and 460 Ma maps.
The incentives for presenting some new maps for late Precambrian to Late Ordo-
vician time include the availability of much new paleomagnetic data; the absence of
a series of global maps for this interval based principally on paleomagnetic and tec-
tonic data; recent novel suggestions about the relationships between Gondwana and
Laurentia during this interval; the substantial revision to the age of the base of the
Cambrian period and other early Paleozoic stratigraphic boundaries; and, of course,
the great interest in the transition from the late Precambrian to the Cambrian periods
as shown by the contributions in this volume.
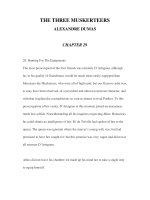
In principle, it is easy to make pre-Mesozoic paleocontinental reconstructions
based on paleomagnetic data: the world is divided into continental fragments that ex-
isted at the time (figure 2.1), and the fragments are oriented by paleomagnetic data
and repositioned longitudinally by a geologic assessment of their relative positions
(Smith et al. 1973). The general geometry of the larger Paleozoic continents is well
known: the largest is Gondwana, consisting of South America, Africa, Arabia, Mada-
gascar, India, Australia, and Antarctica, together with minor fragments on its periph-
ery (such as New Zealand). The northern continents consist of Laurentia, made up of
most of North America, Greenland, and northwestern Scotland; and Baltica, essen-
tially European Russia and Scandinavia. Laurentia and Baltica united in Early Devo-
nian time to form Laurussia (Ziegler 1989). East of Laurussia lay Siberia. In practice,
however, the scarcity and scatter of paleomagnetic data make it difficult to reposition
even major continents in the interval from Vendian to early Paleozoic. Smaller conti-
nental pieces have even less paleomagnetic data, and many other fragments have no
paleomagnetic data at all.
An arbitrary method of repositioning such fragments, adopted here, is to “park”
them in areas at or not too far from the places where they will eventually reach and
where they will not be overlapped. For example, “Kolyma,” currently joined to east-
ern Siberia (and labeled 53 in figure 2.1), collided with Siberia in earlier Cretaceous
time, but its pre-Cretaceous position is unknown (Zonenshain et al. 1990). Seslavin-
sky and Maidanskaya (chapter 3 of this volume) consider that in the Vendian to early
Paleozoic interval Kolyma lay near its present position relative to Siberia. This view is
supported by the presence of very similar Vendian to Cambrian faunas and stratigra-
phy on the outer Siberian platform and on Kolyma itself (Zhuravlev, pers. comm.).
Kolyma is actually a composite of at least three smaller fragments (Zonenshain et al.
1990), but it is unnecessary to show them on global maps, particularly for the 620–
460 Ma interval. Thus Kolyma is simply parked in its present-day position relative to
Siberia with its present-day shape throughout the 460 –620 Ma interval. However,
02-C1099 8/10/00 2:02 PM Page 13
Figure 2.1 All fragments. The shaded areas are the outlines of those frag-
ments from which poles have been repositioned by paleomagnetic and
tectonic data in the interval ~650– 430 Ma. All other fragments have been
oriented by miscellaneous tectonic, faunal, and climatically sensitive data.
Several fragments have been omitted either because they are small (e.g.,
Calabria) or they are younger than 460 Ma (e.g., Iceland). Fragments that
have been arbitrarily “parked” are in italics. The numbered fragments are as
follows: 1, Alaska; 2, Alexander-Wrangellia 1 and 2; 3, Quesnellia; 4, Stikinia;
5, Sonomia; 6, North America; 7, Baja California; 8, Mexico; 9, Yucatan; 10,
Nicaragua-Honduras; 11, Panama; 12, Florida; 13, Carolinas; 14, Carolina
slate belt; 15, Cuba; 16, Haiti–Dominican Republic (Hispaniola); 17, Gander;
18, west Avalon; 19, Meguma; 20, Ellesmere Island; 21, Greenland; 22, west-
ern, central, and eastern Svalbard; 23, northwest Scotland; 24, Grampian;
25, East Avalonia; 26, Armorica; 27, Aquitainia; 28, South Portuguese ter-
rane; 29, Cantabria; 30, Alps; 31, Italy; 32, western Greece and Yugoslavia;
33, Pelagonia; 34, Silesia; 35, Pannonia; 36, Moesia; 37, Balkans; 38, Pontides;
39, Baltica; 40, Barentsia; 41, Turkey; 42, Iran; 43, Afghanistan; 44, Taimyr;
45, Siberia; 46, North Tibet; 47, South Tibet; (46 – 47, repeated, Greater In-
dia); 48, Indo-Burma; 49, western Southeast Asia; 50, Indochina; 51, South
China; 52, North China; 53, Kolyma; 54, Kamchatka; 55, Chukotka; 56, Japan;
57, Philippines; 58, Sulawesi; 59, Papua New Guinea; 60, South America;
61, Chilenia; 62, Precordillera (Occidentalia); 63, Patagonia; 64, Africa; 65,
Arabia; 66, Somalia; 67, Madagascar; 68, India and Sri Lanka; 69, Australia;
70, western New Zealand; 71, eastern New Zealand; 72, Marie Byrd Land;
73, Thurston Island; 74, Antarctic Peninsula; 75, Ellsworth Mountains; 76, East
Antarctica; 77, South Tarim; 78, North Tarim; 79, Qaidam; 80, North Korea;
81, South Korea; 82, Taiwan; 83, Pre-Urals. The Altaids (later amalgamated
into Kazakhstan) and the Manchurides (later amalgamated into Siberia) are
miscellaneous Paleozoic island arcs and related fragments.
02-C1099 8/10/00 2:02 PM Page 14
PALEOMAGNETICALLY AND TECTONICALLY BASED GLOBAL MAPS
15
Cambro-Ordovician faunas of parts of Kamchatka are typically Laurentian at the
species level (Zhuravlev, pers. comm.). Kamchatka has therefore been parked in its
present-day position relative to North America for the 620 –460 Ma interval.
For ease of recognition, the maps show present-day coastlines rather than paleo-
coastlines, which are generally unknown. During the plate tectonic cycle, continen-
tal crust is, to a first approximation, conserved. Thus, the present-day edges of the
continents, taken as the 2,000 m submarine contour, may approximate to the extent
at earlier times and is shown on all the maps.
PALEOMAGNETIC DATA
The paleomagnetic data have been taken from the most recent version of the global
paleomagnetic database of McElhinny and Lock (1996). This is a Microsoft Access
database, giving details of all published paleomagnetic data to 1994.
Time Scale
The time scale used in the paleomagnetic database is that of Harland et al. 1990,
which places the base of the Cambrian at 570 Ma, but new high-precision U-Pb zir-
con dates suggest that it is closer to 545 Ma (Tucker and McKerrow 1995). The prob-
lem of relating the two scales is complicated by the fact that the base of the Tom-
motian was taken as the base of the Cambrian at 570 Ma in Harland et al. 1990. Since
then, the Nemakit-Daldynian has been placed in the Cambrian below the Tommo-
tian, with an age of 545 Ma for its base (Tucker and McKerrow 1995), and the base
of the Tommotian has been placed at 534 Ma (Tucker and McKerrow 1995). The top
of the Early Cambrian is at 536 Ma in Harland et al. 1990 and 518 Ma in Tucker and
McKerrow 1995. It is not clear how best to accommodate these changes: the old
536 Ma has been revised to the new 518 Ma, and the old 570 Ma to the new 534 Ma.
Clearly, some changes are necessary to poles from rocks with stratigraphic ages just
greater than 570 Ma in Harland et al. 1990; here they are assigned to the Nemakit-
Daldynian. According to Harland et al. 1990, the base would have been close to
581 Ma. Fortunately, there are very few poles in this age range in the database. The
new dates also suggest that significant changes should be made to ages assigned to
other Paleozoic stratigraphic boundaries. Thus, all stratigraphically dated poles
whose ages lie in the range 386–581 Ma have been changed in accordance with the
new scale to lie in the range 391–545 Ma. Isotopically dated poles are unchanged.
The changes are similar to those of Gravestock and Shergold (chapter 6 of this vol-
ume). No modifications have been made to ages older than 581 Ma, although the time
scale will undoubtedly change. Knoll (1996) has reviewed the most recent information
and suggests (pers. comm.) that the Varangerian ice age might range from 600 Ma to
about 575–580 Ma.
02-C1099 8/10/00 2:02 PM Page 15
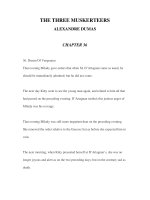
Figure 2.2 Distribution of paleomagnetic sites on the major fragments. Squares are sites of 354 early Paleozoic poles (400 –545 Ma).
Triangles are sites of 50 late Precambrian poles (Ͼ545–640 Ma). Sites in orogenic belts have been included.
02-C1099 8/10/00 2:03 PM Page 16
PALEOMAGNETICALLY AND TECTONICALLY BASED GLOBAL MAPS
17
Data Selection
The main problem with making maps for 620–440 Ma is obtaining reliable paleo-
magnetic data. In particular, if the “quality factor” proposed by Van der Voo (1990),
Q
v
, is set at 3 or more, virtually all poles measured in former Soviet laboratories would
be excluded. For example, a recent list of all Baltica poles considered to be reliable for
the Vendian to early Paleozoic time includes only one such pole (Torsvik et al. 1992).
This approach would remove most of the data from Siberia. But without paleomag-
netic data, it is highly improbable that climatic indicators, faunal distributions, and
the like would have led to the conclusion that Siberia was inverted with respect to
present-day coordinates for most of the interval discussed here. An alternative qual-
ity factor, Q
1
, has also been proposed by Li and Powell (1993).
The approach adopted here has been to apply few selection criteria to the pole list,
in the belief that some intervals would otherwise be dominated by a few high-quality
poles whose magnetization ages may actually be different from the ages assigned to
them. One argument in favor of this approach is that there is no significant difference
in the mean pole position of high and low Q data for poles of the past 2.5 m.y.: only
the scatter of global data increases for lower Q (Smith 1997).
The most important selection criterion used here is that, for the poles selected, the
age of the primary magnetization is considered by the authors to be the same as the
rock age: all magnetic overprints have been excluded. In addition, only one paleo-
magnetic study has been accepted for each rock unit defined in the database. The cri-
teria used to select the “best” study from several on the same unit have included the
number of sites, the scatter of the data, the magnetic tests, and the pole position rel-
ative to other poles of the same age from elsewhere. No attempt has been made to im-
pose additional selection criteria, such as whether poles have been subjected to par-
ticular field or laboratory tests. Poles from ophiolites or from nappes have been
excluded, but other poles from orogenic belts have not been removed, principally be-
cause this would commonly significantly reduce the number of poles available. It is
assumed that most orogenic poles lie in regions where the necessary tectonic correc-
tion—commonly the unfolding of cylindroidal folds—can be reasonably estimated.
Poles with a large age uncertainty have also been eliminated from the pole list, but
the size of the acceptable age uncertainty has been varied with age. Thus, the total ac-
ceptable age uncertainty for poles whose age is less than 500 Ma is taken as 0.2 pole
age, e.g., 400 Ϯ 40 Ma. For poles 500 Ma old or older, the uncertainty has been set
at 100 Ma, i.e., 500 Ϯ 50 Ma. The only exception to this age restriction is poles dated
as ranging in age from the Neoproterozoic (610 Ma) to Cambrian (495 Ma), with an
age range of 115 Ma. The total number of poles on the larger stable fragments in the
650–430 Ma age range is 316, of which only 57 are Precambrian (Ͼ545 Ma) in age.
Their geographic distribution is shown in figure 2.2.
Poles from Gondwana were repositioned with Africa as the reference frame. The
02-C1099 8/10/00 2:03 PM Page 17
18 Alan G. Smith
sources of the rotations for reassembling Gondwana are East Antarctica to Madagas-
car (Fisher and Sclater 1983); Australia to Antarctica (Royer and Sandwell 1989); In-
dia to Antarctica (Norton and Sclater 1979 for age, Smith and Hallam 1970 for rota-
tion); Somalia to Africa and Arabia to Somalia (McKenzie et al. 1970; Cochran 1981);
Sinai to Arabia (LePichon and Francheteau 1978; Cochran 1981); South America to
Africa (Klitgord and Schouten 1986); and Australia to Antarctica (Royer and Sandwell
1989). Laurentia consists of North America, excluding Alaska, Baja California and
fragments within the Appalachians (such as the Carolina slate belt, western Avalonia,
Meguma, Gander), plus Greenland and NW Scotland. The sources of the rotations
for reconstructing Laurentia are Greenland to North America (Roest and Srivastava
1989) and northwest Scotland to North America (Bullard et al. 1965). There are neg-
ligible differences between the positions of the paleomagnetic poles on the reassem-
blies of Gondwana and Laurentia made using the rotations cited above and most oth-
ers that exist in the literature. The rotations for reassembling the smaller fragments
are based on interpretations of the geologic and faunal data, discussed below.
The basic assumption for making global reconstructions from paleomagnetic data
is that the continents can be treated as rigid bodies and rotated accordingly. To a very
good approximation, Precambrian shields and continental platforms have behaved as
rigid bodies since they formed, but younger orogenic belts on their peripheries clearly
have not. Paleomagnetic data from foldbelts can be restored reasonably precisely to
their original orientation (see above). When orogenic deformation becomes penetra-
tive, as in regional metamorphism, or when plutonism takes place, the repositioning
errors become much larger. Areas affected by such deformation have simply been left
attached to the platform or cratonic areas of each continent with their present-day
shapes. They have not been distinguished on the maps.
In some cases, what was previously regarded as a continental fragment may have
been everywhere affected by deformation. For example, Paleozoic Kazakhstan is in
reality an amalgam of several island arcs and microcontinents that have collided with
one another through Paleozoic time to form the Altaids (Zonenshain et al. 1990; S¸en-
gör and Natal’in 1996). It is clearly necessary to show all such areas on global maps.
The immensely complex evolution of Kazakhstan, Mongolia, and adjacent areas of Pa-
leozoic Asia has been attributed to an underlying fundamental simplicity by S¸engör
and Natal’in (1996), but as they acknowledge in the title of their fascinating analysis,
for these areas there exists at present only the “fragments of a synthesis.” A quite dif-
ferentsynthesis for PaleozoicAsia has been proposed byMossakovskyetal.(1994).The
outlines of the Altaid and Manchurid fragments recognized by S¸engör and Natal’in
(1996) are shown on all the maps. Because there is no agreement on the location of
these fragments, they have been “parked” with their present-day shapes and positions
unchanged relative to present-day stable Siberia (the Siberian and adjacent platforms).
Similar complexities exist elsewhere. For example, Powell et al. (1994: figure 11) sug-
gest that the eastern limit of Precambrian rocks in Australia may have had a rectilin-
02-C1099 8/10/00 2:03 PM Page 18
PALEOMAGNETICALLY AND TECTONICALLY BASED GLOBAL MAPS
19
ear form, reflecting a ridge-and-transform system created during breakup of the con-
tinent in late Precambrian time, but this boundary has not been shown on the maps.
It is also necessary to remove all new areas, like Iceland and Afar, which have been
created by mantle plumes and clearly did not exist in Paleozoic time. Apart from these
exceptions it is not at the moment practicable to take into account the possible growth
in continental area that may have taken place in orogenic belts since 620 Ma. The to-
tal volume of new crust might be as much as 80 ϫ 10
6
km
3
(Howell and Murray
1986), equivalent to an area of about 27 ϫ 10
6
km
2
, or about 15 percent of the pres-
ent total continental area. The new crust is concentrated in those regions that are in
any case difficult to reposition.
APPARENT POLAR WANDER PATHS
The apparent motion of the mean magnetic pole relative to a continent is the appar-
ent polar wander path of that continent, or its APWP. In reality, of course, the conti-
nent is wandering relative to the pole. The Mesozoic and Cenozoic motions of large
continents are generally smooth for periods of tens of millions of years (figure 2.3).
Discontinuities in motion may accompany continental breakup or collision, giving rise
to relatively abrupt changes in direction of an APWP. The APWPs assume the geo-
centric axisymmetric dipole field model—the magnetic field of a centered bar mag-
net parallel to the earth’s spin axis. The present-day, Cenozoic, and Mesozoic fields
show relatively small departures from such a model (Livermore et al. 1983, 1984).
Such effects undoubtedly existed in late Precambrian and early Paleozoic time, but the
errors involved in ignoring them are considered to be much smaller than the likely
errors in the late Precambrian and early Paleozoic mean poles.
APWPs for the 620 –460 Ma period were calculated at 20 m.y. intervals for Lau-
rentia, Gondwana, Baltica, and Siberia from the 316 poles selected from the database.
All poles whose nominal age lay within 30 m.y. of the required age—i.e., in a “win-
dow” of 60 m.y.duration—were included. Inspection of the data showed that 40 poles
lay more than 60Њ from their relevant APWP. These deviant poles were removed, and
the APWPs were recalculated for the same intervals. In this recalculation all poles ly-
ing more than 40Њ from the new APWPs were excluded from mean pole calculations.
All the resulting APWPs showed segments with features that are absent from Meso-
zoic and Cenozoic APWPs: they were highly irregular or had very high rates of change
of pole position (Ͼ100 mm /y) or tracked back on themselves at high rates (figure 2.3).
It is assumed that such features reflect aberrations in the Paleozoic and Neoprotero-
zoic paleomagnetic data rather than reflecting some fundamental change in the be-
havior of the earth for this period, e.g., a nonaxisymmetric field or a field with high
nondipole components, very high rates of plate motions (Gurnis and Torsvik 1994),
large components of “true” polar wander, or a marked change in obliquity or climate.
These uniformitarian assumptions suggest that mean poles that give rise to irregular
02-C1099 8/10/00 2:03 PM Page 19
20 Alan G. Smith
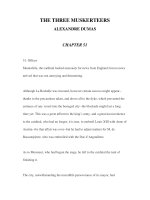
Figure 2.3 North-pole polar wander paths for
Laurentia, Siberia, Gondwana, and Baltica on
an azimuthal north-polar projection with a
latitude-longitude grid at 30Њ intervals. To
avoid overlaps, the APWP for Laurentia has
been rotated clockwise by 90Њ, and the APWP
for Baltica has been rotated by 180Њ. For clar-
ity, the confidence limits have been omitted.
The paths start at the present day and have
been drawn back to the later Neoproterozoic.
The symbols show mean poles at intervals of
20 m.y. for “time windows” of 60 m.y. Ages
have been given to the poles closest to 200 Ma
and 400 Ma and for poles spanning the 460–
620 Ma interval, except for Baltica and Gond-
wana, which have been truncated at 575 Ma
and 590 Ma, respectively. The poles for the
0–250 Ma interval are global mean poles that
include data from all the stable continents,
which have been repositioned using Euler rota-
tions from the ocean floor. For Siberia and
Gondwana the poles that are older than 250 Ma
are, respectively, from only Siberia and Gond-
wana. Laurentia and Baltica poles are combined
back to 420 Ma, but older poles are, respec-
tively, from only Laurentia and Baltica.
The backtracking of the Baltica APWP from
477 Ma to 575 Ma is believed to reflect remag-
netization. Gondwana was finally assembled at
about 550 Ma: older mean poles progressively
reflect the mean pole of the fragments from
which Gondwana was built rather than poles
of a single continent. The Siberian APWP
shows a major discontinuity after 519 Ma,
possibly reflecting remagnetization. The only
Laurentian mean poles older than 509 Ma that
are based on 6 or more poles, all of which lie
less than 40Њ from the mean pole, are those for
590 and 719 Ma.
The mean poles used for paleomagnetic in-
terpolation for the maps (figure 2.3) are shown
as small filled symbols. All other poles either
lie outside the 460–620 Ma interval or are ig-
nored. The larger filled symbols labeled SIB
(Siberia), GOND (Gondwana), LRNT (Lauren-
tia), and BLT (Baltica) are the positions of the
north pole on the 580 Ma Pannotian reassem-
bly. The mean paleomagnetic pole for Lauren-
tia coincides with its geographic north pole
because Laurentia data have been used to posi-
tion the Pannotian reassembly into its paleo-
latitude grid. If the Pannotian reassembly
reflects reality, then the poles from Siberia,
Gondwana, and Baltica should coincide with
the 580 Ma mean paleomagnetic pole for these
fragments.
02-C1099 8/10/00 2:03 PM Page 20
PALEOMAGNETICALLY AND TECTONICALLY BASED GLOBAL MAPS
21
APWP features, to high rates of change of pole position, or to backtracking should be
ignored in any reconstructions. The end result is a series of mean poles that produce
reasonably smooth APWPs from which the Euler rotations needed to reposition the
continents can be calculated.
Laurentia
The best paleomagnetic data are considered to be from Laurentia: it has the most nu-
merous data but the fewest poles that lie more than 60Њ off the initial APWP. Although
data exist for Laurentia for most of the Cambrian and Neoproterozoic periods, the
mean pole for 509 Ma is the oldest pole to have more than 30 determinations in the
60 m.y. window. Of the other poles, only the poles for 590 Ma and 719 Ma all lie
within 40Њ of the mean pole and include 6 or more determinations. The positions of
the other mean poles form zigzags on the APWP and have been rejected. With such
large interpolation intervals, the Cambrian-to-Neoproterozoic motion of Laurentia is
inevitably very smooth, possibly misleadingly so. The Pannotian reassembly is placed
in a global paleolatitude frame by interpolating between the 509 Ma and 590 Ma mean
Laurentian poles rather than using any other paleomagnetic data. Except for West
Gondwana (see below), the 620 Ma (figure 2.4e) reconstruction is identical to that for
580 Ma (figure 2.4d) and is oriented by interpolating between the 590 and 719 Ma
Laurentian mean poles.
Baltica
Paleomagnetic data from three different areas of Baltica currently offer three distinct
solutions to the problem of where Baltica was in earlier Paleozoic and latest Precam-
brian time. Zonenshain et al. (1990: figure 12) show Baltica at 600 Ma to be lying on
its side, with Scandinavia facing west, in the latitude belt 0 –30Њ south. Torsvik et al.
(1992) show Baltica at 560 Ma to be inverted, with Scandinavia facing east, also in the
Southern Hemisphere in the latitude belt 20 –50Њ. By contrast, E
˚
lming et al. (1993:
figure 6I) show Baltica at 600 Ma to be in a similar orientation, but they place it in
the latitude range 40 –70Њ north. The data selected from the database, which include
data from all three areas, place Baltica in the latitude range of about 0 –30Њ north at
560 Ma, and in the range of 30 –60Њ north at 600 Ma. It is not clear how to assess these
data, although Torsvik (pers. comm.) considers it likely that the earlier Cambrian So-
viet poles from Baltica have been remagnetized. This view is supported by the back-
tracking of the Baltica APWP for poles older than 477 Ma over the younger part of the
same path (see figure 2.3). The remaining non-Soviet poles are too few to give a reli-
able late Precambrian to Cambrian APWP for Baltica. Acceptable mean poles exist for
458 Ma and 477 Ma. Interpolation gives the 460 Ma position (figure 2.4a). Baltica’s
position on the 500 Ma and 540 Ma maps (figures 2.4b,c) is obtained by linearly in-
terpolating the difference between the Euler rotation for the 477 Ma pole and the Euler
02-C1099 8/10/00 2:03 PM Page 21
22 Alan G. Smith
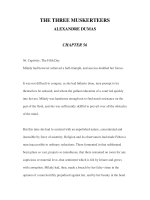
Figure 2.4 Global reconstructions for (a) 460 Ma,
(b) 500 Ma, (c) 540 Ma, (d) 580 Ma, and (e) 620 Ma.
All reconstructions show the present-day coastline
(for ease of recognition) and the present-day 2,000-
meter submarine contour (to indicate the approxi-
mate extent of continental crust). The ages corre-
spond to the time scale used in this chapter and dif-
fer slightly from those of Gravestock and Shergold
(this volume).
A
B
02-C1099 8/10/00 2:03 PM Page 22
PALEOMAGNETICALLY AND TECTONICALLY BASED GLOBAL MAPS
23
Figure 2.4 (Continued)
C
D
02-C1099 8/10/00 2:03 PM Page 23
24 Alan G. Smith
Figure 2.4 (Continued)
E
rotation for the visually determined position on Pannotia at 580 Ma (figure 2.4d). Bal-
tica’s Cambrian to Neoproterozoic motion is smooth because of this long interpola-
tion interval.
Siberia
Siberia must be repositioned almost entirely by Soviet paleomagnetic data. Removal
of all magnetically untested poles from the database does not significantly alter the
mean poles. There is no evidence that the poles for 452 Ma to 519 Ma have been re-
magnetized: this part of the APWP is reasonably smooth. There is an abrupt change
in direction and in the rate of change of pole position to the next mean pole at 572 Ma
and all others to 638 Ma (see figure 2.3), which may reflect remagnetization. There
are 19 or more poles in each 20 m.y. step from 440 Ma to 540 Ma. Only about 10 per-
cent of the poles lie more than 40Њ from the APWP. The APWP shows an inverted Si-
beria moving steadily from moderate southerly latitudes in earlier Cambrian time to
lower latitudes in Ordovician time. Siberia is positioned by paleomagnetic data
for the 460 Ma and 500 Ma maps (figures 2.4a,b). For the 540 Ma map (figure 2.4c),
its position has been interpolated between the 519 Ma mean pole and its visually
estimated position within Pannotia (see the section “Gondwana” below). The 540 –
460 Ma positions are similar to those given by Smethurst et al. (1998), based on a
more recent analysis of the data.
02-C1099 8/10/00 2:03 PM Page 24
PALEOMAGNETICALLY AND TECTONICALLY BASED GLOBAL MAPS
25
Gondwana
Reasonable mean poles exist for 442, 470, and 482 Ma. Between one-fifth and one-
third of the poles for the 500, 520, 540, 560, and 580 Ma calculations lie more than
40Њ from the APWP. The ages of the mean poles in these intervals are 504, 518, 533,
559, and 576 Ma, respectively. The 559 and 576 Ma mean poles are considered too
close in time to the visually determined 580 Ma position and have been omitted (see
figure 2.3). It is interesting to note that the 590 Ma mean pole (from the 600 Ma cal-
culation) is surprisingly close to that implied by the visual reassembly of Pannotia.
Gondwana’s position on the 460 Ma (figure 2.4a) and 500 Ma (figure 2.4b) maps is
given by interpolation between poles that are relatively close in time. The 540 Ma po-
sition (figure 2.4c) is an interpolation between the 533 Ma mean pole and the visu-
ally estimated 580 Ma position. As noted below (in “Faunal and Climatic Evidence:
Archaeocyaths and Gondwana”), there is a significant discrepancy between the paleo-
latitudes implied by the interpolated mean pole for 540 Ma and the archaeocyath evi-
dence. Eastern Gondwana was still in the process of being joined to western Gond-
wana until about 550 Ma (Unrug 1997). The 620 Ma map (figure 2.4e) shows eastern
Gondwana as a distinct entity, but its position is schematic rather than being based
on paleomagnetic data. A summary of the methods used to make the maps is given
in figure 2.5.
CONTINENTAL MARGINS
The evolution of the continental margins around each continent is of fundamental im-
portance in estimating longitudinal separations of the continents. In the simplest plate
tectonic cycle, a continent splits and separates into two or more continents, each of
which eventually collides to form a continent similar to the original continent. In
more-complex cases, a continent may split into several fragments, some or all of
which might collide with continents different from the one they originally separated
from. The age at which two continents separate can be estimated relatively precisely
by applying the lithospheric stretching model (McKenzie 1978) to the stratigraphic
sequences formed on each margin, even in orogenic belts (Wooler et al. 1992). In the
absence of quantitative analyses, the time of separation may be difficult to estimate.
Extensional faulting that preceded the formation of ocean floor and the separation of
two continents may span some tens of millions of years, as in the present East African
rift. The succeeding thermal phase, during which the margin subsides and the post-
rift passive margin sequence accumulates, continues until collision takes place. Flex-
ure of the margin prior to actual collision gives rise to a characteristic time-subsidence
signature.
02-C1099 8/10/00 2:03 PM Page 25
26 Alan G. Smith
02-C1099 8/10/00 2:03 PM Page 26
PALEOMAGNETICALLY AND TECTONICALLY BASED GLOBAL MAPS
27
Times of Passive Margin Formation
The time interval of interest here, from Neoproterozoic to Late Ordovician (620 –460
Ma) includes two important episodes of passive margin formation. The first is of lat-
est Proterozoic to Early Cambrian age (Bond et al. 1984) and gave rise to passive mar-
gin sequences in western North America and Arctic North America (Trettin 1991;
Trettin et al. 1991); North Greenland (Higgins et al. 1991); East Greenland (Williams
1995) and eastern North America (Hatcher et al. 1989; Williams 1995); western
Baltica (Gee 1975; Gayer and Greiling 1989); northeastern Siberia (Pelechaty 1996);
Iran, Turkey, and Pakistan; northwestern Australia; and western South America (Dalla
Salda et al. 1992a; Astini et al. 1995). If the Precordillera (Occidentalia) is a fragment
of eastern North America (see the section “Positions of Smaller Fragments Around the
Larger Continents: Gondwana” below), it probably broke off in Early Cambrian time
after North America itself had separated from South America.
The precise time of passive margin formation is uncertain. The Cambro-Ordovi-
cian carbonate platforms of Laurentia show that a passive margin existed there in
Early Cambrian time, but could it have originated significantly earlier, as suggested
by dyke swarms (Bingen et al. 1998)? Clastic sequences conformably underlie the
carbonates and are in turn unconformable on significantly older rocks. In the litho-
spheric stretching model, the thermal phase follows immediately on the stretching
phase without a time break. In the model there may be unconformities between the
sediments deposited during faulting and those deposited later, but there is no time
gap between the cessation of faulting and the onset of the thermal phase. Thus, the
Laurentian and other passive margin sequences that lack faulting probably lie outside
the zone of stretched continental crust and may correspond to onlapping sequences
that are somewhat younger than the age of the oldest ocean floor with a “steer’s head”
geometry commonly found beyond the margins of zones of continental stretching
(White and McKenzie 1988).
Detailed analysis of some of the passive margin sequences of western Baltica sug-
gests that breakup may have been contemporaneous with the deposition of Vendian
tillites (Greiling and Smith, n.d.), with ocean-floor spreading beginning at about
580 Ma, a value similar to that adopted by Torsvik et al. (1996).
The second episode of passive margin formation is of Early Ordovician age and
created passive margins on the eastern edge of Baltica (Zonenshain et al. 1990) and
northwestern Gondwana (Pickering and Smith 1995).
Figure 2.5 Summary of methods used to
make figures 2.4a–e. Black areas are large con-
tinents oriented by paleomagnetic data (Lau-
rentia, Baltica, Siberia, and Gondwana, to
which smaller fragments have been attached
using visual, tectonic, and faunal data). Gray
areas are large continents and their attached
fragments that have been repositioned by inter-
polation between a paleomagnetically defined
orientation and a visually defined fit (Baltica
on the 540 Ma map) or by visual estimates
alone (most of the fragments on the 580 Ma
and 620 Ma maps).
02-C1099 8/10/00 2:03 PM Page 27
28 Alan G. Smith
Times of Continental Collision
Collisions took place during the 620–460 Ma interval. East Gondwana (India, East
Antarctica, and most of Australia), together with the Arabian-Nubian shield and the
Kalahari-Grunehogna cratons of southeastern Africa, had consolidated by 630 Ma
and formed a stable nucleus to which the remaining components of West Gondwana
were added during the 630 –550 Ma interval (Unrug 1997).
Barentsia collided with northern Baltica to cause the Timan orogeny in later Ven-
dian time (Zonenshain et al. 1990: figure 14). Puchkov (1997) summarizes additional
evidence for the continuation of the same collisional orogen, with an age of about
630–570 Ma, southward along the Uralian margin of Baltica as the Pre-Uralides; for
amphibolites and collisional granites dated at 625–560 Ma in northern Taymir on the
Arctic coast of Siberia; and for Late Vendian metamorphic dates ranging from 621 to
556 Ma in Spitsbergen. Eastern Baltica may have collided at this time with a conti-
nental fragment (Zonenshain et al. 1990:15).
Western Baltica collided with island arcs in Ordovician time to cause the Finn-
markian orogeny; the contemporaneous Taconic orogeny of eastern Laurentia is re-
garded here as the result of a collision between eastern Laurentia and other island arcs
(Bird and Dewey 1970; Pickering and Smith 1995; Niocaill et al. 1997) rather than
as a continent-continent collision between Gondwana and Laurentia (Dalla Salda et al.
1992a,b; Dalziel et al. 1994). The Precordillera, regarded here as a fragment of eastern
Laurentia (see the section “Positions of Smaller Fragments Around the Larger Conti-
nents: Gondwana” below), may have collided with South America in Early Ordovician
time (Astini et al. 1995). Its collision as a fragment may have caused the Famatinan
orogeny of Argentina, rather than having been part of a continent-continent collision
between Gondwana and Laurentia (Dalziel et al. 1994), a view modified subsequently
by Dalziel (1997).
Younger Paleozoic collisions are useful for constructing the maps because they
show which continents were approaching one another in earlier Paleozoic time when
there may be no other relevant data. For example, in Silurian time the approach of
continental fragments originally on the edge of Gondwana and Laurentia caused the
early phases of the Acadian orogeny (Williams 1995). Western Baltica and eastern
Greenland were probably essentially sutured in Late Silurian time in the late stages of
the Caledonian orogeny (Higgins 1995). Arctida (Alaska and Chukotka) first collided
with Arctic Canada and North Greenland at about the same time (Zonenshain et al.
1990: figure 191), but in both areas deformation continued until early Carboniferous
time (Trettin 1991).
The longitudinal positions of Laurentia, Baltica, Siberia, and Gondwana are shown
on the maps. There is no “absolute” reference frame for pre-Mesozoic global recon-
structions such as is given by the hot-spots reference frame for Mesozoic and Ceno-
zoic time. Hot spots, or hot mantle areas, have been recognized (Zonenshain et al.
1990) but at present provide only a limited local reference frame.
02-C1099 8/10/00 2:03 PM Page 28
PALEOMAGNETICALLY AND TECTONICALLY BASED GLOBAL MAPS
29
460 Ma to 580 Ma
North America is kept close to northwestern South America in a position that allows
the two continents to join together eventually at 580 Ma without very large strike-slip
motions. It must be noted that Kirschvink (1992b) has proposed quite a different set
of reconstructions in which Baltica is always in its conventional position east of Lau-
rentia, but Siberia is inserted between eastern Gondwana and western Laurentia.
The width of the Iapetus Ocean between Baltica, Siberia, and Laurentia is arbitrary,
but the maps attempt to show the opening and closing of the Iapetus Ocean in a
plausible manner. Baltica moves away from Laurentia until about 500 Ma, when
the earliest phase of Caledonian deformation (Finnmarkian) began (Andréasson
and Albrecht 1995). It is assumed that this phase represents the beginning of the clo-
sure of the Iapetus Ocean between Laurentia and Baltica, with eventual collision at
420 Ma.
580 Ma
Laurentian paleomagnetic data have been used to orient Pannotia (figure 2.4d), but
its reassembly is visual. The first two pieces that have been joined together in the Pan-
notia jigsaw are Gondwana and Laurentia. The join is along the southeastern margin
of North America and the western margin of South America and is discussed in more
detail below. In Cambrian time the East Greenland margin of Laurentia (Higgins 1995)
is believed to have been a passive continental margin formed by continental breakup
in late Precambrian time (Kumpulainen and Nystuen 1985; Schwab et al. 1988), as
was the western Baltica margin (Gee 1975; Gayer and Greiling 1989).
The Neoproterozoic successions of East Greenland appear significantly different
from those in western Baltica (Kumpulainen and Nystuen 1985). These authors sug-
gest that the Grenville “front” in North America can be correlated with the Sveconor-
wegian “front” in southern Scandinavia. This front provides a line on each continent
at a high angle to the continental margins. When matched, Baltica has a more southerly
position relative to Laurentia than it had in Devonian time. A more recent fit of Ar-
chean and early Proterozoic provinces gives a similar position (Condie and Rosen
1994). There are as yet no agreed precise “piercing points” such as might be provided
by giant dyke swarms (Ernst and Buchan 1997). Baltica has been repositioned here
by visually fitting it to an aggregate of northern South America and Laurentia inde-
pendently of, but in agreement with, the geologic evidence.
Figure 2.4c shows Chukotka and Alaska against the present-day continental margin
of northern North America and Ellesmere Island. This reassembly is based on a pos-
sible Mesozoic reconstruction of the Arctic Ocean. It is assumed that the Chukotka-
Alaska fragment underwent earlier periods of collision and separation and includes
the late Vendian to early Paleozoic conjugate margin of northern North America.
There is still no conjugate margin for the more northerly half of East Greenland. It is
02-C1099 8/10/00 2:03 PM Page 29
30 Alan G. Smith
assumed here that Siberia, with Kolyma attached, fulfilled that role (but see below for
an alternative view). It too has been visually fitted against Laurentia.
There are several similar suggestions for Siberia’s position in Pannotia and Rodinia.
Condie and Rosen (1994) suggest that at ~800 Ma the Verkhoyansk margin of Sibe-
ria—its eastern margin—was joined to the Franklin margin of North America and
North Greenland. By contrast, Hoffman (1991) places the northern margin of Siberia
against these two continents at ~700 Ma, a reconstruction supported by Pelechaty
(1996) for the whole of the 700–550 Ma interval.
Clearly, Siberia’s position in the Pannotian reassembly is not well established. For
example, the conjugate margin for northeastern Greenland may be along the margin
of another fragment such as Barentsia, as sketched by Condie and Rosen (1994). Were
this the case, then the longitudinal uncertainty of paleomagnetic data permits entirely
different reconstructions. For example, the Cryogenian / Vendian to Cambrian/Or-
dovician maps of Kirschvink (1992b: figures 12.6–12.11) show Siberia lying between
the eastern margin of East Gondwana and the western margin of Laurentia.
That Siberia may not have been attached to any part of Laurentia at 580 Ma is
suggested by Jaccards coefficients of similarity for Vendian–Early Cambrian faunas,
which show no similarity before late Early Cambrian between Siberia and Laurentia
but a progressive increase in similarity during this and subsequent periods (Zhu-
ravlev, pers. comm.). In addition, Siberian faunas appear to be more similar to some
faunas from China than to coeval faunas from Laurentia and Baltica. These data sug-
gest that alternative 540 –620 Ma reconstructions are ones in which Siberia is closer
to China than shown in figures 2.4c–e. There is no conflict with the paleomagnetic
data, but the tectonic data seem to require the creation of passive margins in Siberia
that have no obvious conjugate counterpart and appear inconsistent with conver-
gence between Siberia and Laurentia for this interval.
620 Ma
Gondwana was still being assembled at 620 Ma (Unrug 1997). East Gondwana (East
Antarctica, India, and most of Australia) had been joined to Madagascar and to the
Kalahari-Grunehogna craton of southeastern Africa since 1000 Ma. The Arabian-
Nubian shield was joined to it by 630 Ma, but parts of West Gondwana were proba-
bly undergoing the final stages of consolidation with, for example, subduction still
continuing in the western Tuareg shield of the central Sahara (Black et al. 1994).
The remainder of West Gondwana, including the Amazonian, West African, Congo,
and smaller shields probably formed a continental mosaic set in relatively small oceans
that was colliding with Laurentia and the East Gondwana unit.
The 620 Ma map (figure 2.4e) shows Laurentia, Siberia, and Baltica, to which the
components of the continental mosaic of West Gondwana have been added as a unit,
rather than being separated. The result has been oriented by Laurentian paleomag-
02-C1099 8/10/00 2:03 PM Page 30
PALEOMAGNETICALLY AND TECTONICALLY BASED GLOBAL MAPS
31
netic data. The East Gondwana–Arabia–southeastern Africa unit has been given an
arbitrary separation from the first major unit.
The finite rotations used to reposition the major continents are listed in table 2.1.
For brevity the pole lists used and the resulting APWPs have not been included.
POSITIONS OF SMALLER FRAGMENTS
AROUND THE LARGER CONTINENTS
Laurentia
The western margin of Laurentia has had several terranes added to it in Mesozoic time,
mostly in Canada and Alaska (Gabrielse et al. 1992: figure 2.6; Saleeby and Busby-
Spera 1992: plate 5). Five of the largest are schematically shown on the maps: Ques-
nellia, Stikinia, Alexander-Wrangellia 1 and 2, and Sonomia. Carter et al. (1992: fig-
ure 2.10) postulate that in early Carboniferous time some of these fragments may
have lain quite close to Australia and migrated several thousand kilometers east by
Table 2.1 Rotations for Major Continents
LATITUDE LONGITUDE ANGLE
460 Ma
North America 0.0 38.1 67.2
Africa 2.6 105.1 122.7
Siberia 23.1 81.5 133.0
Baltica Ϫ15.4 69.5 84.9
500 Ma
North America 0.0 53.0 67.9
Africa 11.9 112.6 124.0
Siberia 18.0 85.7 141.4
Baltica Ϫ13.0 87.1 97.5
540 Ma
North America 0.0 59.1 87.4
Africa 27.1 114.7 118.4
Siberia 6.2 83.4 137.7
Baltica Ϫ14.1 93.6 116.3
580 Ma
North America 0.0 58.8 110.8
Africa 34.7 127.5 155.5
Siberia Ϫ3.1 72.3 144.7
Baltica Ϫ14.8 98.8 135.7
620 Ma
North America 0.0 62.1 108.6
Africa 33.3 129.4 159.6
Siberia Ϫ4.1 75.0 143.1
Baltica Ϫ15.8 101.8 134.8
02-C1099 8/10/00 2:03 PM Page 31
32 Alan G. Smith
Late Permian time. Their positions on the maps simulate the suggestions of Gabrielse
et al. (1992: figure 2.6) and Miller et al. (1992: plate 6) for later Mesozoic time, ex-
cept that the terranes have been arbitrarily parked in these positions against the west-
ern North American margin for the whole of the 620 –460 Ma interval.
What was joined to the western Laurentian margin in latest Precambrian time is un-
clear. Bell and Jefferson (1987) suggested that ~1200 Ma ago the eastern Australian
margin was joined to the western Canadian margin. A logical extension of this hy-
pothesis was made by Dalziel (1991) and Moores (1991), who speculated that parts
of East Gondwana had been joined to the western United States. Breakup is suggested
to have occurred at ~750 Ma, long before the beginning of Vendian time. If breakup
did occur at 750 Ma, then the second breakup episode, which began at about 625 Ma
near the beginning of the Vendian (Bond et al. 1984), created the early Paleozoic pas-
sive margin of the western United States. Possible conjugates include Siberia (Kirsch-
vink 1992b) and South China (Keppie et al. 1996). The model of Hoffman (1991) for
Laurentian margins is more wide-ranging but is not discussed in detail here.
Baja California, Mexico, Yucatan, and Nicaragua have been kept attached in the
early Mesozoic positions. The Appalachian fragments (see figure 2.1) form part of
western Avalonia (see the section “Gondwana” below).
Zonenshain et al. (1990) have sketched a possible early Paleozoic evolution of the
Arctic region. It includes the two fragments “Arctida” and “Barentsia.” Arctida is the
name of the amalgamated Alaskan and Chukotkan fragments. Barentsia is the name
for the continental fragment north of the Timan orogenic belt, active in Vendian to
Early Cambrian time. Where Barentsia was located prior to the Timan orogeny is not
known: it has arbitrarily been separated from Baltica along with the Pre-Uralides on
the 620 Ma map. Similarly, the position of Arctida prior to its Late Silurian collision
with Arctic North America and North Greenland is not well constrained. On figures
2.4a–e it has been joined to northern North America throughout the 620 –460 Ma
interval.
Baltica and Siberia
Except possibly for Spitsbergen, Timan, and the Pre-Uralide margins, Baltica was bor-
dered by passive margins in earlier Vendian time or joined to another continent (Zo-
nenshain et al. 1990). The Uralian margin of Baltica was deformed and metamor-
phosed in latest Vendian or Cambrian time (Zonenshain et al. 1990: figures 36 and 45;
Puchkov 1997). The deformation is attributed to collisions with island arcs and micro-
continents, probably originally forming part of Siberia (Zonenshain et al. 1990:41).
Here it is assumed that the Pre-Uralides and Barentsia were joined at about 620 Ma
and had collided (or were in the process of colliding) with Baltica (see figure 2.4e).
By 580 Ma it is assumed that Pre-Uralides–Barentsia had collided with Baltica, giving
rise to the orogenic belt that affected the Pre-Uralides and Barentsia and somehow in-
02-C1099 8/10/00 2:03 PM Page 32
PALEOMAGNETICALLY AND TECTONICALLY BASED GLOBAL MAPS
33
volved Spitsbergen and Taimyr, i.e., extending along the length of the Uralian mar-
gin of Baltica and possibly beyond to Arctida. The detailed kinematics of this orogenic
belt are presently obscure. An alternative view is that there was a collision with some
fragments of Avalonia (Puchkov 1997).
During the 620 –460 Ma interval, eastern Baltica and all except northern Siberia
(present coordinates) were bordered by back-arc basins, island arcs, and microconti-
nents (Zonenshain et al. 1990; S¸engör et al. 1993; Mossakovsky et al. 1994; S¸engör
and Natal’in, 1996) that resembled the present-day western Pacific. Figures 2.4a–e
show the tectonic elements recognized by S¸engör et al. (1993) and S¸engör and Na-
tal’in (1996) attached in their present-day positions relative to Siberia but do not at-
tempt to reproduce their evolution.
Gondwana
South America today includes several “terranes” that were probably elsewhere in early
Paleozoic time. Their positions on figures 2.4a–e are intended only to suggest a pos-
sible evolution. Other models suggesting differing possible extents, shapes, and evo-
lution are reviewed by Dalziel (1997). Three terranes are shown on the maps: Pata-
gonia, the Precordillera terrane (or Occidentalia), and Chilenia (Ramos et al. 1986;
Ramos 1988). Patagonia is considered here to have collided with the rest of South
America in Carboniferous time, but because there are no ophiolites and no obvious
suture, this orogenic belt may not reflect a collision (Dalziel, pers. comm.). The Pre-
cordillera may have been an elongate fragment that started life on the edge of south-
eastern Laurentia (Dalla Salda et al. 1992a,b; Dalziel et al. 1994; Astini et al. 1995;
Dalziel and Dalla Salda 1996; Thomas and Astini 1997; Keller 1999) and may have
collided with South America during Arenig-Llanvirn time (Astini et al. 1995). How-
ever, alternative models, reviewed by Dalziel (1997), exist. Chilenia is a second elon-
gate fragment that collided with the Precordillera in the later Carboniferous (Astini
et al. 1995; Pankhurst and Rapela 1998). Apart from the geometric requirement of
avoiding overlap, there are few constraints on the relative positions of Patagonia and
Chilenia prior to collision. For simplicity it is assumed that they were joined together
as a single fragment that lay somewhere off Antarctica, where they have been parked
for most of the Vendian period.
Several large continental fragments that now lie in eastern North America were
originally attached to northwestern Gondwana (mostly Africa). They constitute the
Avalon zone, named after the Avalon Peninsula in southeastern Newfoundland (Wil-
liams et al. 1974; Williams 1995). Here, late Precambrian sediments and volcanics are
overlain by Cambro-Ordovician shales and sandstones, rather than the platform car-
bonates of Laurentia. Similar rocks can be recognized in the Appalachians as far south
as the Carolina slate belt and across the Atlantic in Wales, Brittany, Iberia, northwest-
ern Africa, and parts of central Europe (Pickering and Smith 1995). Avalonia is used
02-C1099 8/10/00 2:03 PM Page 33