Insect Ecology - An Ecosystem Approach 2nd ed - Chapter 5 pot
Bạn đang xem bản rút gọn của tài liệu. Xem và tải ngay bản đầy đủ của tài liệu tại đây (769.65 KB, 30 trang )
A POPULATION IS A GROUP OF INTERBREEDING MEMBERS
of a species. A number of more or less discrete subpopulations
may be distributed over the geographic range of a species
population. Movement of individuals among these “demes”
(composing a “metapopulation”) and newly available resources
compensate for local extinctions resulting from disturbances or
biotic interactions (Hanski and Gilpin 1997). Populations are
characterized by structural attributes, such as density; dispersion pattern; and age,
sex, and genetic composition (Chapter 5) that change through time (Chapter 6)
and space (Chapter 7) as a result of responses to changing environmental
conditions.
Population structure and dynamics of insects have been the subject of much
ecological research. This is the level of ecological organization that is the focus of
evolutionary ecology, ecological genetics, biogeography, development of sampling
methods, pest management, and recovery of endangered species. These
disciplines all have contributed enormously to our understanding of population-
level phenomena.
Abundance of many insects can change orders of magnitude on very short
time scales because of their small size and rapid reproductive rates. Such rapid
and dramatic change in abundance in response to often-subtle environmental
changes facilitates statistical evaluation of population response to environmental
factors and makes insects useful indicators of environmental change. The
reproductive capacity of many insects enables them to colonize new habitats and
exploit favorable conditions or new resources quickly. However, their small size,
II
SECTION
POPULATION
ECOLOGY
005-P088772.qxd 1/24/06 10:40 AM Page 123
short life span, and dependence on chemical communication to find mates at low
densities limit persistence of small or local populations during periods of adverse
conditions, frequently leading to local extinction.
Population dynamics reflect the net effects of differences among individuals in
their physiological and behavioral interactions with the environment. Changes in
individual success in finding and exploiting resources, mating and reproducing,
and avoiding mortality agents determine numbers of individuals, their spatial
distribution, and genetic composition at any point in time. Population structure is
a component of the environment for the members of the population and provides
information that affects individual physiology and behavior, and hence fitness (see
Section I). For example, population density affects competition for food and
oviposition sites (as well as other resources), propensity of individuals to disperse,
and the proximity of potential mates.
Population structure and dynamics also affect community structure and
ecosystem processes (Sections III and IV). Each population constitutes a part of the
environment for other populations in the community. Changes in abundance of
any one species population affect the population(s) on which it feeds and
population(s) that prey on, or compete with, it. Changes in size of any population
also affect the importance of its ecological functions. A decline in pollinator
abundance will reduce fertilization and seed production of host plants, thereby
affecting aspects of nutrient uptake and primary productivity. An increase in
phytophage abundance can increase canopy “porosity,” increasing light
penetration and increasing fluxes of energy, water, and nutrients to the soil. A
decline in predator abundance will release prey populations from regulation and
contribute to increased exploitation of the prey’s resources. A decline in
detritivore abundance can reduce decomposition rate and lead to bottlenecks in
biogeochemical cycling that affect nutrient availability.
Population structure across landscapes also influences source-sink relationships
that determine population viability and ability to recolonize patches following
disturbances. For example, the size and distribution of demes determine their
ability to maintain gene flow or to diverge into separate species. Distribution of
demes also determines the source(s) and initial genetic composition of colonists
arriving at a new habitat patch. These population attributes are critical to
protection or restoration of rare or endangered species. Isolation of demes as a
result of habitat fragmentation can reduce their ability to reestablish local demes
and lead to permanent changes in community structure and ecosystem processes
across landscapes.
005-P088772.qxd 1/24/06 10:40 AM Page 124
5
Population Systems
I. Population Structure
A. Density
B. Dispersion
C. Metapopulation Structure
D. Age Structure
E. Sex Ratio
F. Genetic Composition
G. Social Insects
II. Population Processes
A. Natality
B. Mortality
C. Dispersal
III. Life History Characteristics
IV. Parameter Estimation
V. Summary
THE VARIABLES THAT DETERMINE THE ABUNDANCE AND DISTRIBUTION
of a population, in time and space, constitute a population system (Berryman
1981). The basic elements of this system are the individual members of the pop-
ulation, variables describing population size and structure, processes that affect
population size and structure, and the environment. These elements of the pop-
ulation system largely determine the capacity of the population to increase in
size and maintain itself within a shifting landscape mosaic of habitable patches.
This chapter summarizes these population variables and processes, their inte-
gration in life history strategies, and their contribution to change in population
size and distribution.
I. POPULATION STRUCTURE
Population structure reflects several variables that describe the number and
spatial distribution of individuals and their age, sex, and genetic composition.
Population variables reflect life history and the physiological and behavioral
attributes that dictate habitat preferences, home ranges, oviposition patterns, and
affinity for other members of the population.
A. Density
Population density is the number of individuals per unit geographic area (e.g.,
number per m
2
, per ha, or per km
2
). This variable affects a number of other pop-
125
005-P088772.qxd 1/24/06 10:41 AM Page 125
ulation variables. For example, mean density determines population viability and
the probability of colonizing vacant habitat patches. Density also affects popula-
tion dispersion pattern (see the next section). A related measure, population
intensity, is commonly used to describe insect population structure. Intensity is
the number of individuals per habitat unit, such as number per leaf, per m branch
length, per m
2
leaf area or bark surface, per kg foliage or wood, etc. Mean inten-
sity indicates the degree of resource exploitation; competition for space, food, or
mates; and magnitude of effect on ecosystem processes. Intensity measures often
can be converted to density measures if the density of habitat units is known
(Southwood 1978).
Densities and intensities of insect populations can vary widely. Bark
beetles, for example, often appear to be absent from a landscape (very low
density) but, with sufficient examination, can be found at high intensities on
widely scattered injured or diseased trees or in the dying tops of trees
(Schowalter 1985). Under favorable conditions of climate and host abundance
and condition, populations of these beetles can reach sizes of up to 10
5
individ-
uals per tree over areas as large as 10
7
ha (Coulson 1979, Furniss and Carolin
1977). Schell and Lockwood (1995) reported that grasshopper population densi-
ties can increase an order of magnitude over areas of several thousand hectares
within 1 year.
B. Dispersion
Dispersion is the spatial pattern of distribution of individuals. Dispersion is an
important characteristic of populations that affects spatial patterns of resource
use and population effect on community and ecosystem attributes. Dispersion
pattern can be regular, random, or aggregated.
A regular (uniform) dispersion pattern is seen when individuals space them-
selves at regular intervals within the habitat. This dispersion pattern is typical of
species that contest resource use, especially territorial species. For example, bark
beetles attacking a tree show a regular dispersion pattern (Fig. 5.1). Such spacing
reduces competition for resources. From a sampling perspective, the occurrence
of one individual in a sample unit reduces the probability that other individuals
will occur in the same sample unit. Variability in mean density is low, and sample
densities tend to be normally distributed. Hence, regularly dispersed populations
are most easily monitored because a relatively small number of samples provides
the same estimates of mean and variance in population density as does a larger
number of samples.
In a randomly dispersed population, individuals neither space themselves
apart nor are attracted to each other. The occurrence of one individual in a
sample unit has no effect on the probability that other individuals will occur in
the same sample unit (see Fig. 5.1). Sample densities show a skewed (Poisson)
distribution.
Aggregated (or clumped) dispersion results from grouping behavior or
restriction to particular habitat patches. Aggregation is typical of species that
occur in herds, flocks, schools, etc. (see Fig. 5.1), for enhancement of resource
126 5. POPULATION SYSTEMS
005-P088772.qxd 1/24/06 10:41 AM Page 126
A
B
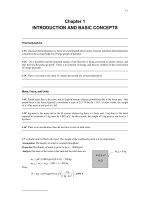
FIG. 5.1 Dispersion patterns and their frequency distributions. A: Regular
dispersion of Douglas-fir beetle entrances (marked by the small piles of reddish phloem
fragments) through bark on a fallen Douglas-fir tree. B: Random dispersion of aphids
on an oak leaf. C: Aggregated dispersion of overwintering ladybird beetles on a small
shrub in a forest clearing.
005-P088772.qxd 1/24/06 10:41 AM Page 127
exploitation or protection from predators (see Chapter 3). Gregarious sawfly
larvae and tent caterpillars are examples of aggregated dispersion resulting from
tendency of individuals to form groups (see Fig. 2.12). Filter-feeding aquatic
insects tend to be aggregated in riffles or other zones of higher flow rate within
the stream continuum (e.g., Fig. 2.14), whereas predators that hide in benthic
detritus, such as dragonfly larvae or water scorpions, are aggregated in pools as
a result of their habitat preferences. Aphids may be aggregated as a result of
rapid, parthenogenic reproduction, as well as host and habitat preferences.
Massonnet et al. (2002) found that the aphid Macrosiphoniella tanacetaria,a spe-
cialist on tansy, Tanacetum vulgare, can be aggregated at the level of individual
shoots, plants, and sites.
For sampling purposes, the occurrence of an individual in a sample unit
increases the probability that additional individuals occur in that sample unit.
Sample densities are distributed as a negative binomial function, and variance
tends to be high. Populations with this dispersion pattern require the greatest
number of samples and attention to experimental design. A large number of
samples is necessary to minimize the obviously high variance in numbers of indi-
128
5. POPULATION SYSTEMS
C
FIG. 5.1 (Continued)
005-P088772.qxd 1/24/06 10:41 AM Page 128
viduals among sample units and to ensure adequate representation of aggrega-
tions.A stratified experimental design can facilitate adequate representation with
smaller sample sizes if the distribution of aggregations among different habitat
types is known.
Dispersion pattern can change during insect development, during change in
population density, or across spatial scales. For example, larval stages of tent
caterpillars and gregarious sawflies are aggregated at the plant branch level, but
adults are randomly dispersed at this scale (Fitzgerald 1995, McCullough and
Wagner 1993). Many host-specific insects are aggregated on particular hosts in
diverse communities but are more regularly or randomly dispersed in more
homogeneous communities dominated by hosts. Some insects, such as the
western ladybird beetle, Hippodamia convergens, aggregate for overwintering
purposes and redisperse in the spring. Aphids are randomly dispersed at low
population densities but become more aggregated as scattered colonies increase
in size (Dixon 1985). Bark beetles show a regular dispersion pattern on a tree
bole, as a result of spacing behavior, but are aggregated on injured or diseased
trees (Coulson 1979).
C. Metapopulation Structure
The irregular distribution of many populations across landscapes creates a
pattern of relatively distinct (often isolated) local demes (aggregations) that
compose the greater metapopulation (Hanski and Gilpin 1997). Insect species
characterizing discrete habitat types often are dispersed as relatively distinct local
demes as a result of environmental gradients or disturbances that affect
the distribution of habitat types across the landscape. Obvious examples include
insects associated with lotic or high-elevation ecosystems. Populations of insects
associated with ponds or lakes show a dispersion pattern reflecting dispersion of
their habitat units. Demes of lotic species are more isolated in desert ecosystems
than in mesic ecosystems.Populations of western spruce budworm,Choristoneura
occidentalis, and fir engraver beetle, Scolytus ventralis, historically occurred in
western North America in relatively isolated high elevation and riparian fir
forests separated by more xeric patches of pine forest (Wickman 1992).
Metapopulations usually are composed of demes of various sizes, reflecting the
size or quality, or both, of habitat patches. For example, Leisnham and Jamieson
(2002) found that demes of mountain stone weta, Hemideina maori, which shelter
under rocks on isolated rock outcrops (tor) in alpine habitats in southern New
Zealand, ranged in size from 0 to 6 adults on tors with 1–12 rocks and from 15 to
40 adults on tors with 30–40 rocks. Small tors were more likely to experience
extinction events (4 of 14 small tors experienced at least 1 extinction during the
3-year study) than were large tors (no extinction events during the study).
Population structure among suitable patches is influenced strongly by the
matrix of patch types.Haynes and Cronin (2003) studied the distribution of plant-
hoppers, Prokelisia crocea, among discrete patches of prairie cordgrass, Spartina
pectinata, as affected by surrounding mudflat, native nonhost grasses, or exotic
smooth brome (Bromus inermis). Planthoppers were released into experimental
I. POPULATION STRUCTURE 129
005-P088772.qxd 1/24/06 10:41 AM Page 129
cordgrass patches constructed to be identical in size (about 24 ¥ 24 cm), isolation
(>25 m from natural cordgrass patches), and host plant quality. Within patches,
planthopper density was higher against mudflat edges, relative to patch interior,
but not against nonhost patches. Among patches, density increased with increas-
ing proportion of surrounding matrix composed of mudflat. The influence of
matrix composition was equal to the influence of patch size and isolation in
explaining planthopper distribution.
Population distribution and degree of isolation among local demes affect
gene structure and viability of the metapopulation. If local demes become too
isolated, they become inbred and may lose their ability to recolonize habitable
patches following local extinction (Hedrick and Gilpin 1997). As human activi-
ties increasingly fragment natural ecosystems, local demes become isolated more
rapidly than greater dispersal ability can evolve, and species extinction becomes
more likely. These effects of fragmentation could be exacerbated by climate
change. For example, a warming climate will push high-elevation ecosystems into
smaller areas on mountaintops, and some mountaintop ecosystems will disappear
(Fig. 5.2) (Franklin et al. 1992, D.Williams and Liebhold 2002). Rubenstein (1992)
showed that individual tolerances to temperature changes could affect range
changes by insects under warming climate scenarios. A species with a linear
response to temperature could extend its range to higher latitudes (provided that
expansion is not limited by habitat fragmentation) without reducing its current
habitat. Conversely, a species with a dome-shaped response to temperature could
extend into higher latitudes but would be forced to retreat from lower latitudes
that become too warm. If the pathway for range adjustment for this species was
blocked by unsuitable habitat, it would face extinction. Metapopulation dynam-
ics are discussed in more detail in Chapter 7.
D. Age Structure
Age structure reflects the proportions of individuals at different life stages. This
variable is an important indicator of population status. Growing populations
generally have larger proportions of individuals in younger age-classes,
whereas declining populations usually have smaller proportions of individuals in
these age classes. Stable populations usually have relatively more individuals in
reproductive age-classes. However, populations with larger proportions of
individuals in younger age-classes also may reflect low survivorship in these
age classes, whereas populations with smaller proportions of individuals in
younger age-classes may reflect high survivorship (see later in this chapter).
For most insect species, life spans are short (usually Ϲ1 year) and revolve
around seasonal patterns of temperature and rainfall. Oviposition usually is
timed to ensure that feeding stages coincide with the most favorable seasons and
that diapausing stages occur during unfavorable seasons (e.g., winter in temper-
ate regions and dry season in tropical and arid regions). Adults usually die after
reproducing. Although there are many exceptions, most temperate species have
discrete, annual generations, whereas tropical species are more likely to have
overlapping generations.
130
5. POPULATION SYSTEMS
005-P088772.qxd 1/24/06 10:41 AM Page 130
I. POPULATION STRUCTURE 131
120
100
80
60
40
20
0
20
40
60
Area in vegetation zones (%)
WESTERN SLOPES OF CASCADE RANGE
Climate scenario
Current +2.5 C +5.0 C
Alpine and forest zones
Savanna and grassland
zones
Alpine and forest zones:
Cold snow zone
Alpine
Mountain hemlock
Silver fir
Western hemlock
Douglas fir
Savanna and grassland zone
s
Oak savanna
Grassland
80
60
40
20
0
20
40
60
80
100
Area in vegetation zones (%)
EASTERN SLOPES OF CASCADE RANGE
Climate scenario
Current +2.5 C +5.0 C
Alpine and forest zones
Savanna and steppe
zones
Alpine and forest zones:
Cold snow zone
Alpine
Mountain hemlock
Abies grandis
Ponderosa pine
Savanna and steppe zones:
Juniper savanna
Sagebrush steppe
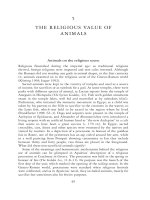
FIG. 5.2
Changes in the percentage area in major vegetation zones on the eastern (
left) and
western (right) slopes of the Cascade Range in Oregon as a result of temperature increases of
2.5°C and 5°C. Major changes are predicted in elevational boundaries and total area occupied by
vegetation zones under these global climate change scenarios. Vegetation zones occupying higher
elevations will decrease in area or disappear as a result of the smaller conical surface at higher
elevations. Other species associated with vegetation zones also will become more or less abundant.
From Franklin et al.
(1992) with permission of Yale University Press.
005-P088772.qxd 1/24/06 10:41 AM Page 131
E. Sex Ratio
The proportion of females indicates the reproductive potential of a population.
Sex ratio also reflects a number of life history traits, such as the importance of
sexual reproduction, mating system, and ability to exploit harsh or ephemeral
habitats (Pianka 1974).
A 50 : 50 sex ratio generally indicates equally important roles of males and
females, given that selection would minimize the less-productive sex. Sex ratio
approaches 50 : 50 in species where males select resources, protect or feed
females, or contribute necessary genetic variability. This sex ratio maximizes
availability of males to females and, hence, maximizes genetic heterogeneity.
High genetic heterogeneity is particularly important for population survival in
heterogeneous environments. However, when the sexes are equally abundant,
only half of the population is capable of producing offspring. By contrast, a
parthenogenetic population (with no males) has little or no genetic heterogene-
ity, but the entire population is capable of producing offspring. Parthenogenetic
individuals can disperse and colonize new resources without the additional chal-
lenge of finding mates, and successful colonists can generate large population
sizes rapidly, ensuring exploitation of suitable resources and large numbers of
dispersants in the next generation.
Sex ratio can be affected by environmental factors.For example,haploid males
of many insect species are more sensitive to environmental variation than are
diploid females, and greater mortality to haploid males may speed adaptation to
changing conditions by quickly eliminating deleterious genes (Edmunds and
Alstad 1985, J. Peterson and Merrell 1983).
F. Genetic Composition
All populations show variation in genetic composition (frequencies of various
alleles) among individuals and through time. The degree of genetic variability
and the frequencies of various alleles depend on a number of factors, including
mutation rate, environmental heterogeneity, and population size and mobility
(Hedrick and Gilpin 1997, Mopper 1996, Mopper and Strauss 1998).
Genetic variation may be partitioned among isolated demes or affected by pat-
terns of habitat use (Hirai et al. 1994). Genetic structure, in turn, affects various
other population parameters, including population viability (Hedrick and Gilpin
1997).
Populations vary in the frequency and distribution of various alleles.
Widespread species might be expected to show greater variation across their geo-
graphic range than would more restricted species. Roberds et al. (1987) meas-
ured genetic variation from local to regional scales for the southern pine beetle,
Dendroctonus frontalis, in the southeastern United States. They reported that
allelic frequencies were somewhat differentiated among populations from
Arkansas, Mississippi, and North Carolina but that a population in Texas was dis-
tinct. They found little or no variation among demes within each state and evi-
dence of considerable inbreeding among beetles at the individual tree level.
132
5. POPULATION SYSTEMS
005-P088772.qxd 1/24/06 10:41 AM Page 132
Roberds et al. (1987) also reported that only 1 allele of the 7 analyzed showed
significant variation between demes that were growing and colonizing new trees
and demes not growing or colonizing new trees. The genetic variation of the
founders of a new deme is relatively low, simply because of the small number of
colonists and the limited proportion of the gene pool that they represent.
Colonists from a population with low genetic variability start a population with
even lower genetic variability (Hedrick and Gilpin 1997).Therefore, the size and
genetic variability of the source populations, as well as the number of colonists,
determine genetic variability in founding populations.Genetic variability remains
low during population growth unless augmented by new colonists. This is espe-
cially true for parthenogenetic species, such as aphids, for which an entire popu-
lation could represent clones derived from a founding female. Differential
dispersal ability among genotypes affects heterozygosity of colonists. Florence et
al. (1982) reported that the frequencies of 4 alleles for an esterase (esB) con-
verged in southern pine beetles collected along a 150-m transect extending from
an active infestation in east Texas. As a result, heterozygosity increased signifi-
cantly with distance, approaching the theoretical maximum of 0.75 for a gene
locus with 4 alleles. These data suggested a system that compensates for loss of
genetic variability as a result of inbreeding by small founding populations and
maximizes genetic variability in new populations coping with different selection
regimens (Florence et al. 1982). Nevertheless, dispersal among local populations
is critical to maintaining genetic variability (Hedrick and Gilpin 1997). If isola-
tion restricts dispersal and infusion of new genetic material into local demes,
inbreeding may reduce population ability to adapt to changing conditions, and
recolonization following local extinction will be more difficult.
Polymorphism occurs commonly among insects and may underlie their rapid
adaptation to environmental change or other selective pressures, such as preda-
tion (A. Brower 1996, Sheppard et al. 1985). Among the best-known examples of
population response to environmental change is the industrial melanism that
developed in the peppered moth, Biston betularia, in England following the
industrial revolution (Kettlewell 1956).Selective predation by insectivorous birds
was the key to the rapid shift in dominance from the white form, which is cryptic
on light surfaces provided by lichens on tree bark, to the black form, which is
more cryptic on trees blackened by industrial effluents.Birds preying on the more
conspicuous morph maintained low frequencies of the black form in preindus-
trial England, but later they greatly reduced frequencies of the white form. Other
examples of polymorphism also appear to be maintained by selective predation.
In some cases, predators focusing on inferior Müllerian mimics of multiple sym-
patric models may select for morphs or demes that mimic different models (e.g.,
A. Brower 1996, Sheppard et al. 1985).
Genetic polymorphism can develop in populations that use multiple habitat
units or resources (Mopper 1996, Mopper and Strauss 1998, Via 1990). Sturgeon
and Mitton (1986) compared allelic frequencies among mountain pine beetles,
Dendroctonus ponderosae, collected from three pine hosts [ponderosa (Pinus
ponderosa), lodgepole (P. contorta), and limber (P. flexilis)] at each of five sites
in Colorado. Significant variation occurred in morphological traits and allelic fre-
I. POPULATION STRUCTURE 133
005-P088772.qxd 1/24/06 10:41 AM Page 133
quencies at five polymorphic enzyme loci among the five populations and among
the three host species, suggesting that the host species is an important contribu-
tor to genetic structure of polyphagous insect populations.
Via (1991a) compared the fitnesses (longevity, fecundity, and capacity for pop-
ulation increase) of pea aphid, Acyrthosiphon pisum, clones from two host
plants (alfalfa and red clover) on their source host or the alternate host. She
reported that aphid clones had higher fitnesses on their source host, compared
to the host to which they were transplanted, indicating local adaptation to factors
associated with host conditions.Furthermore, significant negative correlations for
fitness between source host and alternate host indicated increasing divergence
between aphid genotypes associated with different hosts. In a subsequent
study, Via (1991b) evaluated the relative importance of genetics and experience
on aphid longevity and fecundity on source and alternate hosts. She maintained
replicate lineages of the two clones (from alfalfa versus clover) on both
host plants for three generations, then tested performance of each lineage on
both hosts. If genetics is the more important factor affecting aphid performance
on source and alternate host, then aphids should have highest fitness on the host
to which they were adapted, regardless of subsequent rearing on the alternate
host. However, if experience is the more important factor, then aphids should
have highest fitness on the host from which they were reared. Via found
that three generations of experience on the alternate host did not significantly
improve fitness on that host. Rather, fitness was highest on the plant from
which the clone was derived originally, supporting the hypothesis that genetics is
the more important factor. These data indicated that continued genetic diver-
gence of the two subpopulations is likely, given that individuals dispersing
between alternate hosts cannot improve their performance through time as a
result of experience.
Biological factors that determine mate selection or mating success also affect
gene frequencies, perhaps in concert with environmental conditions. In a labora-
tory experiment with sex-linked mutant genes in Drosophila melanogaster
(Peterson and Merrell 1983), mutant and wild-male phenotypes exhibited about
the same viability, but mutant males showed a significant mating disadvantage,
leading to rapid elimination (i.e., within a few generations) of the mutant allele.
In addition, whereas the wild-male phenotype tended to show a rare male advan-
tage in mating (i.e., a higher proportion of males mating at low relative abun-
dance), mutant males showed a rare male disadvantage (i.e., a lower proportion
of males mating at low relative abundance), increasing their rate of elimination.
Malausa et al. (2005) used a combination of genetic and stable isotope (
13
C) tech-
niques to identify host plant sources of 396 male and 393 female European corn
borer, Ostrinia nubilalis, collected at multiple sites, and of 535 spermatophores
carried by these females, over a 2-year period (2002–2003). Moths could be dif-
ferentiated unambiguously on the basis of larval host, either C
3
or C
4
plants. All
but 5 females (3 in 2002 and 2 in 2003) had mated with a male from the same
host race, indicating >95 assortative mating.These data indicate that nonrandom
mating patterns can lead to rapid changes in gene frequencies among diverging
races from different hosts.
134 5. POPULATION SYSTEMS
005-P088772.qxd 1/24/06 10:41 AM Page 134
Insect populations can adapt to environmental change more rapidly than can
longer-lived, more slowly reproducing, organisms (Mopper 1996, Mopper and
Strauss 1998). Heterogeneous environmental conditions tend to mitigate direc-
tional selection: any strong directional selection by any environmental factor
during one generation can be modified in subsequent generations by a different
prevailing factor. However, changes in genetic composition occur quickly in
insects when environmental change does impose directional selective pressure,
such as in the change from preindustrial to postindustrial morphotypes in the
polymorphic peppered moth (Kettlewell 1956).
The shift from pesticide-susceptible to pesticide-resistant genotypes may be
particularly instructive. Selective pressure imposed by insecticides caused rapid
development of insecticide-resistant populations for many species. Resistance
development is facilitated by the widespread occurrence in insects,especially her-
bivores, of genes that encode for enzymes that detoxify plant defenses because
ingested insecticides also are susceptible to detoxification by these enzymes.
Although avoidance of directional selection for resistance to any single tactic is
a major objective of integrated pest management (IPM), pest management in
practice still involves widespread use of the most effective tactic. Following the
appearance of transgenic insect-resistant crop species in the late 1980s, geneti-
cally engineered, Bt toxin-producing corn, cotton, soybeans, and potatoes have
replaced nontransgenic varieties over large areas,raising concern that these crops
might quickly select for resistance in target species (Alstad and Andow 1995,
Tabashnik 1994, Tabashnik et al. 1996).
Laboratory studies have shown that at least 16 species of Lepidoptera,
Coleoptera, and Diptera are capable of developing resistance to the Bt gene
as a result of strong selection (Tabashnik 1994).However, few species have shown
resistance in the field. The diamondback moth, Plutella xylostella,
has shown resistance to Bt in field populations from the United States,
Philippines, Malaysia, and Thailand. Resistance in some species has been
attributed to reduced binding of the toxin to membranes of the midgut epithe-
lium. A single gene confers resistance to four Bt toxins in the diamondback
moth (Tabashnik et al. 1997), and >5000-fold resistance can be achieved in a
few generations (Tabashnik et al. 1996). Resistance can be reversed when
exposure to Bt toxin is eliminated for several generations, probably because of
fitness costs of resistance (Tabashnik et al. 1994), but some strains can maintain
resistance in the absence of Bt for more than 20 generations (Tabashnik et al.
1996).
Resistance development in the field can be minimized by alternating
control strategies to prevent strong directional selection in exposed populations.
In particular, a strategy of high Bt concentration in transgenic crops,
together with nontransgenic refuges, has been successful both in reducing use of
conventional insecticides and in preventing resistance development (Alstad
and Andow 1995, Carrière et al. 2001b, 2003).High concentration of Bt minimizes
survivorship on the transgenic crop, and greater survivorship in the nontrans-
genic crop prevents fixation of resistance genes in the population (see
Chapter 16).
I. POPULATION STRUCTURE 135
005-P088772.qxd 1/24/06 10:41 AM Page 135
G. Social Insects
Social insects pose some special problems for description of population structure.
On the one hand, each individual requires resources and contributes to interac-
tions with other organisms. On the other hand, colony member activity is cen-
tered on the nest, and collective foraging territory is defined by proximity to
surrounding colonies.Furthermore, food transfer among nestmates (trophallaxis)
supports a view of colonies as sharing a collective gut.Hence, each colony appears
to function as an ecological unit, with colony size (number of members) deter-
mining its individual physiology and behavior. For some social insects, the
number of colonies per ha may be a more useful measure of density than is
number of individuals per ha.
However, defining colony boundaries and distinguishing between colonies
may be problematic for many species, especially those with underground nests.
Molecular techniques have proved to be a valuable tool for evaluating related-
ness within and among colonies in an area.
Colonies of social Hymenoptera can be monogyne (having one queen) or
polygyne (having multiple queens), with varying degrees of relatedness among
queens and workers (Pamilo et al. 1997). Intracolonial relatedness can vary
among colonies and among populations. In some ants, such as Solenopsis invicta
and some Formica species, social polymorphism can be observed, with distinct
monogynous (M type) and polygynous (P type) colonies. The two types gener-
ally show high relatedness to each other where they occur in the same area.
However, gene flow is restricted in the polygynous type and between monogy-
nous and polygynous types. Populations of polygynous colonies generally are
more genetically differentiated than are those of monogynous colonies in the
same area (Pamilo et al. 1997).
Polygyny may be advantageous in areas of intense competition, where the
more rapid reproduction by multiple queens may confer an advantage, regard-
less of the relatedness of the queens. However, additional queens eventually may
be eliminated, especially in ant species, with workers often favoring queens on
the basis of size or condition rather than which queen is mother to most workers
(Pamilo et al. 1997).
Similarly, termite colonies are cryptic and may have variable numbers of
reproductive adults. Husseneder and Grace (2001b) and Husseneder et al. (1998)
found DNA (deoxyribonucleic acid) fingerprinting to be more reliable than
aggression tests or morphometry for distinguishing termites from different
colonies or sites. As expected, genetic similarity is higher among termites within
collection sites than between collection sites (Husseneder and Grace 2001a,
Husseneder et al. 1998). Moderate inbreeding often is evident within termite
colonies, but low levels of genetic differentiation at regional scales suggest that
substantial dispersal of winged adults homogenizes population genetic structure
(Husseneder et al. 2003). However, several species are polygynous and may show
greater within-colony genetic variation, depending on the extent to which multi-
ple reproductives are descended from a common parent (Vargo et al. 2003). Kaib
et al. (1996) found that foraging termites tended to associate with close kin in
136
5. POPULATION SYSTEMS
005-P088772.qxd 1/24/06 10:41 AM Page 136
polygynous and polyandrous colonies of Schedorhinotermes lamanianus, leading
to greater genetic similarity among termites within foraging galleries than at the
nest center.
Genetic studies have challenged the traditional view of the role of genetic
relatedness in the evolution and maintenance of eusociality. Eusociality in the
social Hymenoptera has been explained by the high degree of genetic related-
ness among siblings, which share 75% of their genes as a result of haploid father
and diploid mother, compared to only 50% genes shared with their mother
(Hamilton 1964, See Chapter 15). However, this model does not apply to ter-
mites. Husseneder et al. (1999) and Thorne (1997) suggested that developmental
and ecological factors, such as slow development, iteroparity, overlap of genera-
tions, food-rich environment, high risk of dispersal, and group defense, may be
more important than genetics in the maintenance of termite eusociality, regard-
less of the factors that may have favored its original development. Myles (1999)
reviewed the frequency of neoteny (reproduction by immature stages) among
termite species and concluded that neoteny is a primitive element of the caste
system that may have reduced the fitness cost of not dispersing, leading to further
differentiation of castes and early evolution of eusociality.
II. POPULATION PROCESSES
The population variables described in the preceding section change as a result of
variable reproduction, movement, and death of individuals.These individual con-
tributions to population change are integrated as three population processes:
natality (birth rate), mortality (death rate), and dispersal (rate of movement of
individuals into or out of the population). For example, density can increase as a
result of increased birth rate, immigration, or both; frequencies of various alleles
change as a result of differential reproduction, survival, and dispersal. The rate
of change in these processes determines the rate of population change, described
in the next chapter. Therefore, these processes are fundamental to understand-
ing population responses to changing environmental conditions.
A. Natality
Natality is the population birth rate (i.e., the per capita production of new indi-
viduals per unit time). Realized natality is a variable that approaches potential
natality—the maximum reproductive capacity of the population—only under
ideal environmental conditions. Natality is affected by factors that influence
production of eggs (fecundity) or production of viable offspring (fertility) by indi-
vidual insects. For example, resource quality can affect the numbers of eggs pro-
duced by female insects (R. Chapman 1982). Ohgushi (1995) reported that
females of the herbivorous ladybird beetle, Henosepilachna niponica, feeding on
the thistle, Cirsium kagamontanum,resorbed eggs in the ovary when leaf damage
became high. Female blood-feeding mosquitoes often require a blood meal
before first or subsequent oviposition can occur (R. Chapman 1982); the cerato-
pogonid, Culicoides barbosai,produces eggs in proportion to the size of the blood
II. POPULATION PROCESSES 137
005-P088772.qxd 1/24/06 10:41 AM Page 137
meal (Linley 1966). Hence, poor quality or insufficient food resources can reduce
natality. Inadequate numbers of males can reduce fertility in sparse populations.
Similarly, availability of suitable oviposition sites also affects natality.
Natality usually is higher at intermediate population densities than at low or
high densities. At low densities, difficulties in attracting mates may limit mating,
or may limit necessary cooperation among individuals, as in the case of bark
beetles that must aggregate to overcome host tree defenses prior to oviposition
(Berryman 1981). At high densities, competition for food, mates, and oviposition
sites reduces fecundity and fertility (e.g., Southwood 1975, 1977). The influence
of environmental conditions can be evaluated by comparing realized natality to
potential natality (e.g., estimated under laboratory conditions).
Differences among individual fitnesses are integrated in natality. Differential
reproduction among genotypes in the population determines the frequency of
various alleles in the filial generation. As discussed earlier in this chapter, gene
frequencies can change dramatically within a relatively short time, given strong
selection and the short generation times and high reproductive capacity of
insects.
B. Mortality
Mortality is the population death rate (i.e., the per capita number of individuals
dying per unit time). As with natality, we can distinguish a potential longevity or
lifespan, resulting only from physiological senescence, from the realized long-
evity, resulting from the action of mortality factors. Hence, mortality can be
viewed both as reducing the number of individuals in the population and as
reducing survival. Both have importance consequences for population dynamics.
Organisms are vulnerable to a variety of mortality agents, including unsuit-
able habitat conditions (e.g., extreme temperature or water conditions), toxic or
unavailable food resources, competition, predation (including cannibalism), par-
asitism, and disease (see Chapters 2–4). These factors are a focus of studies to
enhance pest management efforts. Death can result from insufficient energy or
nutrient acquisition to permit detoxification of, or continued search for, suitable
resources. Life stages are affected differentially by these various mortality agents
(e.g., Fox 1975b, Varley et al. 1973). For example, immature insects are particu-
larly vulnerable to desiccation during molts, whereas flying insects are more vul-
nerable to predation by birds or bats. Many predators and parasites selectively
attack certain life stages. Among parasitic Hymenoptera, species attacking the
same host have different preferences for host egg, larval, or pupal stages.
Predation also can be greater on hosts feeding on particular plant species, com-
pared to other plant species, based on differential toxin sequestration, or preda-
tor attraction to plant volatiles (Stamp 1992, Traugott and Stamp 1996, Turlings
et al. 1990, 1995).
In general, mortality resulting from predation tends to peak at intermediate
population densities, when density is sufficient for a high rate of encounter with
predators and parasites, but prior to predator satiation (Fig. 5.3) (Southwood
1975, 1977, see Chapter 8). Mortality resulting from competition and canni-
138 5. POPULATION SYSTEMS
005-P088772.qxd 1/24/06 10:41 AM Page 138
balism increases at higher population densities (see Fig. 5.3) (Fox 1975a, b,
Southwood 1975, 1977). Competition may cause mortality through starvation,
cannibalism, increased disease among stressed individuals, displacement of indi-
viduals from optimal habitats, and increased exposure and vulnerability to pre-
dation as a result of displacement or delayed development.
Survival rate represents the number of individuals still living in relation to
time. These individuals continue to feed and reproduce, thereby contributing
most to population size as well as to genetic and ecological processes. Hence, sur-
vival rate is an important measure in studies of populations.
Survivorship curves reflect patterns of mortality and can be used to compare
the effect of mortality in different populations. Lotka (1925) pioneered the com-
parison of survivorship curves among populations by plotting the log of number
or percent of living individuals against time. Pearl (1928) later identified three
types of survivorship curves based on the log of individual survival through time
II. POPULATION PROCESSES 139
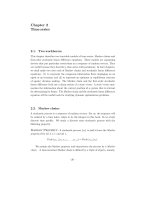
FIG. 5.3 Relationship between population density, natality, and mortality caused
by predators and parasites (peaking at lower population density) and interspecific
competition (peaking at higher population density). From Southwood (1975). Please see
extended permission list pg 570.
005-P088772.qxd 1/24/06 10:41 AM Page 139
(Fig. 5.4).Type 1 curves represent species, including most large mammals, but also
starved Drosophila (Price 1997), in which mortality is concentrated near the end
of the maximum life span. Type 2 curves represent species in which the proba-
bility of death is relatively constant with age, leading to a linear decline in sur-
vivorship. Many birds and reptiles approach the Type 2 curve. Type 3 curves are
seen for most insects, as well as many other invertebrates and fish, which have
high rates of mortality during early life stages but relatively low mortality during
later life stages (Begon and Mortimer 1981, Pianka 1974). Species representing
Type 3 survivorship must have very high rates of natality to ensure that some off-
spring reach reproductive age, compared to Type 1 species, which have a high
probability of reaching reproductive age.
The form of the survivorship curve can change during population growth.
Mason and Luck (1978) showed that survivorship curves for the Douglas-fir
tussock moth, Orgyia pseudotsugata,changed with population growth from stable
to increasing, then decreasing. Survivorship decreased less steeply during popu-
lation growth and decreased more steeply during population decline, compared
to stable populations.
As described for natality, mortality integrates the differential survival among
various genotypes, the basis for evolution. Survivors live longer and have greater
capacity to reproduce. Hence, selective mortality can alter gene frequencies
rapidly in insect populations.
140
5. POPULATION SYSTEMS
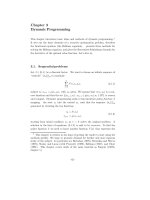
FIG. 5.4 Three generalized types of survivorship curves. Type 1 represents species
with high survival rates maintained through the potential life span. Type 2 represents
species with relatively constant survivorship with age. Type 3 represents species with
low survival rates during early stages but relatively high survival of individuals reaching
more advanced ages.
005-P088772.qxd 1/24/06 10:41 AM Page 140
C. Dispersal
Dispersal is the movement of individuals away from their source and includes
spread, the local movement of individuals, and migration, the cyclic mass
movement of individuals among areas (L. Clark et al. 1967, Nathan et al. 2003).
As discussed in Chapter 2, long-distance dispersal maximizes the probability that
habitat or food resources created by environmental changes or disturbances are
colonized before the source population depletes its resources or is destroyed by
disturbance. However, dispersal also contributes to infusion of new genetic
material into populations. This contribution to genetic heterogeneity enhances
population capacity to adapt to changing conditions.
Dispersal incorporates emigration, movement away from a source population,
and immigration, movement of dispersing individuals into another population
or vacant habitat. Immigration adds new members to the population, or
founds new demes, whereas emigration reduces the number of individuals in the
population.
Effective dispersal, the number of individuals that successfully immigrate or
found new demes, is the product of source strength (the number of individuals
dispersing) and the individual probability of success (Nathan et al. 2003, Price
1997, see Chapter 2). Source strength is a function of population size, density, and
life history strategy. Individual probability of successful dispersal is determined
by dispersal mechanism, individual capacity for long-distance dispersal, the dis-
tance between source and sink (destination), patch size, and habitat heterogene-
ity, as described later in this section (see also Chapters 2 and 7).
Species characterizing ephemeral habitats or resources have adapted a greater
tendency to disperse than have species characterizing more stable habitats or
resources. For example, species found in vernal pools or desert playas tend to
produce large numbers of dispersing offspring before water level begins to
decline.This ensures that other suitable ponds are colonized and buffers the pop-
ulation against local extinctions. Some dispersal-adapted species produce a spe-
cialized morph for dispersal. The dispersal form of most aphids and many scale
insects is winged, whereas the feeding form usually is wingless and sedentary.
Migratory locusts develop into a specialized long-winged morph for migration,
distinct from the shorter-winged nondispersing morph. Some mites have disper-
sal stages specialized for attachment to phoretic hosts (e.g., ventral suckers in the
hypopus of astigmatid mites and anal pedicel in uropodid mites) (Krantz 1978).
Some species have obligatory dispersal prior to reproduction. Cronin and
Strong (1999) reported that parasitoid wasps,Anagrus sophiae, laid >84% of their
eggs in host planthoppers, Prokelisia spp., on cordgrass, Spartina alterniflora,
plants isolated at 10–250 m from source populations.
Dispersal increases with population size or density. Cronin (2003) found that
emigration of planthoppers, Prokelisia crocea, increased linearly with density of
female conspecifics.Crowding increases competition for resources and may inter-
fere with foraging or mating activity,thereby encouraging individuals to seek less-
crowded conditions.Leisnham and Jamieson (2002) reported that more mountain
stone weta emigrated from large tors with larger demes, but proportionately
II. POPULATION PROCESSES 141
005-P088772.qxd 1/24/06 10:41 AM Page 141
more weta emigrated from small tors, likely reflecting the greater perimeter-to-
area ratio of small tors.
The mating status of dispersing individuals determines their value as founders
when they colonize new resources. Clearly, if unmated individuals must find a
mate to reproduce after finding a habitable patch, their value as founders is neg-
ligible. For some species, mating occurs prior to dispersal of fertilized females
(Mitchell 1970). In species capable of parthenogenetic reproduction, fertilization
is not required for dispersal and successful founding of populations. Some species
ensure breeding at the site of colonization, such as through long-distance attrac-
tion via pheromones (e.g., by bark beetles; Raffa et al. 1993), or through males
accompanying females on phoretic hosts (e.g., some mesostigmatid mites;
Springett 1968) or mating swarms (e.g., eastern spruce budworm, Choristoneura
fumiferana;Greenbank 1957).
Habitat conditions affect dispersal. Individuals are more likely to move greater
distances when resources are scarce than when resources are abundant.
Furthermore, the presence of predators may encourage emigration (Cronin et al.
2004). However, Seymour et al. (2003) found that a lycaenid butterfly, Plebejus
argus, whose larvae are tended by ants, Lasius niger, apparently are able to orient
toward patches occupied by L. niger colonies. Butterfly persistence in patches was
influenced more strongly by ant presence than by floral resource density.
Dispersal mechanism determines the likelihood that individuals will reach a
habitable patch. Individuals that disperse randomly have a low probability of col-
onizing a habitable destination. Larval settlement rates for black flies, Simulium
vittatum, are lowest in the high stream velocity habitats preferred by the larvae
as a result of constraints on larval ability to control direction of movement at
high flow rates (D. Fonseca and Hart 2001). Conversely, individuals that can
control direction of movement and orient toward cues indicating suitable
resources have a higher probability of reaching a habitable destination.
Transportation by humans has substantially increased possibilities for long-dis-
tance dispersal across regional and continental barriers.
The capacity of individuals for long-distance dispersal is determined by flight
capacity, nutritional status, and parasitism. Winged insects disperse greater dis-
tances than wingless species (Leisnham and Jamieson 2002). Individuals feeding
on adequate resources can store sufficient energy and nutrients to live longer and
travel farther than can individuals feeding on marginal or inadequate resources.
Although dispersal should increase as population density increases, increased
competition for food may limit individual energy reserves and endurance at high
densities. Furthermore, parasitized individuals may lose body mass more quickly
during dispersal than do unparasitized individuals and consequently exhibit
shorter flight distances and slower flight speeds (Bradley and Altizer 2005).
Hence, dispersal may peak before increasing density and disease reach levels that
interfere with dispersal capacity (Leonard 1970, Schowalter 1985).
Dispersing individuals become vulnerable to new mortality factors. Whereas
nondispersing individuals may be relatively protected from temperature
extremes and predation through selection of optimal microsites, dispersing indi-
viduals are exposed to ambient temperature and humidity, high winds, and pred-
142
5. POPULATION SYSTEMS
005-P088772.qxd 1/24/06 10:41 AM Page 142
ators as they move across the landscape. Exposure to higher temperatures
increases metabolic rate and depletes energy reserves more quickly, reducing the
time and distance an insect can travel (Pope et al. 1980). Actively moving insects
also are more conspicuous and more likely to attract the attention of predators
(Schultz 1983). Dispersal across inhospitable patches may be inhibited or inef-
fective (Haynes and Cronin 2003). However, insects in patches with high abun-
dance of predators may be induced to disperse as a result of frequent encounters
with predators (Cronin et al. 2004).
The number of dispersing individuals declines with distance from the source
population, with the frequency distribution of dispersal distances often described
by a negative exponential or inverse power law (Fig. 5.5). However, some species
show a higher proportion of long-distance dispersers than would be expected
from a simple diffusion model, suggesting heterogeneity in dispersal type (Cronin
et al. 2000). A general functional model of dispersal (D) can be described by the
following equation:
(5.1)
where c and a are shape and distance parameters, respectively, and G(1/c) is the
gamma function (J. Clark et al. 1998, Nathan et al. 2003). The negative exponen-
tial (c = 1) and Gaussian (c = 2) are special cases of this formula. Similarly, effec-
D
c
c
x
c
=
()
-
Ê
Ë
Á
ˆ
¯
˜
21aaG
exp
II. POPULATION PROCESSES 143
0
100
200
300
400
500
<1 1–24 25–49 50–74 75–99 100–149 150–199 200–400 >400
Recaptured beetles
Distance moved (m)
1999
2000
505
285
156
123
49
4040
54
19
25
14
31
9
24
77
1
4
FIG. 5.5 Range of dispersal distances from a population source for the weevil,
Rhyssomatus lineaticollis, in Iowa, United States. From St. Pierre and Hendrix
(2003) with permission from the Royal Entomological Society. Please see extended
permission list pg 570.
005-P088772.qxd 1/24/06 10:41 AM Page 143
tive dispersal declines as the probability of encountering inhospitable patches
increases.
The contribution of dispersing individuals to genetic heterogeneity in a pop-
ulation depends on a number of factors. The genetic heterogeneity of the source
population determines the gene pool from which dispersants come. Dispersing
individuals represent a proportion of the total gene pool for the population. More
heterogeneous demes have greater contributions to the genetic heterogeneity of
target or founded demes than do less heterogeneous demes (Fig. 5.6) (Hedrick
and Gilpin 1997). The number or proportion of individuals that disperse affects
their genetic heterogeneity. If certain genotypes are more likely to disperse, then
the frequencies of these genotypes in the source population may decline, unless
balanced by immigration. Distances between demes influence the degree of gene
exchange through dispersal. Local demes will be influenced more by the geno-
types of dispersants from neighboring demes than by more distant demes.
Gene flow may be precluded for sufficiently fragmented populations. This is an
increasing concern for demes restricted to isolated refugia. Populations consist-
ing of small, isolated demes may be incapable of sufficient interaction to sustain
viability.
III. LIFE HISTORY CHARACTERISTICS
Life history adaptation to environmental conditions usually involves comple-
mentary selection of natality and dispersal strategies. General life history strate-
gies appear to be related to habitat stability.
144
5. POPULATION SYSTEMS
FIG. 5.6 Simulated population heterozygosity (H) over time in three habitat
patches. Extinction is indicated by short vertical bars on the right end of horizontal
lines; recolonization is indicated by arrows. From Hedrick and Gilpin (1998).
005-P088772.qxd 1/24/06 10:41 AM Page 144
MacArthur and Wilson (1967) distinguished two life history strategies related
to habitat stability and importance of colonization and rapid population estab-
lishment. The r-strategy generally characterizes “weedy” species adapted to col-
onize and dominate new or ephemeral habitats quickly (Janzen 1977). These
species are opportunists that quickly colonize new resources but are poor com-
petitors and cannot persist when competition increases in stable habitats. By con-
trast, the K strategy is characterized by low rates of natality and dispersal but
high investment of resources in storage and individual offspring to ensure their
survival.These species are adapted to persist under stable conditions, where com-
petition is intense, but reproduce and disperse too slowly to be good colonizers.
Specific characteristics of the two strategies (Table 5.1) have been the subject of
debate (Boyce 1984). For example, small size with smaller resource requirements
might be favored by K selection (Boyce 1984), although larger organisms
usually show more efficient resource use. Nevertheless, this model has been
useful for understanding selection of life history attributes (Boyce 1984).
Insects generally are considered to exemplify the r-strategy because of their
relatively short life spans, Type 3 survivorship, and rapid reproductive and dis-
persal rates. However, among insects, a wide range of r-K strategies have been
identified. For example, low-order streams (characterized by narrow constrained
channels and steep topographic gradients) experience wider variation in water
flow and substrate movement, compared to higher-order streams (characterized
by broader floodplains and shallower topographic gradients). Insects associated
with lower-order streams tend to be more r-selected than are insects associated
with slower water and greater accumulation of detritus (Reice 1985). Similarly,
ephemeral terrestrial habitats are dominated by species with higher natality and
dispersal rates (e.g., aphids and Collembola), compared to more stable habitats,
dominated by Lepidoptera, Coleoptera, and oribatid mites (Schowalter 1985,
Seastedt 1984). Many species associated with relatively stable habitats are poor
III. LIFE HISTORY CHARACTERISTICS 145
TABLE 5.1 Life history characteristics of species exemplifying the r- and K-strategies
Attribute Ecological Strategy
r (opportunistic) K (equilibrium)
Homeostatic ability Limited Extensive
Development time Short Long
Life span Short Long
Mortality rate High Low
Reproductive mode Often asexual Sexual
Age at first brood Early Late
Offspring/brood Many Few
Broods/lifetime Usually one Often several
Size of offspring Small Large
Parental care None Extensive
Dispersal ability High Limited
Numbers dispersing Many Few
Dispersal mode Random Oriented
005-P088772.qxd 1/24/06 10:41 AM Page 145
dispersers and are often flightless, even wingless, indicating weak selection
for escape and colonization of new habitats (St. Pierre and Hendrix 2003).
Such species may be at risk if environmental change increases the frequency of
disturbance.
Grime (1977) modified the r-K model by distinguishing three primary life
history strategies in plants, based on their relative tolerances of disturbance, com-
petition, and stress. Clearly, these three factors are interrelated because distur-
bance can affect competition and stress can increase vulnerability to disturbance.
Nevertheless, this model has proved useful for distinguishing the following
strategies, characterizing harsh versus frequently disturbed and infrequently
disturbed habitats.
The ruderal strategy generally corresponds to the r-selected strategy and char-
acterizes unstable habitats; the competitive strategy generally corresponds to
the K strategy and characterizes relatively stable habitats. The stress-adapted
strategy characterizes species adapted to persist in harsh environments. These
species usually are adapted to conserve resources and minimize exposure to
extreme conditions. Insects showing the stress-adapted strategy include those
adapted to tolerate freezing in arctic ecosystems or minimize water loss in desert
ecosystems (see Chapter 2).
Fielding and Brusven (1995) explored correlations between plant community
correspondence to Grime’s (1977) strategies and the species traits (abundance,
habitat breadth, phenology, and diet breadth) of the associated grasshopper
assemblages. They found that the three grasshopper species associated with the
ruderal plant community had significantly wider habitat and diet breadths (gen-
eralists) and had higher densities than did grasshoppers associated with the com-
petitive or stress-adapted plant communities (Fig. 5.7). Grasshopper assemblages
also could be distinguished between the competitive and stress-adapted plant
communities,but these differences were only marginally significant. Nevertheless,
their study suggested that insects can be classified according to Grime’s (1977)
model, based on their life history adaptations to disturbance, competition, or
stress.
IV. PARAMETER ESTIMATION
Whereas population structure can be measured by sampling the population,
estimates of natality, mortality, and dispersal require measurement of
changes through time in overall rates of birth, death, and movement. The fol-
lowing methods have been used to estimate these population processes
(Southwood 1978).
Fecundity can be estimated by measuring the numbers of eggs in dissected
females or recording the numbers of eggs laid by females caged under natural
conditions. Fertility can be measured if the viability of eggs can be assessed.
Natality then can be estimated from data for a large number of females.Mortality
can be measured by subtracting population estimates for successive life stages,
by recovering and counting dead or unhealthy individuals, or by dissecting or
immunoassaying to identify parasitized individuals. Dispersal capacity can be
146
5. POPULATION SYSTEMS
005-P088772.qxd 1/24/06 10:41 AM Page 146
measured in the laboratory using flight chambers to record duration of tethered
flight. Natality, mortality, and dispersal also can be estimated from sequential
recapture of marked individuals. However, these techniques require a number of
assumptions about the constancy of natality, mortality, and dispersal and their net
effects on population structure of the sample, and they do not measure natality,
mortality, and dispersal directly.
Deevy (1947) was the first ecologist to apply the methods of actuaries, for
determining life expectancy at a given age, to development of survival and repro-
duction budgets for animals. Life table analysis is the most reliable method to
account for survival and reproduction of a population (Begon and Mortimer
1981, Price 1997, Southwood 1978). The advantage of this technique over others
is the accounting of survival and reproduction in a way that allows for verifica-
tion and comparison. For example, a change in cohort numbers at a stage when
dispersal cannot occur could signal an error that requires correction or causal
factors that merit examination.
Two types of life tables have been widely used by ecologists. The age-specific
life table is based on the fates of individuals in a real cohort, a group of individ-
uals born in the same time interval, whereas a time-specific life table is based on
the fate of individuals in an imaginary cohort derived from the age structure of
IV. PARAMETER ESTIMATION 147
FIG. 5.7 Constrained correspondence analysis ordination of grasshopper species in
southern Idaho, using Grime’s (1977) classification of life history strategies based on
disturbance, competition, and stress variables (arrows). Grasshoppers are denoted by
the initials of their genus and species. The length of arrows is proportional to the
influence of each variable on grasshopper species composition. Eigenvalues for axes 1
and 2 are 0.369 and 0.089, respectively. From Fielding and Brusven (1993) with
permission from the Entomological Society of America.
005-P088772.qxd 1/24/06 10:41 AM Page 147