Stephens & Foraging - Behavior and Ecology - Chapter 11 pot
Bạn đang xem bản rút gọn của tài liệu. Xem và tải ngay bản đầy đủ của tài liệu tại đây (242.35 KB, 34 trang )
Part IV
Foraging Ecology11
Foraging and Population Dynamics
Robert D. Holt and Tristan Kimbrell
11.1 Prologue
Every ecologytextbook tellsthe storyof snowshoehare cycles.The vague-
ly sinusoidal plotsof hare densitieswiggle across the bloodlesspage. The
hare population traces out a complete cycle every 8 to 11 years; the dif-
ference between low- and high-population years can be as much as a
hundredfold.
The on-the-ground reality of the hare cycle is anything but dry and
academic. In peak years, the undergrowth of the boreal forest virtually
quivers with hares. For the lynx, the cycle’s peak means easy pickings
and a distended stomach: a few short bounds, then a pounce, then a sati-
ated lynx and blood on the snow. Many other predators also feed on
hares in the peak years.
It is a different story in the low-population years. A world once spread
with hare biomass is nearly empty. Without a ready supply of snowshoe
hares, some lynx pursue red squirrels, which are smaller and harder to
catch. Notwithstanding the difficulties, lynx adapt to squirrel hunting,
and many continue to pursue squirrels even as the hare population
recovers. The behavioral inertia of the lynx reduces the predation rate
experienced by hares and helps the hare population return to its peak.
The connections between lynx foraging behavior and hare populations
flow in both directions. The size of the hare population changes how
366 Robert D. Holt and Tristan Kimbrell
the lynxhunt, but the hunting behavior of the lynx and other predators in-
fluences the growth of the hare population.
11.2 The Necessary Link
Fundamentally, ecologists want to understand patterns of variation in the
distribution and abundance of species (Andrewartha and Birch 1954; Krebs
2001). The study of “population dynamics” represents an approach to ques-
tions of distribution and abundance that focuses on temporal and spatial
variation in population size (box 11.1). Although the idiosyncrasies of natural
history vary enormously among species, students of population dynamics
find that most species follow one of a relatively small set of dynamic pat-
terns (Lawton 1992). Some species have populations that persist indefinitely,
whereas others regularly suffer local extinctions. For persistent populations,
numbers may show small fluctuations around a well-defined equilibrium, or
instead display large variations in abundance. These large variations may take
the form of regular cycles or seemingly random variation. Species that reg-
ularly suffer local extinctions must have other populations nearby that can
recolonize the empty patches, thereby forming a metapopulation that may
persist indefinitely (Hanski 1999).
BOX 11.1 Basic Concepts in Population Dynamics
The essential data in population dynamics describe how numbers of indi-
viduals in a population vary through time and space. We focus here on a
population at a single, spatially closed location. Population size is repre-
sented as N(t), which could be either a function (continuous) or a variable
with discrete values. Deterministic or probabilistic rules determine how
N(t) changes with time. For small populations, models must deal with the
discreteness of individuals (for example, a population may contain 4 or
5 individuals, but not 4.78 individuals). This requires stochastic model
formulations (which can be mathematically very difficult), because at the
level of individual organisms, births and deaths are inherently probabilis-
tic (Renshaw 1991). For large populations, we portray N as a defined
function of time; this allows us to use simpler deterministic models. The
“top-down” modeling approach described in the text usually involves
deterministic models, whereas “bottom-up” individual-based models use
stochastic rules. Foraging influences these rules because foraging decisions
(Box 11.1 continued)
influence birth rates (for consumers) or death rates (for both consumers and
victims). Models may represent time, the independent variable, as a dis-
crete or continuous variable. With discrete census intervals (e.g., an insect
population in which onecounts individuals in year 0, year 1, and so on), the
difference equation N(t +1) =N(t)W(t) describes the population’s dynam-
ics, where W(t) is the finite growth “rate” over one time unit. If, instead,
we monitor the population continuously, a more natural formulation is
dN/dt = NF(t), where F(t) is the instantaneous per capita growth rate. The
quantities W(t)andF(t) describe the contribution an average individual
makes to the next time step, and so are closely related to Darwinian fit-
ness. Optimal foraging models all make assumptions about the relationship
between foraging decisions and functions such as W(t).
There are several basic questions that are perennial in the study of popu-
lation dynamics. The most basic question one can ask about a population is,
does it persist, or go extinct (i.e., does N(t)goto0atlarget)? One approach to
this question reliesonthe mostbasicmodel ofpopulationgrowth, the expo-
nential growthmodel dN/dt=rN,where ris the intrinsic growth rate (birth
rate minus death rate). This model describes the dynamics of a continu-
ously growing (or declining) population whose numbers are large enough
that we can treat it deterministically. If r < 0, the population declines
toward zero. Consequently, for a population to persist, it must have r ≥ 0.
In the text, we use this simple observation to conclude that optimal for-
aging may at times facilitate population persistence. Of course, if N is
near zero, the assumption that abundance is a continuous variable breaks
down. Stochastic birth-death models reveal that a population with ex-
pected births less than expected deaths at low N will surely go extinct, so
the basic insight of the exponential model still holds; however, popula-
tions with positive r values may nonetheless go extinct at low N due to
“demographic stochasticity,” reflecting the inherent randomness of indi-
vidual births and deaths (Renshaw 1991). These same models show that
we cannot determine whether a population will become extinct using only
the average values of births and deaths. For instance, if behavior A im-
plies an average birth rate of 2 and an average death rate of 0, whereas
behavior B leads to an average birth rate of 10 and an average death rate
of 8, the two behaviors have the same expected fitnesses (as measured by
expected growth rates), but they have different likelihoods of extinction
(zero for A, because A strategists don’t die, but greater than zero for B).
This observation suggests that in very small populations we may need
(Box 11.1 continued)
a somewhat different measure of fitness to characterize evolutionarily
persistence. At low densities, the effects of foraging decisions on deaths
may be more important than numerically equivalent effects on births.
Given a closed, persistent population, one can ask,whyisitthatthepop-
ulation does not increase in size indefinitely, but instead remains within some bound?
Broadly speaking,this requiresthat populationsbe “regulated,”in the sense
that their numbers decline when too high and increase when too low. In
turn, such regulation must rest on density dependence experienced by
individuals—average birth rates must decline, or average death rates must
increase, when density increases. After many years of debate about whether
we need population regulation and density dependence to explain popula-
tion persistence, students of population dynamics now agree that density-
dependent factors regulate populations (Royama 1992; Hanski 1999;
Turchin 1999). Given that a population persists, it should have a frequency
distribution of observed densities bounded away from zero (Turchin 1995).
Persistent populations may exhibit a wide range of dynamic behaviors,
ranging from tight regulation near an equilibrium abundance to regular
cycles to highly irregular fluctuations. What causes unstable dynamics?Ecolo-
gists continue to debate the relative importance of small-scale fluctuations
versus the effects of climate versus direct within-species interactions ver-
sus interactions with other species in generating each of these dynamic
outcomes (Bjornstad and Grenfell 2001). All of these processes have a role,
but the relative contribution of each clearly varies among systems. A very
active area of population ecology uses statistical time-series models to link
observed population fluctuations to mechanistic population models (Bjor-
nstad and Grenfell 2001; Kendall et al. 1999).
The three population questions we have just discussed roughly corre-
spond to what Turchin (2001) suggests may be the basic laws of ecology,
describing processes in all populations: (1) a propensity for populations
without external constraints to grow exponentially, (2) the inevitability
of density dependence and population regulation in a finite world, and (3)
the likelihood of cycles arising when consumers exploit living resources.
Royama (1992), Cappuccino and Price (1995), Hanski (1999) and Bjorn-
stad and Grenfell (2001) provide useful reviews of population dynamics.
Another layer of complexity in population dynamics that we have not
discussed revolves around the importance of the internal “structure” of
populations (for work on ages or stages, see Caswell 2001; for spatial
structure, see Holt 1985; Hassell 2000; McPeek et al. 2001).
Foraging and Population Dynamics 369
Foraging decisions are a fundamental driving force of population dynamics.
The dynamics of a population arise entirely from four processes: births,
deaths, immigration, and emigration (Williamson 1972). From a consumer’s
point of view, the resources it acquires while foraging govern its Darwinian
fitness via effects on fecundity or survival, which translate into changes in
population size. Because these effects may vary from one habitat to the next,
decisions to disperse or change habitats also influence numerical dynamics
via immigration or emigration rates. The relationships between foraging
decisions and demographic rates thus link foraging theory and population
dynamictheory. Asthecase ofsnowshoeharesindicates, theforagingdecisions
of onespecies may betightly linkedto the dynamicsof many otherspecies. For
prey species, the foraging decisions made by predators can strongly influence
mortality rates. For competing species that share a common food source, the
foraging decisions of competitors can alter the environment. For all of these
reasons, foraging decisions must profoundly drive or modulate population
dynamics. Recent years have seen an upsurge of interest in this interface
between behavior and population ecology, and a substantial literature on
this topic now exists (e.g., Fryxell and Lundberg 1998; Abrams 1992, 1999;
Abrams and Kawecki 1999; Krivan and Sikder 1999). The goal of this chapter
is toprovide anoverview ofthe influencesof foragingon populationdynamics
and the reciprocal influences of population dynamics on foraging.
11.3 “Top-down” versus “Bottom-up” Approaches Relating Individual
Behavior to Population Dynamics
To understand phenomena such as the Arctic lynx-hare cycle discussed in the
prologue, one needs population models. When abundances are great enough
to be treated as continuous rather than discrete variables (see box 11.1), one
uses differential equations (see also chap. 13), such as
dP
dt
= P [bB(R) − m ], (11.1)
the predator half of a predator-prey model. The variables are P (predator
density, say, of lynx [density is the number of individuals per unit area]),
R (resource or prey density, say, of hares), and t (time). The expression dP/dt
is the instantaneous rate of change in P; one can think of this as the difference
in P(dP) over a small time interval (dt). The biology enters into how one
relates this change in density to foraging and other factors. The quantity B(R)
is a function describing the rate at which prey are captured and consumed
(the predator’s “functional response”; Holling 1959a) as a function of prey
370 Robert D. Holt and Tristan Kimbrell
abundance. To relate foraging rates to predator population dynamics, one
must determine how foraging affects predator birth and death rates. In this
example, we assume that feeding influences births in a simple fashion, in that b
is aconversion factortranslating the rate of preyconsumption byan individual
predator into predator births. To finish this mathematical representation of
predator demography, we also must account for deaths. Here we simply as-
sume that predators die at a constant per capita mortality rate, m.
To completethemodel, weneed anexpression forpreydynamics (e.g.,hares):
dR
dt
= G(R) − PB(R). (11.2)
The quantity G(R) describes how the prey population grows in the absence
of predation. For instance, a hare population might grow according to the
classic logistic expression G(R) = rR(1 − R/K). The quantity r is the species’
intrinsic growth rate (the rate at which it grows when rare enough to grow
exponentially), and K is “carrying capacity,” the prey abundance at equilib-
rium with births matching deaths. In describing the predator population, B(R)
expresses the rate at which an individual predator consumes prey as a func-
tion of prey abundance. Therefore, the total mortality imposed by predators
onthepreypopulationisPB(R), which one must subtract from the prey’s
inherent growth to give the net growth shown in equation (11.2).
So far, wehave saidnothing specificaboutforaging. However,we canbuild
assumptions about behavior into the detailed form of the functional response.
Usually, B(R) will increase with R, or at least not decrease; feeding rates typi-
cally rise with increasing prey numbers. (Sometimes this assumption does not
hold, for example, if groups of prey defend themselves against predators,
but we assume that this is not the case.) A classic predator-prey model arises
if we make the following simplifying assumptions about foraging: that a
predator searches at a constant rate a while foraging in a nondepleting patch,
that each prey requires a fixed time h for the predator to handle it (during
which other prey cannot be encountered), and that each consumed prey is
worth a constant amount, b. Holling’s “disc” equation describes the rate at
which thepredator consumesprey (Holling1959a; Murdochand Oaten1975;
Hassell 1978, 2000), which translates into a predator recruitment term of
bB(R) =
baR
1 + ahR
, (11.3)
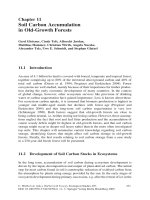
(the familiar saturating “type II” functional response). Figure 11.1 shows an
example of this functional response in the context of the classic optimal diet
model (see below and chap. 1). A crucial feature of this functional response
is that predators become saturated with prey when prey numbers are large.
Foraging and Population Dynamics 371
Figure 11.1. A graphical rendition of the classic optimal diet model, assuming sequential prey encounter
and fixed handling times. The saturating curves represent the expected foraging yield of a consumer when
it specializes on a particular resource (or prey type), of abundance R
i
(resource 1 in A and resource 2 in
B). The dashed lines represent the expected rate of yield resulting from having captured an item of type i
(which equals the net benefit, b
i
, divided by the handling time, h
i
). The maximum gain rate from feeding
exclusively on resource i (when it is very abundant) is b
i
/h
i
. Resource 1 is of higher quality than resource
2. (A) If resource 1 is sufficiently abundant, the expected yield from capturing and consuming a single
item of type 2 is less than the consumer can achieve by ignoring that item and continuing to search for
type 1; this implies that the consumer should specialize on resource 1 at abundances greater than the
intersection shown and generalize at lower abundances of R
1
. (B) Here, the consumer should always
consume resource 1, because even the maximal foraging yield it can obtain from resource 2 is less than
the yield it can obtain from a single encountered item of resource 1. As the graph shows, changing the
abundance of resource 2 does not change this relationship.
With multiple prey types, all parameters are indexed by prey type i =1, ,
n. This n-prey-type extension of the disc equation produces the following
harvest rate by a nonselective predator:
Y =
n
i =1
b
i
a
i
R
i
1 +
n
i =1
a
i
h
i
R
i
. (11.4)
372 Robert D. Holt and Tristan Kimbrell
A large theoretical literature takes this functional response as a given and
uses it to analyze questions of predator-prey dynamics. For instance, satu-
rating functional responses can permit prey to escape limitation by predators
temporarily and can generate sustained predator-prey cycles such as the hare-
lynx cycle. Model predators allowed to choose between prey types (“optimal
foragers,” for short) can exhibit very different functional forms relating feed-
ing ratesto prey density.For instance, Abrams(e.g., 1982, 1987)examined the
functional responsesof optimally foragingconsumers for awide range of ecol-
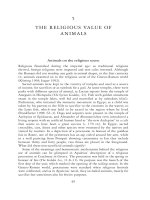
ogical scenarios. Figure 11.2 shows an example of the nontraditional func-
tional responses that can emerge when an optimal forager attacks two prey
containing different ratios of two required nutrients (e.g., nitrogen and phos-
phorus). The rate of consumption of resource (prey type) 1 increases with the
abundance ofresource 1,but withabrupt thresholds betweenlevels offeeding.
Figure 11.2B shows how the rate of consumption of resource 1 varies with the
abundance of the alternative resource. The functional response shows thresh-
old responses, and despite an overall decline in attacks on resource 1 with
increasing abundance of resource 2, some situations exist in which an increase
in resource2 leads toincreased attackson resource 1.These threshold responses,
when integrated into a population model, would generate abrupt changes in
population dynamics. Jeschke et al. (2002) provide a useful review of the wide
range of functional response forms that ecologists have proposed and show
how to incorporate digestive satiation as well as handling time constraints.
The above model of predator-prey dynamics illustrates a “top-down” ap-
proach to linking foraging and population dynamics (Schmitz 2001; Bolker
et al. 2003). This approach takes an existing population model and refines one
or more of its components in light of some idea about how the average con-
sumer’s foraging affects average birth or death rates. For instance, MacArthur
and Pianka (1966) constructed a model of how predatorsselect among prey
when prey differ in caloric value and handling time. Several investigators in-
terested in the effects of foraging on aspects of population dynamics have
used the MacArthur and Pianka model to address issues such as indirect in-
teractions between prey species (e.g., Holt 1977, 1983; Gleeson and Wilson
1986). Modelerscall this approach“mean-field” modeling: theresulting equa-
tions describe how average (mean) predator foraging rates vary as a function
of average (mean) prey densities, with a minimal specification of biological
details. Mean-field models do not capture all of the complexity of real popu-
lations; because of their simplicity, however, they often generate very clear
and testable predictions and clarify crucial conceptual issues.
Nonetheless, in many circumstances, considering average individuals ig-
nores critical features of ecological systems, features that become apparent
when one closely examines the behavior of individuals. Individual foragers
Foraging and Population Dynamics 373
Figure 11.2. Functional response of an optimal forager exploiting two prey species that contain different
mixes of two essential nutrients. (A) Consumption of resource (prey type) 1 with a fixed abundance of
resource 2. (B) Consumption of resource 1 with a fixed abundance of resource 1. Abrams (1987) argues
that consumer fitness should be an increasing function of the following quantity: minimum of {k
1
C
1
R
1
+
k
2
C
2
R
2
, β(1 − k
1
)C
1
R
1
+ (1 − k
2
)C
2
R
2
},whereR
i
is population density of resource i, C
i
is the attack
rate on resource i, k
i
is the proportion of nutrient a in resource i,(1− k
i
) is the proportion of nutrient
b in resource i,andβ is the ratio of nutrients a and b required in the diet for the consumer to survive.
Because the consumer needs both nutrients a and b, fitness can be assigned to the consumer only by de-
termining which nutrient is limiting. To do this, the amount of each nutrient being consumed must first be
compared, taking into account the ratio necessary for survival. The first term of the equation, (k
1
C
1
R
1
+
k
2
C
2
R
2
), is the amount of nutrient a that the forager is consuming. The second term of the equation,
β(1 − k
1
)C
1
R
1
+ (1 − k
2
)C
2
R
2
, is the amount of nutrient b the forager is consuming, but multiplied by β,
which uses the ratio of nutrients necessary for survival to convert nutrient b into the equivalent units of
nutrient a. Whichever amount is smaller is the nutrient limiting the consumer; therefore, the fitness of the
consumer is the minimum of the first or second term in the equation. (After Abrams 1987.)
show considerable variation in encounter rates with prey, and this variation
may influence overall population dynamics. Moreover, by focusing on indi-
viduals, one can explore the implications for population dynamics of features
of foraging behavior such as sampling, learning, and state dependence (e.g.,
dependence of foraging decisions on hunger). Focusing on the behaviors of
discrete individuals as a basis for developing population models is a “bottom-
up” approach to modeling. The development of high-powered computers
has allowed the ready exploration of models that incorporate the rich detail
374 Robert D. Holt and Tristan Kimbrell
of individual foraging behaviors. Individual-based models have burgeoned in
popularity (Grimm and Railsback 2005; Schmitz 2001). For example, Turner
et al. (1994) modeled individual elk (Cervus elaphus)andbison(Bison bison)for-
aging in Yellowstone National Park. The landscape of the model was a grid
withfeatures matchingspatially explicitdatadescribing theYellowstone land-
scape. The model tracked individual elk and bison as they foraged across the
landscape under different winter conditions and fire patterns. These authors
concluded that the proportion of elk and bison that could survive a severe
winter depended on the spatial pattern of fire in the landscape, a conclusion
that gives crucial guidance to park managers. Individual-based models made
it easier to incorporate realistic spatial information about the landscape and
details of individual foraging behavior. Individual-based models also permit
investigators to explore the implications of alternative scenarios.
As with the bison and elk foraging model, most individual-based models
begin with the investigator giving each individual a set of rules that define
its behavior, position in space, and fate through time. These models typically
represent space explicitly because each individual occupies a specific position.
The computer takes these rules and applies them, individual by individual, to
project the state of the system through time. Individual-based models com-
monly use probabilistic rules of individual behavior, which build stochasticity
into the system automatically. We will describe an individual-based model
for predator switching below.
Individual-based models do have disadvantages, however. To draw infer-
ences from individual-based models, one must compute averages over large
numbers of simulation runs; in complicated models, this makes it hard to
survey the available parameter space thoroughly. In addition, the complex-
ity of individual-based models makes it difficult to deduce which features
of the system account for a particular observed outcome. Individual-based
models can become so complex that they become a world unto themselves,
requiring so much effort to understand that they distract from the model’s
original goals. It can be very useful to use a hybrid approach that combines
“bottom-up” and “top-down” approaches. Several studies illustrate the ben-
efits of such hybrid approaches (e.g., Keeling et al. 2000; Illius and Gordon
1997).
11.4 Implications of Population Dynamics for Foraging
Before discussinghow foragingbehavior cangovern populationdynamics, we
will briefly consider how the dynamics of the resource base should influence
how foraging behavior evolves.
Foraging and Population Dynamics 375
Life in a Fluctuating World: Implications for Foraging Strategies
The magnitude and unpredictability of environmental variation strongly affects
foragingstrategies.Theterm“variance sensitivity”generally appliesto deci-
sion making in the face of uncertainty (Stephens and Krebs 1986; Bateson and
Kacelnik 1998). Unstable population dynamics in one species create a varying
resource for any species that exploits it. In the next few paragraphs, we will
discuss conceptual examples suggesting that temporal variability in the abun-
dance of prey populations can change the relative fitnesses of alternative for-
aging strategies.
We will first consider the effect of temporal variation in the abundance of
a preferred prey type on a forager’s decision to be selective or opportunistic.
Assume that a predator encounters two prey types sequentially. The predator
feeds in accord with the classic diet model, so while it is handling an item of
one prey type it cannot encounter any other prey. These assumptions lead to a
prediction, describedthoroughlyin Stephensand Krebs(1986): thedecision to
be a generalist or specialist depends on the abundance of the higher-quality
item (asmeasured bythe b/h ratio).The modelpredicts anabrupt shift between
specializing on the higher-quality item when it is abundant and eating both
prey types at lower abundances of the preferredprey. Figure 11.1A shows this
model graphically. A predator that consumes just the better prey, resource 1,
has a type II functional response and a corresponding saturation curve (the
solid line, Y(R)) describing the benefit it derives from foraging. The predator
obtains a constant rate of return while consuming a single item of the less
preferred species (the dashed line at b
2
/h
2
). If the benefit Y(R) (the solid curve)
exceeds b
2
/h
2
, the consumer will specialize on resource 1; if it falls below
b
2
/h
2
, the consumer should also take resource 2 whenever it is available. The
switch between the behaviors occurs at the resource level R
, where the solid
and dashed lines cross.
How does temporal variation in resource availability affect this switch
point? Assume that the preferred prey has a constant abundance, but the less
preferred prey varies greatly and unpredictably in abundance. Such variation
does not matter to inclusion of the better prey in the diet because its inclusion
does not depend on its abundance. By contrast, temporal variation in the
abundance of the preferred prey can influence the predator’s decision regard-
ing the poorer prey, and in particular, makes indiscriminate consumption
more likely. Let R
1
(t) be a function of time that describes the dynamics of the
preferred prey about an arithmetic mean abundance of
¯
R. Assume that preda-
tors can instantly and accurately assess resource abundance. Then, if R
1
(t)
> R
, the predator should specialize on resource 1; if R
1
(t) < R
, it should
generalize. If the predator can assess average foraging returns only over some
376 Robert D. Holt and Tristan Kimbrell
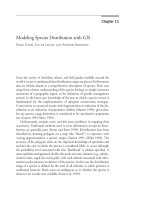
Figure 11.3. Unpredictable variation in resource abundance reduces expected foraging yield. The figure
shows a typical type II functional response to a single resource. If we hold the abundance of the resource
constant, the consumer achieves a higher foraging yield than it obtains from a variable mixture of good
and poor years. If the environment varies between poor and good years, the average or expected yield is
the midpoint of the straight line connecting the yields in each type of year. As shown, this average yield is
lower than that in a constant environment with resource abundance equal to the average of the good and
poor years. This is a case of Jensen’s inequality. In the text, we suggest that this effect of nonlinearity may
have implications both for diet choice and patch utilization.
long time period, then when faced with the decision to pursue encountered
individuals of resource 2, the predator should compare b
2
/h
2
to
Y
=
T
0
Y(t)
T
dt, (11.5)
the long-termtime-averaged foraging return.An algebraic rule called Jensen’s
inequality (Ruel and Ayres 1999) proves that Y is less than
Y, the foraging
yield given a fixed R =
R (see fig. 11.3 for a discussion of Jensen’s inequality).
We thus predict that an optimal forager is more likely to generalize in a
fluctuating environment.
Instead ofhaving the predatorencounter both preytypes in thesame patch,
we mightimagine thatthe twoprey typesoccupy differenthabitats. Temporal
variation in the abundance of aprey species in a given patch (leaving the rest of
the environment unchanged) should lower the expected foraging yield in that
patch (given a saturating functional response) relative to other, unchanged
patches. This should make it more likely that the predator will drop the patch
fromits foragingitinerary.In short, unpredictablevariationin preyabundance
tends to favor dietary generalization within habitats, but also may favor habitat
specialization that leads to dietary specialization because predators may avoid
habitats with variable prey abundance.
Foraging and Population Dynamics 377
We have assumed that resources vary unpredictably in abundance. If in-
stead resource abundance varies predictably (e.g., regular cycles), one expects
learning mechanisms toevolve so that foragers canexploit such predictability.
For instance, if prey abundance exhibits long-term cycles, and if predators
make diet choice decisions by averaging over rather short time scales, preda-
tors may generalize whenthe population of the preferredprey reaches the low
point of its population cycle and specialize when the preferred prey reaches a
population peak. For instance, in the lynx-hare system, the lynx seems to spe-
cialize onhares whenthey areabundant butto attacka widerrange ofprey (red
squirrels, etc.) when haresare scarce. This pattern may reflect the fact that hare
cycles are quite predictable. If the predator must pay costs for such behavioral
flexibility, then alternative foraging strategies may coexist in fluctuating en-
vironments. In section 11.6, we will discussan example of coexisting foraging
strategies involving predator switching when prey numbers vary through time.
Population Dynamic Constraints on Foraging Behavior
Changes in consumer abundance can alter the direction of selection on for-
aging. Guo et al. (1991) found that crowding in Drosophila cultures selected
for increased feeding rates (more feeding “gulps” per minute). In the “scram-
ble” competition experienced by larval fruit flies, larvae benefit from eating
quickly, even if this means that they process food less efficiently. In another
laboratory study with flies, Sokolowski et al. (1997) showed that high-density
environments selected for a strategy that traveled farther (“rover”), whereas
low-density situations selected for a strategy that traveled less (“sitter”).
Rovers move morefrom patch topatch when feeding, whereas sitters concen-
trate their feeding in a patch. These examples show that changes in consumer
abundance can alter how selection influences different facets of foraging (e.g.,
patch use strategies).
Consumer densitymay varyacross alandscape because ofchance orbecause
consumers stay together in herds or other social groups (Giraldeau and Caraco
2000; see also chap. 10). If increased consumer density depletes patches more
rapidly, why do some species aggregate? Obviously, the benefit of aggregat-
ing must outweigh the cost of increased competition. One hypothesis is that
groups find new patches more quickly, and consequently, group members ex-
perience lower variance in consumption rates than individuals foraging alone.
If variance inconsumption reduces consumer fitness,then the decrease in vari-
ance due to grouping may overcome the cost of aggregation. Another hy-
pothesis suggests that aggregation actually increases individual consumption
rates. For instance, large herbivores often prefer to consume immature veg-
etation because it is more digestible and higher in protein. Aggregation may
378 Robert D. Holt and Tristan Kimbrell
help to maintain vegetation at an immature stage; thus, an increase in forage
quality due to higher consumption rates can overcome the cost of aggrega-
tion. Thus, the interaction of a group with resources can produce an “Allee
effect”—so that over some range in density, individual consumer fitness in-
creases with increasing density.
Investigators more commonly observe that fitness declines with increasing
density (negative density dependence). Competition over shared resources,
termed exploitative competition, can alter foraging tactics. Consider a preda-
tor that must select a diet from two prey types in depleting patches. Should
it specialize on the higher-quality prey, eat prey indiscriminately, or modify
its foraging rules as the patch is depleted? Game theoretical studies suggest
that the answer depends on whether the predator has the patch all to itself or
must share the patch with others (Holt and Kotler 1987; Mitchell 1990). If
the predator is alone, it should generalize throughout each patch visit, as long
as conditions at the time of patch departure favor generalizing. If, instead,
a predator shares the patch with competitors, it should specialize early in
patch visits and expand its diet as the patch is depleted. When many predators
aggregate in a patch, the switch point occurs when consumption reduces the
abundance of thepreferred prey to the levelpredicted by the classicdiet model
(see fig. 11.1; Holt and Kotler 1987). The reason is that when generalists and
specialists forage together, the generalists spend time handling low-quality
items, while the specialists continue to deplete the high-quality items. Spe-
cialists thus achieve a higher overall foraging rate when they compete with
generalists. However, if a predator has a patch to itself, it should maximize its
rate of return over the entire time it occupies the patch. An isolated predator
can reduce its cumulative search time by always attacking both prey types
upon encounter. The likelihood of these two situations depends on predator
abundance. When predators are rare and randomly distributed, we would ex-
pect to find them foraging alone, and so they should feed indiscriminately on
both prey types; but when predators are abundant, it is likely that a predator
will frequently share patches with other predators, and so initially in each
patch, the predator should show diet selectivity.
Population Dynamics Can Indirectly Constrain Selection
on Foraging Behavior
Because of human introductions, there is an increasing number of invasive
species around the world. After their establishment, many non-native species
remain rare and localized, but begin expanding their range after a long time lag.
One hypothesis for this intriguing pattern is that initially these species are mal-
Foraging and Population Dynamics 379
adapted tothenovel environment:the invasionlag mayreflecta periodof evo-
lutionary adaptation (Holt et al. 2005). In some circumstances, evolutionary
biologists believe that such maladaptation can persist. For instance, Ernst
Mayr argued that recurrent gene flow from abundant populations at the cen-
ter of a species’ range into marginal, low-density populations can “swamp
out” locally adapted genotypes and thus keep the marginal populations in a
perpetual stateof maladaptation—potentially includingmaladaptive foraging
behavior.
The potential for such persistent maladaptation depends in part on pop-
ulation dynamics, which can influence the relative importance of selection
versus nonselective evolutionary processes. In some populations, individuals
may exhibit a mismatch with their environments because population dy-
namics magnify the importance of nonselective evolutionary processes such as
genetic drift, hybridization, and gene flow (Holt 1987a, 1996a, 1996b; Crespi
2000; Lenormand 2002). Several population dynamic factors make nonselec-
tive effects more likely. Chronically small or highly variable populations may
experience drift; populations low in abundance may also be particularly vul-
nerable to gene flow from other populations or hybridization with other
species. Large environmental changes or long-distance dispersal may put
species into circumstances they have not previously experienced, and if they
persist, they may be initially maladapted. By contrast, one expects finely
honed adaptations to local environments in large, stable populations that
experience constant conditions for many generations.
If environmental conditions permit strong, persistent selection in abun-
dant, stable populations, we expect realized foraging behaviors to be near
predicted optima. Strong selection occurs when the adaptive peak relating
fitnessto phenotypecurvessteeply, sothata smalldeviationfromthe optimum
has severe fitness costs. Weak selection occurs when the fitness peak is broad
and flat, so that many phenotypes have fitnesses close to the optimum
(fig. 11.4). The amount of deviation from local behavioral optima that one
might find should depend both on the fitness costs of deviations from the
optima and the demographic context of selection.
Spatial Variation
Consider a landscape where some habitats contain “source” populations
producing an excess of births over deaths, with the excess forced into “sink”
populations where deaths exceed births. We expect to observe a relatively
good fit between phenotypes and environment in the source habitat, but a
poorer fit betweenphenotypes and environment in thesink habitat. Models of
adaptive evolution in sink habitats (e.g., Holt 1996a; Holt and Gomulkiewicz
380 Robert D. Holt and Tristan Kimbrell
Figure 11.4. Fitnesses of phenotypes relative to an optimal phenotype. With a flat-topped fitness func-
tion, phenotypes far from the optimum may have almost the same fitness as the optimal phenotype; thus,
selection acts only weakly against deviations from the optimum. If the fitness function is sharply peaked,
phenotypes close to the optimum have fitnesses much lower than the optimal phenotype. The text argues
that the degree of maladaptation one might observe depends both on the shape of the fitness function
and on the demographic context of selection.
1997a, 1997b; Kawecki 1995) suggest that it may be difficult for selection to
sculpt adaptations to sink environments, particularly harsh ones, at least when
most mutations have small fitness effects. Recent environmental change (e.g.,
human-caused habitat degradation) makes this sort of maladaptation likely.
When a trade-off exists between performance in the sink and source habitats,
foragers will remain adapted to the source habitat, and local maladaptation in
the sink can persist indefinitely. Moreover, a behavior may be “maladapted”
whenexamined inone localenvironment,but “well-adapted”when evaluated
over the entire range of environments a population experiences (Brown and
Pavlovic 1992).
A similar phenomenon emerges even with ideal free habitat selection,
which implies that in a stable environment, no individuals will occupy sink
habitats. Assume that in each generation, individuals settle in one of two habitats
that differ in their carrying capacity. Assume also that they use rules of thumb
that create an ideal free distribution. When the population reaches demo-
graphic equilibrium, each habitat will be at its respective carrying capacity,
so the fraction of individuals in habitat 1 will be p = K
1
/(K
1
+ K
2
). Now
imagine that a mutant arises, and that this mutant increases fitness in habitat 1
by a small amount, at a life stage after habitat selection occurs. The probability
that an individual bearing this mutant is in habitat 1 is p.If K
1
K
2
,then
selection will be very weak, simply because the probability is low that the
Foraging and Population Dynamics 381
mutant will reside in the habitat where it can express its fitness advantage.
This implies that drift will often eliminate weakly favored mutants that im-
prove fitness in the rare habitat. Similarly, selection acts only weakly against
deleterious mutants that reduce fitness in the rare habitat. In effect, selection
will emphasize adaptationto the higher-K habitat atthe expense of adaptation
to the lower-K habitat.
Temporal Variation
In the lynx-hare system, populations fluctuate in abundance by factors
of 100 or more. One could, in principle, compare the precision of foraging
adaptations by lynx in years when lynx are common (which often are years
following peaks in hare abundance) with that in years when lynx are rare
(e.g., after a hare crash). A simple model suggests that when numbers are fluc-
tuating, selection may act more effectively in years with large populations.
Consider a species with discrete generations for which the equation N(t + 1) =
N(t)W(t) describes the population’s dynamics. W(t) represents the finite
growth “rate” in generation t (technically, W(t) is not a “rate,” because the
units are dimensionless, but this usage is customary in ecology). When pop-
ulations vary in growth over time, we find long-term fitness by calculating
the geometric mean of fitness (denoted by W
g
) in consecutive generations.
(We calculate the geometric mean of a string of n numbers by multiplying
those numbers and taking the nth root. This method is relevant to population
growth, which involves a multiplication of successive growth rates over time;
see box 7.3.) The finite growth rate (W
i
in year i) can vary as a function of
population size and environmental factors. These can all vary with i,aswellas
with the value of phenotypic parameters such as body size or movement rates.
Let us assume that the growth rate in each year depends on a single parameter,
α (e.g., body size or speed of movement during foraging). We assume that α
varies genetically within the population and that reproduction is clonal. If an
increase in α increases geometric mean fitness, then selection should favor a
clone with a higher value of α. The sensitivity of W
g
to α (the derivative of
W
g
with respect to α) governs the direction and rate of evolution. One can
show that this sensitivity is
∂W
g
∂α
=
1
W
i
∂W
i
∂α
, (11.6)
where the brackets denote an arithmetic average, in this case taken through
time. Notice the term 1/W
i
that appears on the right-hand side of equation
(11.6). This term will be large in generations when the realized growth rate
is small. This means that years of low fitness disproportionately influence
382 Robert D. Holt and Tristan Kimbrell
the relationship between long-term fitness and our α parameter. If a trait
has different effects in good and poor years, selection will emphasize the
poor-year effects.
Typically, a population fluctuating between upper and lower (nonzero)
bounds generates a negative statistical correlation between reproductive rate
and population size (Royama 1992, 31), regardless of the exact mechanism
regulating the population. In other words, on average, over time, animals
reproduce or survive less well in years when they are most abundant! Thus,
selection tends to emphasize years of high abundance because populations
then experience lower fitness. This may seem counterintuitive, because one
often assumes that population size reflects environmental plenitude and that
low growth rates mean small populations. This view often holds true when
we consider variation in space; we do observe larger populations in regions
of plenty, but this intuition leads us into error when we consider variation in
population size over time.
11.5 Implications of Foraging for Population Dynamics
Optimal Foraging and Population Persistence
As noted in box 11.1, the most basic question one can ask about a population’s
dynamics is, will the population go extinct or persist? A simple argument
suggests that optimal foraging behavior, all else being equal, promotes long-
term persistence in changed environments (Holt 1987a). Imagine that bad
weather or bad luck has reduced the populations of two species to the point
at which direct density dependence and frequency dependence have little
effect. Each species exists in heterogeneous environments and must make
foraging choices (e.g., should a forager be selective or opportunistic when
faced with several prey types?) In species 1, all individuals make optimal
decisions, whereas in species 2, many individuals make suboptimal decisions.
By definition, the reproductive fitness associated with an optimal behavioral
choice exceeds that associated with a suboptimal choice. Hence, when rare,
species 1 has a larger average rate of population growth than species 2.
Optimal foraging decisions should enhance a population’s ability to rebound
from dangerously low densities.
Optimal Foraging and Population Size
At high densities, however,we cannot make such a simple claimabout how
optimal foraging will affect population dynamics. Optimal foraging can indi-
rectly depress population size in several situations. For instance, optimal for-
Foraging and Population Dynamics 383
aging may permit predators to overexploittheir prey. In almost any predator-
prey model, overexploitation can arise; an increase in per predator capture
rates may reduce the number of predators a prey population can sustain. In
the basic predator-prey model presented in section 11.3, the prey population
equilibrates when the rate of prey recruitment matches the rate at which the
predator consumes prey (in symbols, G(R) = PB(R)). The predator popula-
tion equilibrates when the predator birth rate equals the predator mortality
(in symbols, when cB(R) =m, or when B(R) =m/c). We combine these two ex-
pressions to find that that the predicted abundance for the predator at equilib-
rium (the asterisk indicates equilibrium) is P
∗
= G(R
∗
)/B(R
∗
) = G(R
∗
)c/m.In
words, the equilibrium density of the predator equals prey recruitment, times
a conversion factor translating consumed prey into predator births, divided
by predator mortality. If a predator exploits prey more efficiently (higher c),
it needs to consume fewer prey to match its losses to mortality. For simplicity,
assume that prey consumption is B(R) = aR, where a is the “attack rate”; this
says that consumption increases proportionately with prey numbers. In this
case, the predator equation leads to R
∗
= c/am. By working with these ex-
pressions, one can show that if predators interact via exploitative competition
for prey, then selection favors the foraging behaviors that permit persistence
at the lowest possible abundance for the prey. Biologically reasonable models
of self-reproducing prey always lead to a hump-shaped relationship between
prey abundance and prey recruitment (G(R)), with maximal total growth at
a prey density (
˜
R) well above zero. If predators forage efficiently enough
to push the prey density to below this critical value (R <
˜
R), then optimal
foraging will reduce the number of predators sustained, because a high rate of
foraging reduces the number of prey and so depresses total prey recruitment
(and thus indirectly suppresses predator numbers).
Ideal Free Distribution
Another interesting way in which optimal foraging can reduce consumer
population size is via patch use strategies. One goal of population dynamics
is to understand patterns of abundance of species across space. A fundamental
prediction about spatial patterns in abundance arises from foraging. Consider
the following scenario: in one habitat patch, food items arrive at a rate of ten
items per hour; in another, poorer habitat patch, five items per hour arrive.
How should a group of foragers allocate themselves to these two patches? The
ten items per hour patch is definitely better, but if everyone forages there,
competition will reduce its value to the point at which some individuals can
do better by foraging in the poorer five items per hour patch. The classic ideal
free distribution addresses this problem (Fretwell and Lucas 1969; Fretwell
384 Robert D. Holt and Tristan Kimbrell
1972; see box 10.1). The ideal free distribution predicts that the distribution
of foragers (the number of foragers in patch A divided by the number of
foragers in patch B) should match the ratio of input rates. So in this example,
we expect twice as many foragers in the ten items per hour patch as in the
five items per hour patch. Another way of putting this is that, given an ideal
free distribution, one expects an equalization of fitness across space (so that
no individual benefits from moving).
As a population grows, it experiences a lower birth rate or a higher death
rate because of density dependence (e.g., due to exploitative competition).
In a constant environment, the population increases until it reaches a level
at which births just match deaths (so that average fitness is unity). Modelers
call the abundance at which this demographic balance occurs the “carrying
capacity.” Now assume that our population exploits several distinct patches,
each with its own resource renewal rate, leading to density dependence in
each patch. If the population can achieve an ideal free distribution, and is in
demographic balance, then we know two things: overall fitness is unity, and
all patches have the same fitness. For this to be true, we can infer that local
birth rates match local death rates in each patch. Thus, each patch equilibrates
at its own carrying capacity. The overall carrying capacity of a landscape for
an ideal free forager is just the summed carrying capacities over the separate
habitat patches.
Before pointing out how these dynamics may lead to a lower population
size (comparedwith a population of nonidealforagers), someother population
dynamicconsequences ofidealfree behaviorsare worth noting.To understand
populationdynamics, oneneeds tocharacterizehow populationsbehavewhen
perturbed from equilibrium, which often requires unraveling the mechanisms
that generate density dependence in local fitness. Ideal free behaviors can
lead to transient patterns of habitat use or equilibrium distributions quite
different from those expected with random habitat choice. For instance,
if population numbers are low, all individuals should occupy the habitat
providing the greatest individual fitness, but as numbers rise, there comes a
point (because ofdensity-dependent reductions in fitness) at which individuals
may startexploiting alternativehabitats. Thus,we expectthe degreeof habitat
specialization to vary as population size fluctuates.
Density dependence in consumer fitness can arise for many reasons (see
box 10.1). The most general may be that with exploitative competition,
resource supply declines with increasingconsumer numbers. The quantitative
expression of this density-dependent decline requires one to understand how
exploitation drives the dynamics of resource populations. Holt (1984) shows
how one can use models of predator-prey population interactions within
patches (similar to the model in section 11.3) to generate expressions relating
Foraging and Population Dynamics 385
predator fitnessto local predatornumbers. Thebottom line ofthis mechanistic
approach is that high carrying capacity for a consumer in a patch can be
associated with either strong or weak density dependence in the patch. This is
what allows ideal freebehavior to generate reductions in totalpopulation size.
There are many reasons why one might observe deviations from an ideal
freedistribution leading,for instance,toundermatching ofconsumernumbers
to resource inputs (see box 10.1). In general, these deviations imply that the
carrying capacity of the population will not match the summed carrying
capacities across the separate habitat patches. Holt (1985) gives examples in
which an ideal free distribution greatly depresses the size of a population
below the level expected if foragers were utilizing habitats at random. This
is particularly likely if density dependence is strong in patches with a high
carrying capacity. Thedegree to which a foragerfits the ideal free assumptions
thus matters greatly in determining its carrying capacity and in determining
how its habitat breadth should vary with changes in its numbers.
11.6 The Interplay of Population Structure, Foraging Behavior,
and Population Dynamics
Population dynamics and foraging can intersect in other ways. For instance,
the prey “types” that standard foraging theory considers may not correspond
to taxonomic species. Osenberg and Mittelbach (1989) studied pumpkinseed
sunfish feeding on snails and found that they had to incorporate selectivity for
size classesof snailsto understandpumpkinseed diets.Additionally, transitions
between life history stages (e.g., tadpole to frog) can create time lags in pop-
ulation growth. If a predator selectively attacks a particular life history stage,
we may not observe the dynamic consequences of this predation until later.
These time lags can lead to oscillations in abundance.
When individuals cannibalize their own species, foraging decisions may
have particularlydramaticdynamic effects.Many invertebratepredators prac-
tice cannibalism (Polis 1981; Elgar and Crespi 1992). Cannibalism should
reduce population growth—the principles of thermodynamics tell us that a
cannibal cannot convert each conspecific meal into an equivalent newborn!
Cannibalism often increases with density because increased density means
there is more for a cannibal to eat. Detailed models of cannibalism typically
include age or size structure. For instance, Claessen et al. (2002) developed
a dynamic model of cannibalism in Eurasian perch, in which juveniles out-
compete adults (because they survive at lower resource levels), but adults
attack juveniles in a certain size range. The size range of juvenile vulnera-
bility determines whether the population is stable or cycles. Adult foraging
386 Robert D. Holt and Tristan Kimbrell
decisions implicitly determine the threshold size of juveniles included in the
diet, and this, in turn, determines the dynamics of the population. Claessen et
al. tailored their model to several well-studied fish systems and showed that
it helps to explain dramatic observed patterns in population dynamics and
size structure. For instance, their model predicts that cannibalistic “giants”
will emerge in populations with unstable dynamics, while such classes of for-
aging specialists are less likely in stable populations. This prediction matches
observed patterns of cannibalism in perch and other fish species.
Stability
As noted above, optimal foraging can increase the growth rate of populations
at low numbers. If optimal foraging creates time lags in the effects of density
dependence, then high growth rates can generate unstable dynamics. This
instability arises because a moderately sized population can generate so many
offspring that they exceed the environmental carrying capacity, so that the
population crashes in the next generation. Depending on the details, this in-
stability can generate either sustained population cycles or chaotic dynamics.
Alternatively, as noted above, optimal foraging strategies may “buffer” pop-
ulations from fluctuations. If individuals leave local habitats when foraging
opportunities suddenly disappear, their behavior may moderate fluctuations
in overall population size. So it seems reasonable that foraging decisions could
stabilize populations in fluctuating environments.
The effects of foraging decisions on population dynamics make a compel-
ling connection with community ecology (i.e., interactions between species;
see chap. 12). To illustrate this connection, we will consider the “switching”
of generalist predators among alternative prey species. Before discussing
switching per se, however, we will briefly revisit the influence of functional
responses on population dynamics. Consider a predator population at a fixed
density. The functional response describes the relationship between predator
attacks and prey abundance. The simplest, type II functional response predicts
that the preyper capita mortality ratewill decline as prey abundance increases.
Since predation becomes less effective as prey numbers increase, predation
alone cannot regulate the prey. A similar result holds if a predator feeds on
two prey species in accord with the optimal diet model (Fryxell and Lundberg
1994). Fryxell and Lundberg (1994, 1998) suggest that constraints on optimal
diet choice (leading to partial preferences) may facilitate population stability.
As noted insection 11.3, real predators canalso have more complexfunctional
responses. For instance, if optimal foragers engage in nonforaging activities
when prey are scarce, the attack rate per prey may increase with increasing
prey density (at low prey densities). This leads to a sigmoid (or S-shaped)
Foraging and Population Dynamics 387
functional response (usually called a “type III”) in which predation responds
strongly to increases in prey density; this in turn may keep prey numbers in
check (Murdoch and Oaten 1975).
For many years, the conventional wisdom was that type III responses were
stabilizing. We now know that this is not always true. For instance, in the
temperate zone, insect hosts and parasitoids (e.g., a moth and a parasitic wasp
that attacks its caterpillar) can be locked in strong interactions that keep host
densities well below the level set by available food. When one incorporates
discrete, synchronized generations for such species into coupled population
models and assumes constant attack rates, the typical outcome is large-scale
oscillations in abundance that in reality would surely imply extinction for
both species. Yet such strongly interacting host-parasitoid systems do persist.
Much creative work has gone into trying to understand the factors that
permit their persistence. One avenue that seemed reasonable was to focus on
the detailed nature of the parasitoid’s functional response. However, a type
II functional response for the parasitoid turns out to enhance the inherent
instabilityof thesystem(Hassell andMay1973). Holling(1959b)surmised that
a type III response would stabilize the system, but Hassell and Comins (1978)
later showed that this functional response could never (by itself) stabilize the
interaction because the one-generation time lag between changes in parasitoid
abundance and the resulting effects on host mortality simply overwhelm the
potential stabilizing influence of the within-generation behavioral response
(Bernstein 2000).
More recently, ecologists have argued that the persistence of intrinsically
unstable predator-prey systems may depend on the interplay of population
dynamics, foraging, and spatial structure. This idea has implications for how
one views the evolutionary dynamics of foraging behaviors. As section 11.5
explained, the evolution of optimal predator foraging can lead to overex-
ploitation in a closed predator population. Several authors (Gilpin 1975; Pels
et al. 2002) have argued that dividing a population into partially isolated sub-
populations (as often happens in nature) may reduce the evolutionarily sta-
ble level of predation and prevent the overexploitation predicted by local
optimization.
Another potential influence on population stability comes from consid-
ering in more detail the community context of pairwise interactions. Up to
now, we have largely looked at the interplay of foraging and population
dynamics for single populations and for coupled predator-prey dynamics. We
will now turn to considering the community context of optimal foraging
(see also chap. 12) as we examine switching (Murdoch 1977) by generalist
predators among multiple prey species.