Basic Mathematics for Economists - Rosser - Chapter 8 doc
Bạn đang xem bản rút gọn của tài liệu. Xem và tải ngay bản đầy đủ của tài liệu tại đây (162.45 KB, 25 trang )
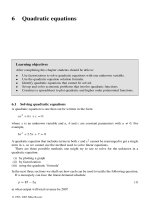
8 Introduction to calculus
Learning objectives
After completing this chapter students should be able to:
• Differentiate functions with one unknown variable.
• Find the slope of a function using differentiation.
• Derive marginal revenue and marginal cost functions using differentiation and
relate them to the slopes of the corresponding total revenue and cost functions.
• Calculate point elasticity for non-linear demand functions.
• Use calculus to find the sales tax that will maximize tax yield.
• Derive the Keynesian multiplier using differentiation.
8.1 The differential calculus
This chapter introduces some of the basic techniques of calculus and their application to
economic problems. We shall be concerned here with what is known as the ‘differential
calculus’.
Differentiation is a method used to find the slope of a function at any point. Although this
is a useful tool in itself, it also forms the basis for some very powerful techniques for solving
optimization problems, which are explained in this and the following chapters.
The basic technique of differentiation is quite straightforward and easy to apply. Consider
the simple function that has only one term
y = 6x
2
To derive an expression for the slope of this function for any value of x the basic rules of
differentiation require you to:
(a) multiply the whole term by the value of the power of x, and
(b) deduct 1 from the power of x.
In this example there is a term in x
2
and so the power of x is reduced from 2 to 1. Using the
above rule the expression for the slope of this function therefore becomes
2 × 6x
2−1
= 12x
This is known as the derivative of y with respect to x, and is usually written as dy/dx, which
is read as ‘dy by dx’.
© 1993, 2003 Mike Rosser
6
0
150
96
54
24
x
y
=
6x
2
6 54321
216
y
Figure 8.1
We can check that this is approximately correct by looking at the graph of the function
y = 6x
2
in Figure 8.1. Any term in x
2
will rise at an ever increasing rate as x is increased. In
other words, the slope of this function must increase as x increases. The slope is the derivative
of the function with respect to x, which we have just worked out to be 12x.Asx increases
the term 12x will also obviously increase and so we can confirm that the formula derived for
the slope of this function does behave in the expected fashion.
To determine the actual value of the slope of the function y = 6x
2
for any given value
of x, one simply enters the given value of x into the formula
Slope = 12x
When x = 4, then slope = 48; when x = 5, then slope = 60; etc.
Example 8.1
What is the slope of the function y = 4x
2
when x is 8?
Solution
By differentiating y we get
Slope =
dy
dx
= 2 × 4x
2−1
= 8x
When x = 8, then slope = 8(8) = 64.
© 1993, 2003 Mike Rosser
Example 8.2
Find a formula that gives the slope of the function y = 6x
3
for any value of x.
Solution
Slope =
dy
dx
= 3 × 6x
3−1
= 18x
2
for any value of x.
Example 8.3
What is the slope of the function y = 45x
4
when x = 10?
Solution
Slope =
dy
dx
= 180x
3
When x = 10, then slope = 180(1,000) = 180,000.
Test Yourself, Exercise 8.1
1. Derive an expression for the slope of the function y = 12x
3
.
2. What is the slope of the function y = 6x
4
when x = 2?
3. What is the slope of the function y = 0.2x
4
when x = 3?
4. Derive an expression for the slope of the function y = 52x
3
.
5. Make up your own single-term function and then differentiate it.
8.2 Rules for differentiation
The rule for differentiation can be formally stated as:
If y = ax
n
where a and n are given parameters then
dy
dx
= nax
n−1
When there are several terms in x added together or subtracted in a function then this rule
for differentiation is applied to each term individually. (The special rules for differentiating
functionswheretermsaremultipliedordividedareexplainedinChapter12.)
Example 8.4
Differentiate the function y = 3x
2
+ 10x
3
− 0.2x
4
.
© 1993, 2003 Mike Rosser
Solution
dy
dx
= 2 × 3x
2−1
+ 3 ×10x
3−1
− 4 ×0.2x
4−1
= 6x + 30x
2
− 0.8x
3
Example 8.5
Find the slope of the function y = 6x
2
− 0.5x
3
when x = 10.
Solution
Slope =
dy
dx
= 12x − 1.5x
2
When x = 10, slope = 120 − 1.5(100) = 120 −150 =−30.
Example 8.6
Derive an expression for the slope of the function y = 4x
2
+ 2x
3
− x
4
+ 0.1x
5
for any
value of x.
Solution
Slope =
dy
dx
= 8x + 6x
2
− 4x
3
+ 0.5x
4
In using the formula for differentiation, one has to remember that x
1
= x and x
0
= 1.
Example 8.7
Differentiate the function y = 8x.
Solution
y = 8x = 8x
1
dy
dx
= 1 × 8x
1−1
= 8x
0
= 8
Example 8.8
Derive an expression for the slope of the function y = 30x − 0.5x
2
for any value of x.
© 1993, 2003 Mike Rosser
Solution
Slope =
dy
dx
= 30x
0
− 2(0.5)x = 30 − x
Example 8.9
Differentiate the function y = 14x.
Solution
dy
dx
= 14x
1−1
= 14x
0
= 14
The example above illustrates the point that the derivative of any term in x (to the power of 1)
is simply the value of the parameter that x is multiplied by.
Any constant terms always disappear when a function is differentiated. To understand why,
consider a function with one constant such as the function y = 5. This could be written as
y = 5x
0
. Differentiating this function gives
dy
dx
= 0(5x
−1
) = 0
Example 8.10
Differentiate the function y = 20 + 4x − 0.5x
2
+ 0.01x
3
.
Solution
dy
dx
= 4 − x + 0.03x
2
Example 8.11
Derive an expression for the slope of the function y = 6 + 3x − 0.1x
2
.
Solution
Slope =
dy
dx
= 3 − 0.2x
Even when the power of x in a function is negative or not a whole number, the same rules
for differentiation still apply.
© 1993, 2003 Mike Rosser
Example 8.12
What is the slope of the function y = 4x
0.5
when x = 4?
Solution
Slope =
dy
dx
= 0.5 × 4x
0.5−1
= 2x
−0.5
When x = 4, slope = 2 × 4
−0.5
= 2 ×
1
2
= 1.
Example 8.13
Differentiate the function y = x
−1
+ x
0.5
.
Solution
dy
dx
=−1 × x
−1−1
+ 0.5x
0.5−1
=−x
−2
+ 0.5x
−0.5
Test Yourself, Exercise 8.2
1. Differentiate the function y = x
3
+ 60x.
2. What is the slope of the function y = 12 + 0.5x
4
when x = 5?
3. Derive a formula for the slope of the function y = 4 + 4x
−1
− 4x.
4. What is the slope of the function y = 4x
0.5
when x = 4?
5. Differentiate the function y = 25 − 0.1x
−2
+ 2x
0.3
.
6. Make up your own function with at least three different terms in x and then
differentiate it.
8.3 Marginal revenue and total revenue
What differentiation actually does is look at the effect of an infinitely small change in the
independent variable x on the dependent variable y in a function y = f(x). This may seem
a strange concept, and the rest of this section tries to explain how it works, but first consider
the following example which shows how a function can be differentiated from first principles.
Example 8.14
Differentiate the function y = 6x + 2x
2
from first principles.
© 1993, 2003 Mike Rosser
Solution
Assume that x is increased by the small amount x ( is the Greek letter ‘delta’ which
usually signifies a change in a variable). This will produce a small change y in y.
Given the original function
y = 6x + 2x
2
(1)
the new value of y (i.e. y +y) can be found by substituting the new value of x (i.e. x +x)
into the function. Thus
y + y = 6(x + x) + 2(x + x)
2
y + y = 6x + 6x + 2x
2
+ 4xx + 2(x)
2
Subtracting (1) y = 6x + 2x
2
gives y = 6x + 4xx + 2(x)
2
Dividing through by x,
y
x
= 6 + 4x + 2x
If x becomes infinitely small, then the last term disappears and
y
x
= 6 + 4x (2)
By definition, dy/dx is the effect of an infinitely small change in x on y. Thus, from (2),
dy
dx
= 6 + 4x
This is the same result for dy/dx that would be obtained using the basic rules for differentiation
explained in Section 8.2. It is obviously quickertousetheserulesthantodifferentiate from first
principles.However,Example8.14shouldnowhelpyoutounderstandhowthedifferential
calculus can be applied to economics.
Up to this point we have been using the usual algebraic notation for a single variable
function, assuming that y is dependent on x. Changing the notation so that we can look at
some economic applications does not alter the rule for differentiation as long as functions
are specified in a form where one variable is dependent on another.
In introductory economics texts, marginal revenue (MR) is sometimes defined as the
increase in total revenue (TR) received from sales caused by an increase in output by 1 unit.
This is nota precise definition though. It only gives an approximate value for marginal revenue
and it will vary if the units that output is measured in are changed. A more precise definition
of marginal revenue is that it is the rate of change of total revenue relative to increases in
output.
© 1993, 2003 Mike Rosser
TЈ
T
TR
C
0 q
£
A
B
Figure 8.2
In Figure 8.2 the rate of change of total revenue between points B and A is
TR
Q
=
AC
BC
= the slope of the line AB
which is an approximate value for marginal revenue over this output range.
Now suppose that the distance between B and A gets smaller. As point B moves along TR
towards A the slope of the line AB gets closer to the value of the slope of TT
, which is the
tangent to TR at A. (A tangent to a curve at any point is a straight line having the slope at
that point.) Thus for a very small change in output, MR will be almost equal to the slope of
TR at A. If the change becomes infinitesimally small, then the slope of AB will exactly equal
the slope of TT
. Therefore, MR will be equal to the slope of the TR function at any given
output.
We know that the slope of a function can be found by differentiation and so it must be the
case that
MR =
dTR
dq
Example 8.15
Given that TR = 80q −2q
2
, derive a function for MR.
Solution
MR =
dTR
dq
= 80 − 4q
This result helps to explain some of the properties of the relationship between TR and MR.
ThelineardemandscheduleDinFigure8.3representsthefunction
p = 80 − 2q (1)
© 1993, 2003 Mike Rosser
0
0
D
MR
TR
800
80
q
4020
£
q
p
Figure 8.3
We know that by definition TR = pq. Therefore, substituting (1) for p,
TR = (80 −2q)q = 80q − 2q
2
whichisthesameastheTRfunctioninExample8.15above.ThisTRfunctionisplottedin
the lower section of Figure 8.3 and the function for MR, already derived, is plotted in the top
section.
You can see that when TR is rising, MR is positive, as one would expect, and when TR is
falling, MR is negative. As the rate of increase of TR gets smaller so does the value of MR.
When TR is at its maximum, MR is zero.
With the function for MR derived above it is very straightforward to find the exact value of
the output at which TR is a maximum. The TR function is horizontal at its maximum point
and its slope is zero and so MR is also zero. Thus when TR is at its maximum
MR = 80 −4q = 0
80 = 4q
20 = q
© 1993, 2003 Mike Rosser
One can also see that the MR function has the same intercept on the vertical axis as this
straight line demand schedule, but twice its slope. We can show that this result holds for any
linear downward-sloping demand schedule.
For any linear demand schedule in the format
p = a −bq
TR = pq = (a − bq)q = aq − bq
2
MR =
dTR
dq
= a −2bq
Thus both the demand schedule and the MR function have a as the intercept on the ver-
tical axis, and the slope of MR is 2b which is obviously twice the demand schedule’s
slope.
It should also be noted that this result does not hold for non-linear demand schedules. If
a demand schedule is non-linear then it is best to derive the slope of the MR function from
first principles.
Example 8.16
Derive the MR function for the non-linear demand schedule p = 80 − q
0.5
.
Solution
TR = pq =
80 − q
0.5
q = 80q − q
1.5
MR =
dTR
dq
= 80 − 1.5q
0.5
In this non-linear case the intercept on the price axis is still 80 but the slope of MR is 1.5 times
the slope of the demand function.
For those of you who are still not convinced that the idea of looking at an ‘infinitesimally
small’ change can help find the rate of change of a function at a point, Example 8.17 below
shows how a spreadsheet can be used to calculate rates of change for very small increments.
This example is for illustrative purposes only though. The main reason for using calculus
in the first place is to enable the immediate calculation of rates of change at any point of
a function.
Example 8.17
For the total revenue function
TR = 500q − 2q
2
© 1993, 2003 Mike Rosser
find the value of MR when q = 80 (i) using calculus, and (ii) using a spreadsheet that
calculates increments in q above the given value of 80 that get progressively smaller. Compare
the two answers.
Solution
(i) MR =
dTR
dq
= 500 − 4q
Thus when q = 80
MR = 500 −4(80) = 500 − 320 = 180
(ii)ThespreadsheetshowninTable8.2canbeconstructedbyfollowingtheinstructionsin
Table 8.1. This spreadsheet shows that as increments in q (relative to the initial given
value of 80) become smaller and smaller the value of MR (i.e. TR/q) approaches
180. This is consistent with the answer obtained by calculus in (i).
Table 8.1
CELL Enter
Explanation
A1 to B4
and
A6 to E6
Enter labels as shown
in Table 8.2
Labels to indicate where initial values go plus
column
heading labels
D2
TR = 500q - 2q^2
Label to remind you what function is used.
D3 80
Given initial value for q.
D4
=500*D3-2*D3^2
Calculates TR corresponding to given q value.
B7
10
Initial size of increment in q.
B8
=B7/10
Calculates an increment in q that is only 10% of
the value of the one in cell above.
B9 to
B13
Copy cell B8 formula
down column B
Calculates a series of increments in q that get
smaller and smaller each time.
A7
=B7+D$3
Calculates new value of q by adding the
increment in cell A7 to the given value of 80.
A8 to
A13
Copy cell A7 formula
down column A
Calculates a series of values of q that increase by
smaller and smaller increments each time.
C7
=500*A7-2*A7^2
Calculates TR corresponding to value of q in cell
A7.
C8 to
C13
Copy cell C7 formula
down column C
Calculates a series of values of TR
corresponding to values of q in row A.
D7
=C7-D$4
Calculates the change in TR relative to the initial
given value in cell D4.
D8 to
D13
Copy cell D7 formula
down column D
Calculates series of changes in TR
corresponding to increments in q in row B.
E7
=D7/B7
Calculates ∆TR / ∆ q
Calculates values of ∆TR / ∆ q corresponding to
E8 to
E13
Copy cell E7 formula
down column E
decreasing increments in q and TR
A7 to
E13
Widen columns and
increase number of
decimal places as
necessary.
The point of this example is to show how the
the decimal places need to be shown.
value of ∆TR / ∆ q converges on dTR/dq so all
© 1993, 2003 Mike Rosser
Table 8.2
A B C D E
1 Ex 8.17 DIFFERENTIATION OF TR FUNCTION
2 GIVEN FUNCTION TR = 500q - 2q^2
3 INITIAL q VALUE = 80
4 INITIAL TR VALUE = 27200
5 Marginal Revenue
6 q Delta q TR Delta TR (DeltaTR)/(Delta q)
7 90 10 28800 1600 160
8 81 1 27378 178 178
9 80.1 0.1 27217.98 17.98 179.8
10 80.01 0.01 27201.7998 1.7998 179.98
11 80.001 0.001 27200.18 0.179998 179.998
12 80.0001 0.0001 27200.018 0.01799998 179.9998
13 80.00001 0.00001 27200.0018 0.001800000 179.9999802
Test Yourself, Exercise 8.3
1. Given the demand schedule p = 120 − 3q derive a function for MR and find the
output at which TR is a maximum.
2. For the demand schedule p = 40 −0.5q find the value of MR when q = 15.
3. Find the output at which MR is zero when p = 720 −4q
0.5
describes the demand
schedule.
4. A firm knows that the demand function for its output is p = 400 − 0.5q. What
price should it charge to maximize sales revenue?
5. Make up your own demand function and then derive the corresponding MR
function and find the output level which corresponds to zero marginal revenue.
8.4 Marginal cost and total cost
Just as MR can be shown to be the rate of change of the TR function, so marginal cost (MC)
is the rate of change of the total cost (TC) function. In fact, in nearly all situations where one
is dealing with the concept of a marginal increase, the marginal function is equal to the rate
of change of the original function, i.e. to derive the marginal function one just differentiates
the original function.
Example 8.18
Given TC = 6 + 4q
2
derive the MC function.
Solution
MC =
dTC
dq
= 8q
© 1993, 2003 Mike Rosser
£
0
£
0
TC
q
q
MC
M
Figure 8.4
The example above is somewhat unrealistic in that it assumes an MC function that is a straight
line. This is because the TC function is given as a simple quadratic function, whereas one
normally expects a TC function to have a shape similar to that shown in Figure 8.4. This
represents a cubic function with certain properties to ensure that:
(a) the rate of change of TC first falls and then rises, and
(b) TC never actually falls as output increases, i.e. MC is never negative. (Although it is
quite common to find economies of scale causing average costs to fall, no firm is going
to find the total cost of production falling when output increases.)
The flattest point of this TC schedule is at M, which corresponds to the minimum value
of MC.
A cubic total cost function has the above properties if
TC = aq
3
+ bq
2
+ cq +d
where a, b, c and d are parameters such that
a, c,d > 0,b <0 and b
2
< 3ac.
This applies to the TC functions in the examples below.
Example 8.19
If TC = 2.5q
3
− 13q
2
+ 50q + 12 derive the MC function.
© 1993, 2003 Mike Rosser
Solution
MC =
dTC
dq
= 7.5q
2
− 26q + 50
Example 8.20
When will average variable cost be at its minimum value for the TC function.
TC = 40 + 82q − 6q
2
+ 0.2q
3
?
Solution
The theory of costs tells us that MC will cut the minimum point of both the average cost (AC)
and the average variable cost (AVC) functions. We therefore need to derive the MC and AVC
functions and find where they intersect.
It is obvious from this TC function that total fixed costs TFC = 40 and total variable costs
TVC = 82q −6q
2
+ 0.2q
3
. Therefore,
AV C =
TVC
q
= 82 − 6q + 0.2q
2
and
MC =
dTC
dq
= 82 − 12q + 0.6q
2
Setting MC = AVC
82 − 12q + 0.6q
2
= 82 − 6q + 0.2q
2
0.4q
2
= 6q
q =
6
0.4
= 15
at the minimum point of AVC.
(When you have covered the analysis of maximization and minimization in the next chapter,
come back to this example and see if you can think of another way of solving it.)
Test Yourself, Exercise 8.4
1. If TC = 65 + q
1.5
what is MC when q = 25?
2. Derive a formula for MC if TC = 4q
3
− 20q
2
+ 60q + 40.
3. If TC = 0.5q
3
− 3q
2
+ 25q + 20 derive functions for: (a) MC, (b) AC, (c) the
slope of AC.
4. What is special about MC if TC = 25 + 0.8q?
5. Make up your own TC function and then derive the corresponding MC function.
© 1993, 2003 Mike Rosser
8.5 Profit maximization
We are now ready to see how calculus can help a firm to maximize profits, as the following
examples illustrate. At this stage we shall just use the MC = MR rule for profit maxi-
mization. The second condition (MC cuts MR from below) will be dealt with in the next
chapter.
Example 8.21
A monopoly faces the demand schedule p = 460 − 2q
and the cost schedule TC = 20 + 0.5q
2
How much should it sell to maximize profit and what will this maximum profit be? (Allcosts
and prices are in £.)
Solution
To find the output where MC = MR we first need to derive the MC and MR functions.
Given TC = 20 + 0.5q
2
then MC =
dTC
dq
= q (1)
As TR = pq = (460 − 2q)q = 460q − 2q
2
then MR =
dTR
dq
= 460 − 4q (2)
To maximize profit MR = MC. Therefore, equating (1) and (2),
460 − 4q = q
460 = 5q
92 = q
The actual maximum profit when the output is 92 will be
TR − TC = (460q −2q
2
) − (20 + 0.5q
2
)
= 460q − 2q
2
− 20 − 0.5q
2
= 460q − 2.5q
2
− 20
= 460(92) − 2.5(8,464) − 20
= 42,320 − 21,160 −20 = £21,140
© 1993, 2003 Mike Rosser
Example 8.22
A firm faces the demand schedule p = 184 − 4q
and the TC function TC = q
3
− 21q
2
+ 160q + 40
What output will maximize profit?
Solution
Given TR = pq = (184 − 4q)q = 184q − 4q
2
then MR =
dTR
dq
= 184 − 8q
MC =
dTC
dq
= 3q
2
− 42q + 160
To maximize profits MC = MR. Therefore,
3q
2
− 42q + 160 = 184 −8q
3q
2
− 34q − 24 = 0
(q − 12)(3q + 2) = 0
q − 12 = 0or3q + 2 = 0
q = 12 or q =−
2
3
One cannot produce a negative quantity and so the firm must produce 12 units of output in
order to maximize profits.
Test Yourself, Exercise 8.5
1. A monopoly faces the following TR and TC schedules:
TR = 300q − 2q
2
TC = 12q
3
− 44q
2
+ 60q + 30
What output should it sell to maximize profit?
2. A firm faces the demand function p = 190 − 0.6q
and the total cost function TC = 40 + 30q + 0.4q
2
(a) What output will maximize profit?
(b) What output will maximize total revenue?
(c) What will the output be if the firm makes a profit of £4,760?
© 1993, 2003 Mike Rosser
3. A firm’s total revenue and total cost functions are
TR = 52q − q
2
TC =
q
3
3
− 2.5q
2
+ 34q + 4
At what output will profit be maximized?
8.6 Respecifying functions
Many of the examples considered so far have included a demand schedule in the format
p = a +bq
although,aswasexplainedinChapter4,economictheorynormallydefinesademandfunction
in the format q = f(p), with q being the dependent variable rather than p. However, because
the usual convention is to have p on the vertical axis in supply and demand graphical analysis,
and also because cost functions have q as the independent variable, it usually helps to work
with the inverse demand function p = f(q). The examples below show how to derive the
relationship between MR and q by finding the inverse demand function.
Example 8.23
Derive the MR function for the demand function q = 400 − 0.1p.
Solution
Given q = 400 − 0.1p
10q = 4,000 −p
p = 4,000 − 10q
Using this inverse demand function we can now derive
TR = pq = (4,000 − 10q)q = 4,000q − 10q
2
MR =
dTR
dq
= 4,000 − 20q
Example 8.24
A firm faces the demand schedule q = 200 − 4p
and the cost schedule TC = 0.1q
3
− 0.5q
2
+ 2q + 8
What price will maximize profit?
© 1993, 2003 Mike Rosser
Solution
The demand function q = 200 − 4p
can be rewritten as p = 50 −0.25q
This is a linear demand schedule and so MR has the same intercept and twice the
slope. Thus
MR = 50 −0.5q
From the TC function
MC =
dTC
dq
= 0.3q
2
− q + 2
To maximize profits MC =MR. Therefore, equating the MR and MC functions already
derived
0.3q
2
− q + 2 = 50 −0.5q
0.3q
2
− 0.5q − 48 = 0
Using the formula for the solution of quadratic equations
q =
−(−0.5) ±
(−0.5)
2
− 4 ×0.3 × (−48)
2 × 0.3
=
0.5 ±
√
0.25 + 57.6
0.6
=
0.5 ±
√
57.85
0.6
Disregarding the negative solution as output cannot be negative
q =
0.5 + 7.6
0.6
=
8.1
0.6
= 13.5
Substituting this output into the demand function
p = 50 − 0.25q = 50 − 3.375 = 46.625
Test Yourself, Exercise 8.6
1. Given the demand function q = 150 − 3p, derive a function for MR.
2. A firm faces the demand schedule q = 40 − p
0.5
(where p
0.5
≥ 0,q ≤ 40) and
the cost schedule TC = q
3
− 2.5q
2
+ 50q + 16. What price should it charge to
maximize profit?
3. Find the MR function corresponding to the demand schedule q = (60 −2.5p)
0.5
.
© 1993, 2003 Mike Rosser
T
A
TЈ
B
D
0
p
q
∆p
∆ q
q
1
q
2
p
2
p
1
Figure 8.5
8.7 Point elasticity of demand
Price elasticity of demand is defined as
e = (−1)
percentage change in quantity
percentage change in price
However, looking at the changes in price and quantity between points A and B on the demand
schedule D in Figure 8.5, the question you may ask is ‘percentage of what’? Clearly the
change in quantity q is a much larger percentage of q
1
than of the larger quantity q
2
.
Although arc elasticity gives an approximate ‘average’ measure, a more precise measure can
be obtained by finding the elasticity of demand at a single point on the demand schedule. In
Chapter4somesimpleexamplesofpointelasticitybasedonlineardemandscheduleswere
considered. With the aid of calculus we can now also derive point elasticity for non-linear
demand schedules.
If the movement along D from A to B in Figure 8.5 is very small then we can assume
p
1
= p
2
= p and q
1
= q
2
= q and so
e = (−1)
q/q
p /p
= (−1)
p
q
1
p/q
(1)
As B gets nearer to A the value of p/q, which is the slope of the straight line AB, gets
closer to the slope of the tangent TT
at A. (Note that, as price falls in this example, p is
negative, giving a negative value for the relevant slopes.) Thus for an infinitesimally small
movement from A
p
q
=
dp
dq
= slope of D at A
© 1993, 2003 Mike Rosser
Thus, substituting this result into (1) above, the formula for point elasticity of demand
becomes
e = (−1)
p
q
1
dp/dq
Example 8.25
What is point elasticity when price is 12 for the demand function p = 60 − 3q?
Solution
dp
dq
=−3
Given p = 60 − 3q, then
3q = 60 − p
q =
60 − p
3
When p = 12, then
q =
60 − 12
3
=
48
3
= 16
Therefore,
e = (−1)
p
q
1
dp/dq
= (−1)
12
16
×
1
−3
= 0.25
Example 8.26
What is elasticity of demand when quantity is 8 if a firm’s demand function is q = 60−2p
0.5
(where p
0.5
≥ 0, q ≤ 60)?
Solution
Deriving the inverse of the demand function
q = 60 − 2p
0.5
2p
0.5
= 60 − q
p
0.5
= 30 − 0.5q
p = (30 − 0.5q)
2
= 900 − 30q + 0.25q
2
© 1993, 2003 Mike Rosser
Therefore,
dp
dq
=−30 + 0.5q
When q = 8,
dp
dq
=−30 + 0.5(8) =−30 +4 =−26
Also, when q = 8,
p = 900 − 30(8) +0.25(8)
2
= 900 − 240 + 16 = 676
Thus
e = (−1)
p
q
1
dp/dq
= (−1)
676
8
×
1
−26
= 3.25
Test Yourself, Exercise 8.7
1. What is the point elasticity of demand when price is 20 for the demand schedule
p = 45 − 1.5q?
2. Explain why the point elasticity of demand decreases in value as one moves down
a straight line demand schedule.
3. Given the demand function q = (1,200 − 2p)
0.5
, what is elasticity of demand
when quantity is 30?
4. Explain why the demand function q = 265p
−1
will have the same point elasticity
of demand at all prices and say what its value is.
8.8 Tax yield
Elementary supply and demand analysis tells us that the effect of a per-unit tax t on a good
sold in a competitive market will effectively shift up the supply schedule vertically by the
amount of the tax. This will cause the price paid by consumers to rise and the quantity bought
to fall. The change in total revenue spent by consumers will depend on the price elasticity of
demand.
The Chancellor of the Exchequer, however, is more interested in the total amount of tax
raised for the government, or the tax yield (TY), than total consumer expenditure. If a per-unit
tax is increased, the quantity bought will always fall. The question, however, is whether or
not this fall in quantity will outweigh the effect on TY of the increase in the amount of tax
raised on each unit. To answer this we need to know the rate of change of the tax yield with
respect to increases in the per-unit tax.
© 1993, 2003 Mike Rosser
Example 8.27
A market has the demand schedule p = 92−2q and the supply schedule p = 12 +3q. What
per-unit tax will raise the maximum tax revenue for the government? (All prices are in £.)
Solution
Let the per-unit tax be t. This changes the supply schedule to
p = 12 + t + 3q
i.e. the intercept on the price axis shifts vertically upwards by the amount t.
We now need to derive a function for q in terms of the tax t . In equilibrium, supply price
equals demand price. Therefore,
12 + 3q + t = 92 − 2q
5q = 80 − t
q = 16 − 0.2t
The tax yield is (amount sold) × (per-unit tax). Therefore,
TY = qt = (16 −0.2t)t = 16t − 0.2t
2
and so the rate of change of TY with respect to t is
dTY
dt
= 16 − 0.4t
If dTY/dt>0, an increase in t will increase TY. However, from the formula for dTY/dt
derived above, one can see that as the amount of the tax t is increased the value of dTY/dt
falls. Therefore in order to maximize TY, t should be increased until dTY/dt = 0. Any further
increases in t would cause dTY/dt to become negative and cause TY to start to fall. Thus
dTY
dt
= 16 − 0.4t = 0
16 = 0.4t
40 = t
Therefore a per-unit tax of £40 will maximize the tax yield.
Rather than working from first principles, as in the above example, a general formula can
be derived for the rate of change of the tax yield with respect to a per-unit tax if both demand
and supply schedules are linear. Assume that these schedules are:
demand p = a + bq supply p = c + dq
where a, b,c and d are parameters (note that we expect b<0).
With a per-unit tax of t, the supply schedule becomes
p = c + dq +t
© 1993, 2003 Mike Rosser
Setting supply price equal to demand price we can derive the reduced form equation for TY
in terms of the independent variable t and then differentiate it to find the comparative static
effect of a change in t.
c + dq + t = a +bq
q(d − b) = a − c − t
q =
a − c
d − b
−
t
d − b
TY = qt =
a − c
d − b
t −
t
2
d − b
dTY
dt
=
a − c
d − b
−
2t
d − b
(1)
WecancheckthisformulausingthefiguresfromExample8.27above.Giventhedemand
schedule p = 92 −2q and the supply schedule p = 12 + 3q, then
a = 92 b =−2 c = 12 d = 3
Substituting these values into (1) above
dTY
dt
=
92 − 12
3 − (−2)
−
2t
5
=
80
5
−
2t
5
= 16 − 0.4t
This is the same as the function derived from first principles in Example 8.27.
Test Yourself, Exercise 8.8
1. Given the demand schedule p = 180 −8q and the supply schedule p = 25 +2q,
what level of per-unit tax would maximize the government’s tax yield?
2. Change one of the parameters in Question 1 above and work out the new answer.
3. Assume a market has the demand function q = 40 −0.5p and the supply function
q = 2p − 4. The government currently imposes a per-unit tax of £3. If this tax is
slightly increased will the tax yield rise or fall?
8.9 The Keynesian multiplier
In a simple Keynesian macroeconomic model with no government sector and no foreign
trade, it is assumed that
Y = C + I (1)
C = a + bY (2)
where Y is national income, C is consumption and I is investment, exogenously fixed, and
a and b are parameters.
The marginal propensity to consume (MPC) is the rate of change of consumption as
national income increases, which is equal to dC/dY = b. The multiplier is the rate of
© 1993, 2003 Mike Rosser
change of national income in response to an increase in exogenously determined investment,
i.e. dY/dI. The result that the multiplier is equal to
1
1 − MPC
can be easily derived by differentiation.
Substituting (2) into (1) we get
Y = a + bY + I
Y(1 − b) = a + I
Y =
a + I
1 − b
=
a
1 − b
+
I
1 − b
Therefore
dY
dI
=
1
1 − b
which is the formula for the multiplier.
This multiplier can be used to calculate the increase in investment necessary to achieve
any specified increase in national income.
Example 8.28
In a basic Keynesian macroeconomic model it is assumed that Y = C + I where I = 250
and C = 0.75Y . What is the equilibrium level of Y ? What increase in I would be needed to
cause Y to increase to 1,200?
Solution
Y = C + I = 0.75Y + 250
0.25Y = 250
Equilibrium level Y = 1,000.
For any increase (I )inI the resulting increase(Y )inY will be determined by the formula
Y = KI (1)
where K is the multiplier. We know that
K =
1
1 − MPC
In this example, MPC = dC/dY = 0.75. Therefore,
K =
1
1 − 0.75
=
1
0.25
= 4(2)
© 1993, 2003 Mike Rosser
The required change in Y is
Y = 1,200 − 1,000 = 200 (3)
Therefore, substituting (2) and (3) into (1),
200 = 4I
I = 50
This is the required increase in I .
Multipliers for other exogenous variables in more complex macroeconomic models can be
derived using the same method. However, for differentiation with respect to one exogenous
variable the other variables must remain constant and so we shall return to this topic in
Chapter10whenpartialdifferentiationisexplained.
Test Yourself, Exercise 8.9
1. In a basic Keynesian macroeconomic model it is assumed that Y = C + I where
I = 820 and C = 60 + 0.8Y .
(a) What is the marginal propensity to consume?
(b) What is the equilibrium level of Y ?
(c) What is the value of the multiplier?
(d) What increase in I is required to increase Y to 5,000?
(e) If this increase takes place will savings (Y − C) still equal I ?
© 1993, 2003 Mike Rosser