Influence of positive active material type and grid alloy on corrosion layer structure docx
Bạn đang xem bản rút gọn của tài liệu. Xem và tải ngay bản đầy đủ của tài liệu tại đây (1.71 MB, 16 trang )
Influence of positive active material type and grid alloy on
corrosion layer structure and composition in the valve
regulated lead/acid battery
R.J. Ball
a,*
, R. Kurian
b
, R. Evans
c
, R. Stevens
a
a
Department of Engineering and Applied Science, University of Bath, Bath, BA2 7AY, UK
b
Hawker Ltd., Stephenson St. Newport NP9 0XJ, UK
c
Invensys, Westinghouse site, Chippenham, Wiltshire, SN15 1SJ, UK
Received 9 September 2001; received in revised form 4 March 2002; accepted 11 March 2002
Abstract
Performance of a valve regulated lead/acid battery is affected by the properties of the positive grid corrosion layer. An investigation has
been carried out using a range of experimental techniques to study the influence of corrosion layer composition and structure on cyclic
performance. A number of designs of battery were manufactured with different grids and positive active materials (PAMs). Two grid types
were used consisting of either pure lead or a lead/tin alloy. Variations in PAM composition and structure were obtained by forming electrodes
from grey oxide pastes containing additions of, red lead, tetrabasic lead sulphate, or sulphuric acid (sulphated). Results indicated that both grid
alloy composition and PAM type affect the corrosion layer properties. Ultra-microtoming was used to prepare sections of the grid/corrosion
layer interface. Results showed that corrosion propagated along tin rich grain boundaries.
# 2002 Elsevier Science B.V. All rights reserved.
Keywords: VRLA; Corrosion layer; EPMA; Ultra-microtoming
1. Introduction
The corrosion layer is one of the most important compo-
nents of the positive electrode. Its properties will influence
battery operation since electrons generated must flow
through it. The ease with which electrons can flow is
dependant on geometry, composition, structure and thick-
ness. High currents can be generated as a result of the large
difference in surface area between the positive active mate-
rial (PAM) and grid. For a typical grid with a surface area of
around 50 cm
2
the corresponding PAM area will be in the
region of 500 m
2
[1].
The corrosion layer is first formed during plate curing and
then increases in thickness as the battery is cycled. Thick-
ness will be influenced by curing parameters such as tem-
perature, humidity and oxygen concentration. Corrosion
layers commonly consist of a multi-layered structure com-
prising of lead oxides of different stoichiometry. Normally
the concentration of oxygen within the corrosion layer
increases with distance away from the grid. This is because
oxygen must diffuse from the outer surface of the layer
towards the grid.
The change in molar volume that occurs when Pb is
oxidised to PbO
2
is >38%. A consequence of this is the
generation of internal stresses, which cause cracks to form,
when the corrosion layer reaches a critical thickness. This
process occurs within the corrosion layer and at the corro-
sion layer/PAM interface. Non-uniform heating of the cor-
rosion layer is another cause for the formation of cracks.
Crack formation is undesirable as it reduces the strength and
conductivity of the material. However, elastically compliant
elements present within the corrosion layer and PAM offset
this effect; these are commonly referred to as gel zones and
allow stresses to be relieved and help in reducing the
incidence of cracking [2,3]. The formation of gel zones is
dependent on the state of hydration of the corrosion layer,
which is influenced by the alloying elements present within
the grid.
Lappe [4] investigated the relationship between electronic
conductivity and stoichiometric coefficient of the lead oxi-
des. He demonstrated that when the stoichiometric coeffi-
cient of an oxide reaches a value of 1.35 there is a rapid
increase in conductivity and at 1.5, the conductivity is nearly
equal to that of PbO
2
. Lead oxides containing very small
Journal of Power Sources 111 (2002) 23–38
*
Corresponding author. Tel.: þ44-1225-386447;
fax: þ44-1225-386098.
E-mail address: (R.J. Ball).
0378-7753/02/$ – see front matter # 2002 Elsevier Science B.V. All rights reserved.
PII: S 0378-7753(02)00221-5
amounts of oxygen exhibited conductivities around
10
À10
O
À1
cm
À1
, whereas the conductivity of PbO
2
was
10
2
O
À1
cm
À2
.
Growth of a corrosion layer is dependent on the initial
oxidation of the grid to form lead monoxide. The lead
monoxide must then react with more oxygen to form oxides
of higher stoichiometric coefficient. These reactions have
been expressed as chemical equations by Pavlov [1]. The
three basic reactions that must occur in order to convert the
lead grid into lead dioxide are reproduced as:
Pb þ O !
n
1
PbO (1)
PbO þðn À 1ÞO !
n
2
PbO
n
ð1 < n < 2Þ (2)
PbO
n
þð2 À nÞO !
n
3
PbO
2
(3)
The rate of each of the reactions above can be described in
terms of a rate coefficient. Depending on the relative rates
of the reactions, corrosion layers having different stoichio-
metric coefficients will be formed. By considering the
stoichiometric coefficient and conductivity, Pavlov [1] pro-
posed the following general rules:
n
1
> n
2
Low valency
lead oxide
High specific resistivity
corrosion layer
n
1
< n
2
; n
3
High valency
lead oxide
Low specific resistivity
corrosion layer
In addition to these reactions, the self-discharge reaction
between Pb and PbO
2
should also be considered. This rate is
determined by a fourth rate coefficient n
4
.
Pb þ PbO
2
!
n
4
2PbO (4)
The occurrence of this reaction leads to a decrease in the
overall stoichiometric coefficient of the oxide and to an
increase in specific resistivity of the corrosion layer.
The alloying elements present in the grid alloy influence
the structure of the corrosion layer by determining the type
and rate of reactions occurring [5]. A consequence of this is a
variation in stoichiometric coefficient of the oxides and
therefore conductivity of the corrosion layer.
Work conducted by Pavlov [1] and colleagues indicated
that alloying additions within the grid influence the
conductivity of the corrosion layer by either acting as an
electro catalyst or as an inhibitor to the reactions given by
Eqs. (1)–(4) [6,7]. Tin catalyses reactions 2 and 3, and as a
consequence corrosion layers with higher stoichiometric
coefficients are observed.
Passivation of the positive plate is associated with the
formation of lead monoxide. If the thickness of this layer
exceeds a critical value, it acts as a high resistance strata
within the corrosion layer which can insulate the grid
from the active material. The overall effect is to decrease
the voltage at which discharge will occur on the plate.
Passivation occurs via the reaction, Pb þ O ! PbO, where
the electrode system Pb/PbO/PbO
2
is formed. At open
circuit the self-discharge reaction, Pb þ PbO
2
! 2PbO
occurs, also producing the high resistance lead monoxide
layer [8]. The rate at which passivation occurs on the
positive plates can be affected by dopants such as tin present
within the grid alloy and corrosion layer. Tin has the effect of
increasing the conductivity of the PbO layer [7,9].
Depassivation can occur by two processes, the first being
the reduction of PbO to Pb by cathodic valency [9] and the
second by oxidation of PbO by the oxygen generated during
overcharge, which produces a lower resistance oxide with
higher valency [1].
2. Production of test batteries
The batteries examined in this study were all 40 amp h
valve regulated lead/acid batteries. Hundred percent glass
separator paper and a standard cyclic negative active mate-
rial were used in all batteries however, variations were made
to the PAM and grid alloy. Two different grid and three types
of PAM were used in total. A summary of the different
battery types, which were constructed referred to as A–E, is
given in Table 1.
The grey oxide (cyclic) PAM used in the manufacture of
the type A battery was formed from a positive paste mix
consisting of 90% grey oxide (a-PbO, %29% lead), 10% red
lead, sulphuric acid and distilled water. Battery types B and
C consisted of PAM formed from a grey oxide & tetrabasic
lead sulphate positive paste produced from a mixture of grey
oxide, tetrabasic lead sulphate, sulphuric acid and distilled
water. A sulphated grey oxide paste was used in the produc-
tion of positive electrodes for battery types D and E. This
consisted of grey oxide, extra sulphuric acid compared to the
other pastes and distilled water.
The battery grid production route can be described in two
stages, the first of these being production of lead strip of
suitable thickness, and the second, punching of the strip to
form the grid. Two different grid types were used in the
construction of the test batteries. The initial stage in grid
production involves the manufacture of a lead strip. Hence,
lead grid was manufactured firstly by casting pure lead into
a strip several centimeters thick. The lead strip was then
rolled repeatedly until the desired thickness was obtained.
Lead/tin grids were manufactured using Comminco casting
Table 1
PAM and grid types used in the test batteries
Battery type PAM Positive grid
A Grey oxide (cyclic) Pure lead
B Grey oxide and tetrabasic lead sulphate Pure lead
C Grey oxide and tetrabasic lead sulphate Lead/tin
D Sulphated grey oxide Pure lead
E Sulphated grey oxide Lead/tin
24 R.J. Ball et al. / Journal of Power Sources 111 (2002) 23–38
machines. This process has the ability to cast the grid to the
required thickness without the need for subsequent rolling.
Once the lead strip was obtained, holes for the active
material, having dimensions 4 mm  13 mm were intro-
duced using a punching machine, converting the strip into
a grid. Pressing the paste into the lead current collecting grid
produced battery electrodes. A glass paper was applied to
each side of the paste impregnated lead grid, to ease hand-
ling, prior to the cutting our of individual electrodes. Elec-
trodes were subjected to a curing stage before cell assembly.
Compositional analysis of cured electrodes using X-ray
diffraction and wet chemical analysis indicated that groups
A, D and E consisted almost entirely of a-lead monoxide
except for a small amount, $5%, of unreacted metallic lead.
Groups B and C contained approximately 30% tetrabasic
lead sulphate and 4% metallic lead, the remainder consisting
of a-lead monoxide. After battery assembly the positive
plates were converted to lead dioxide during the formation
stage of manufacture. X-ray diffraction analysis of the PAM
indicated an a:b lead dioxide ratio of approximately
50% Æ 10%, with a small proportion, 10%, lead sulphate
present in some plates.
3. Cycling of test batteries
Cycling was carried out automatically using Digitron
charging units. Each cycle consisted of a constant current
discharge at 7.05 A to 10.2 V followed by a constant voltage
recharge at 14.7 V for 16 h. This was repeated until the
capacity after charging was <80% of the initial starting
capacity. The cells that showed the greatest and least reduc-
tion in voltage during a final discharge/charge cycle were
examined; these are referred to as the ‘bad’ and ‘good’ cells
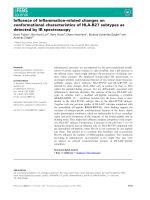
respectively. An example of the voltage in each of the six
cells of a battery during the last discharge charge cycle is
shown in Fig. 1.
4. Sample preparation
4.1. Materialography
Cross-sections of the corrosion layers from each of the
battery types examined in this study were prepared using
standard techniques. After initial encapsulation in resin
battery electrodes were sectioned and remounted for polish-
ing. Silicon carbide paper was used to grind and flatten the
samples, followed by polishing with an alumina suspension
and finally by vibratory polishing. A more detailed descrip-
tion of the preparation method is given in an earlier paper
[10].
4.2. Grid/corrosion layer interfacial analysis
Although mechanical polishing of cross-sections was
successful for obtaining images of corrosion layers several
tens of microns thick, using this method it proved impossible
to obtain an image of sufficient quality of the grid/corrosion
layer interface. This was attributed to the difference in
properties between the soft lead grid bar and the hard lead
oxide ceramic corrosion layer, which wore down at different
rates under the same polishing media. Ultra-microtoming,
however, when used was a successful method of sample
preparation.
Ultra-microtoming, although employed mainly for bio-
logical samples, can be used for the preparation of metals
and ceramics. For the purpose of obtaining a good quality
grid/corrosion layer cross-sectional sample, the microtome
needs only to be used as a tool to obtain a flat surface that can
then be examined by scanning electron microscopy.
Samples were produced by cutting sections of grid bar out
of a positive electrode and then breaking away the PAM. Due
to the relative strengths of the grid/corrosion layer bond and
corrosion layer/active material bond, the corrosion layer
stayed attached to the grid in the majority of instances.
Fig. 1. Plot of voltage vs. time for cells in battery type C.
R.J. Ball et al. / Journal of Power Sources 111 (2002) 23–38 25
Once a section of grid bar was obtained with a uniform layer
of corrosion and a minimum amount of PAM attached, it was
cast in resin using specially designed latex moulds for the
ultra-microtome. Soaking for 4 h prior to curing ensured a
good resin to sample contact. Curing was achieved by
heating in an oven at 60 8C for a period of at least 24 h.
Once cured, the sample was trimmed to a suitable size and
dimensions for ultra-microtoming. Initially sections were
removed from the surface using a glass knife prior to
removal of sections using a diamond knife in order to obtain
as clean a cut as possible for examination. A thin layer of
gold was deposited onto the surface of the finished section to
prevent charging of the resin in the SEM. This was done
using an Edwards sputter coating unit.
5. Experimental methods
5.1. Microscopy and corrosion layer thickness
measurement
The polished cross-sections of corrosion layers from each
battery type were examined and photographed using a Zeiss
ICM405 optical microscope. Microtomed sections were
examined in a Jeol 6310 scanning electron microscope.
Corrosion layer thickness measurements were determined
using Optimas image analysis software [11]. Images were
obtained using a digital camera and then measurements
taken on the top, bottom, left and right hand sides of five
grid bars from each battery, thus producing 20 readings in
total. The mean of these readings was then quoted as the
corrosion layer thickness.
5.2. Electron probe microanalysis
A Jeol JXA-8600 superprobe was used to determine the
composition of the corrosion layers in each of the samples
tested. Readings were taken in a line across the corrosion layer
thickness at 1 mm intervals. An initial qualitative analysis
indicated that the corrosion layer consisted of lead, oxygen,
sulphur and tin. Details of the expected oxidation states of
these elements and the standards used are given in Table 2.
To prevent charging effects the samples were coated with
a thin layer of carbon, using an Edwards sputter coating unit.
All samples and standards were coated simultaneously to
reduce errors caused by adsorption of X-rays by the layer.
Taking into account the peak size, shape and position, the
diffraction crystals employed and counting times used are
shown in Table 3.
6. Results
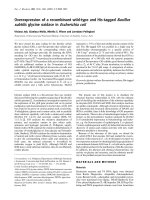
6.1. Optical examination of corrosion layer
Examination using an optical microscope of the corrosion
layers for each battery type indicated variations in structure
and morphology. A typical corrosion layer, from a type A
battery is shown in Fig. 2. The lead grid is out of focus in the
photograph, however this is an unavoidable consequence of
the preparation method used. Cracking can be seen parallel
to the grid surface running along the ‘grid side’ of the
corrosion layer. No porosity is visible within the corrosion
layer and an internal boundary within the corrosion layer is
visible in the central region.
Table 2
Standards used for electron probe microanalysis
Element Possible ‘states’ of
element in sample
Standard selected and source Notes
Lead, Pb Pb, PbO
n
(1 < n < 2) Lead monoxide, PbO Lead is present in the form of lead or lead oxide, this standard gives a
good match in composition and structure
Oxygen, O PbO
n
(1 < n < 2) Lead monoxide, PbO The standard is almost identical in composition to the sample,
therefore this is a very good match
Tin, Sn Sn, SnO
n
(1 < n < 2) Pure tin, Sn (C.M. Taylor Corp., 12921-5) This is again a suitable standard to use
Sulphur, S R-SO
4
Iron Sulphide (pyrite), FeS
2
(C.M. Taylor Corp., 11540-1)
The sulphate and sulphide are likely to have varying characteristics
Errors may therefore be slightly larger than with the previous elements
Table 3
EPMA settings for quantitative analysis
Element Line X-tal Peak position (mm) Peak background (mm) Counting time (s)
Lower Upper Peak Background
Lead, Pb Ma
1
PET
a
169.090 4.000 4.000 30.0 5.0
Oxygen, O Ka
1
LDE
b
109.440 8.800 8.800 30.0 5.0
Tin, Sn La
1
PET
a
115.125 4.000 4.000 10.0 5.0
Sulphur, S Ka
1
PET
a
172.010 0.800 0.800 10.0 5.0
a
Pentaerythritol.
b
Tungsten/silicon multilayer.
26 R.J. Ball et al. / Journal of Power Sources 111 (2002) 23–38
Fig. 2. Corrosion layer from type A battery (scale bar 50 microns).
Fig. 3. Corrosion layer from type B battery (scale bar 50 microns).
Fig. 4. Corrosion layer from type C battery (scale bar 50 microns).
R.J. Ball et al. / Journal of Power Sources 111 (2002) 23–38 27
The corrosion layer observed on the type B battery grid,
Fig. 3, is very similar in appearance to the previous one
except that the internal boundary within the layer is closer to
the PAM and lighter in colour. Fig. 4 shows the corrosion
layer from the type C battery. No internal boundary is
identifiable in this layer and a number of black spots are
visible which are believed to be pores.
The type D positive electrode has a greater volume
fraction of porosity, consisting of large numbers of cracks
in the corrosion layer and PAM (Fig. 5). Large pores are also
visible in the PAM adjacent to the corrosion layer. Fig. 6
shows a typical corrosion layer from a type E battery. Fine
porosity is visible across the width of the layer and a number
of larger pores are also present. A lighter band in the
corrosion layer is visible adjacent to the PAM.
Corrosion layer thickness measurements taken on the
good and bad cells of the batteries examined and the number
of cycles at which these values were taken are shown in
Table 4. There is no significant difference between the
corrosion layer thickness measurements for the good and
bad cells. The thickest layers occurred on batteries of type D
and E (ignoring type B due to higher cycles). These layers
contained more pores and therefore would have allowed
oxygen gas to readily diffuse to the grid/corrosion layer
interface. When a comparison is made between type D and E
batteries, type E that contained the lead/tin grid has a thicker
layer. This suggests that tin promotes an increase in corro-
sion layer thickness. However, the same conclusion cannot
Fig. 5. Corrosion layer from type D battery (scale bar 50 microns).
Fig. 6. Corrosion layer from type E battery (scale bar 50 microns).
Table 4
Oxide thickness measurements
Battery type Cycles Good cell (mm) Bad cell (mm)
Average S.D. Average S.D.
A
a
28 and 42 23.5 6.6 19.8 3.1
B 40 47.7 12.7 40.0 11.0
C 29 28.1 5.3 25.5 5.8
D 29 47.5 8.8 50.8 5.9
E 27 89.4 12.6 88.1 14.4
a
Data averaged for batteries cycled 28 and 42 times.
28 R.J. Ball et al. / Journal of Power Sources 111 (2002) 23–38
be drawn from the batteries from type B and C, since the type
B battery sustained significantly more cycles. The thinnest
corrosion layer occurred on the positive grid of battery type A.
6.2. Structural and compositional analysis of
corrosion layer using EPMA
A compositional analysis of the corrosion layer was
carried out using electron probe microanalysis. This
involved obtaining electron images of the corrosion layers,
which proved useful in providing additional information on
layer porosity.
The main results of interest are quantitative, however,
the qualitative results will be considered first. Lead, oxygen
and sulphur were identified in all corrosion layers with
the addition of tin in the case of those attached to a grid
bar originally alloyed with tin. This indicates that tin
contained initially within the grid becomes incorporated
into the corrosion layer during growth. The fact that no
other elements were identified, with the exception of
carbon, which was used as a conductive coating, demons-
trates that the materials used to manufacture the battery
were pure and did not contain detectable amounts of any
other element.
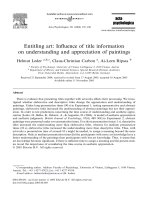
Fig. 7. Analysis of corrosion layer from battery type A.
R.J. Ball et al. / Journal of Power Sources 111 (2002) 23–38 29
Initial spot quantitative analyses on the corrosion layers
examined, showed a large variation in compositional values,
obtained due to the presence of porosity and surface rough-
ness. The surface roughness is clearly visible in the scanning
electron images and porosity in the back-scattered electron
images, Figs. 7–11. This can be explained by considering the
interactions of the incident electrons with the sample and the
method used to calculate the quantity of each element
present.
Calibration of the electron probe microanalyser was
achieved with the use of known standards. However, with
this approach the accuracy of the analysis is dependent
on the unknown sample and standards having similar
densities. Porosity within the corrosion layers can effec-
tively reduce their physical density and introduces errors
into the results.
When X-rays from the sample are counted the analysis
software automatically assumes that the sample is 100%
dense, if a pore is present, the number of X-rays emitted is
reduced and the calculation of the composition altered. This
is demonstrated by the typical analysis given in Table 5.
The accuracy of an elemental analysis can be determined
by considering the total weight percent; the closer it is to
100%, the more accurate the analysis. For the purposes of
Fig. 8. Analysis of corrosion layer from battery type B.
30 R.J. Ball et al. / Journal of Power Sources 111 (2002) 23–38
this study all the analyses with a combined weight percent of
<90% were ignored as it was considered this indicated that
the region of sample excited by the electron beam contained
an unacceptable level of porosity or surface roughness.
In order to obtain an accurate value for the oxide stoi-
chiometry, a large number of quantitative analyses were
conducted. As variations in oxide stoichiometry between the
inner and outer edges of the corrosion layer are of interest, a
quantitative line scan between these two positions was the
most appropriate option.
Analyses were conducted at 1 mm intervals along the scan
line. This provided the maximum number of practical
analysis points considering that the minimum area that
can be analyzed is approximately 1 mm in diameter. The
maximum number of analysis points was used, since for the
more porous samples a large number of the analyses were
rejected because the total weight percent was <90%. To
calculate the stoichiometry of the oxide in the corrosion
Fig. 9. Analysis of corrosion layer from battery type C.
Table 5
Typical EPMA compositional analysis
Atom Percentage
Pb 43.4
O56
S 0.6
Sn 0.1
Total wt.% 96.1
R.J. Ball et al. / Journal of Power Sources 111 (2002) 23–38 31
layer it is necessary to make a number of assumptions for
each analysis. These are summarised as follows:
The only elements present in the corrosion layer are lead,
oxygen, tin and sulphur.
All sulphur present within the corrosion layer is in the
form of a metal sulphate.
Lead and tin within the corrosion layer are either in the
form of an oxide or sulphate.
Oxide stoichiometry for a given analysis point is always
the same regardless of metal e.g. lead or tin.
From these assumptions a number of expressions, shown
later, were derived to obtain values for the total metal
and oxygen atoms available for incorporation into
oxide, thus allowing the stoichiometry of the oxide to be
calculated.
Total metal atoms forming oxide; T
M
¼ P þ T À S
(5)
Total oxygen atoms forming oxide; T
O
¼ O Àð4 Â SÞ
(6)
Oxide stoichiometry ratio; MO
n
; n ¼
T
O
T
M
(7)
Where P is the number of lead atoms identified in analysis, T
the number of tin atoms identified in analysis, S the number
Fig. 10. Analysis of corrosion layer from battery type D.
32 R.J. Ball et al. / Journal of Power Sources 111 (2002) 23–38
of sulphur atoms identified in analysis and O the number of
oxygen atoms identified in analysis.
Secondary and back-scattered electron images and plots of
oxygen/lead ratio versus distance across corrosion layer for
each of the battery types examined are shown in Figs. 7–11.
The electron scanning process resulted in a layer of
contamination being deposited on the corrosion layer sur-
face. This provided a means to identify the exact position of
the scan line. For all plots the scan direction taken was from
the active material towards the grid bar. Variations in oxy-
gen/lead ratio occur with distance across the corrosion layer
and also between the different battery designs. There is a
general trend showing a decrease in oxygen content towards
the grid bar. When comparing the scan lines and plots, step
variations in oxygen/lead ratio do not always correspond to
the spatial position of internal boundaries within the corro-
sion layer.
Scatter in some of the data plots is believed to be caused
by errors introduced by variations in surface roughness and
porosity. Despite these factors it has still proved possible to
identify general compositional trends within the corrosion
layer of each battery design.
Internal boundaries within the corrosion layers can be
identified in both back-scattered and secondary electron
Fig. 11. Analysis of corrosion layer from battery type E.
R.J. Ball et al. / Journal of Power Sources 111 (2002) 23–38 33
images by darker and lighter regions of contrast. The darker
regions correspond to lower atomic mass areas and the light
regions to high. Variations in intensity and contrast are a
consequence of the back-scattered electron intensity depen-
dence on atomic number. This can be used to explain the
light shade of the grid bar, which has a high average atomic
mass and is therefore efficient at back-scattering electrons.
From an examination of the images it can be seen that the
lighter band within the corrosion layer is positioned adjacent
to the PAM and the darker band to the grid bar. This
observation suggests an increased lead content in the corro-
sion layer adjacent to the PAM. This cannot be explained
when it is presumed that the oxygen concentration is con-
sidered to be higher in these regions, suggesting the materi-
als may have different work functions, thereby producing a
variation in contrast between the different regions.
6.3. Analysis of the corrosion layer/grid interface
Preparation of corrosion layers using grinding and polish-
ing techniques produced a high quality surface finish suitable
for electron microscopy and, wave and energy dispersive
analysis. However, the differences of material removal rate
between the soft lead grid and hard ceramic corrosion layer
make examination of this interface almost impossible due to
the ledge formed at the interface. For this reason, the alter-
native technique of ultra-microtoming was used. This not
only provided a flat section, but the disruption to the interface
was negligible making detailed microscopy feasible.
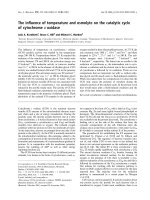
Samples were prepared from the freshly formed positive
electrodes of battery types B–E. Secondary electron images
of the sections taken are shown in Figs. 12–15, respectively.
From the figures it can be seen that this technique provides
Fig. 12. Grid corrosion layer interface from type B battery.
Fig. 13. Grid corrosion layer interface from type C battery.
34 R.J. Ball et al. / Journal of Power Sources 111 (2002) 23–38
Fig. 14. Grid corrosion layer interface from type D battery.
Fig. 15. Grid corrosion layer interface from type E battery.
Fig. 16. Corrosion propagating along grain boundary.
high definition pictures of both corrosion layer and interface
morphology.
A significant feature observed in the photographs is the
presence of ‘fingers’ of oxide growing into the lead/tin grids,
but not into the pure lead. Corrosion layers produced from
lead grids have a smooth grid/corrosion layer interface,
however those growing from lead tin grids do not.
A more detailed examination of a lead/tin grid corrosion
layer identified what was believed to be corrosion initiating
in the region of a grain boundary, Fig. 16. Close examination
of the grain boundary showed a small step to be present.
A likely explanation is that the shearing action of the
microtome’s knife as it cuts a section from the alloy surface
produces a force at the grain boundaries sufficient to
cause a displacement, and the resulting step. The ‘step’
was confirmed to be grain boundary by etching a section
and comparing the location of the step with that of the
grain boundary, revealed by the etched micrographs, Figs. 17
and 18.
Electron probe microanalysis was used to obtain values of
the tin content within the grain and at the grain boundaries
by taking numerous (17) randomly distributed analysis
points at each position. The average percentage tin values
obtained from the data for the grain and grain boundary
regions were 0.75 and 0.96%, respectively. A statistical
analysis using the Student’s t-test indicated that there was
a 0.2% or less probability of the two sample means obtained
not being significantly different.
The higher tin concentration observed at the grain boun-
dary is due to the precipitation of tin in these regions during
Fig. 17. Microtomed grid indicating position of grain boundary.
Fig. 18. Etched grid indicating position of grain boundary.
36 R.J. Ball et al. / Journal of Power Sources 111 (2002) 23–38
solidification of the alloy. This can be expressed by the
following phase reaction obtained from the appropriate
position on the lead tin phase diagram shown in Fig. 19.
L ! L þ a ! a ! a þ b (8)
As the molten alloy, L, cools during the casting procedure
the a-phase, lead, solidifies. At very low temperatures,
<50 8C the a þ b region of the diagram is encountered
and the b phase, tin, precipitates at the grain boundaries.
Corrosion is more likely to occur in the vicinity of the tin
precipitates, as the higher concentration of tin will cause
enhanced galvanic corrosion, due to the different electrode
potentials of lead and tin. Thus, the electrochemical couple
provides an ideal nucleus for the corrosion process.
7. Conclusions
The results indicate that corrosion layer thickness, struc-
ture and composition are influenced by PAM type and grid
alloy. Corrosion layer thickness is related to the number of
cycles. However, PAM and grid type appear to be the more
influential factors.
Porosity in the corrosion layer was greater in electrodes
with sulphated active materials. These layers were also
significantly thicker than their non sulphated equivalent
and it is believed that this is a result of an increased amount
of oxygen reaching the grid/corrosion layer interface
through the network of pores and cracks.
Optical and electron microscopy of corrosion layer cross-
sections revealed bands identified by different colours/
shades. However, the bands did not correspond to discrete
variations in oxide stoichiometry detected by electron probe
microanalysis.
Battery types A and B, which achieved higher numbers of
cycles to failure compared to types C–E, have on average a
higher concentration of oxygen across the width of their
corrosion layer. This indicates an increase in electronic
conductivity and more efficient conduction across the corro-
sion layer.
Ultra-microtoming has been shown to be an effective
method for preparation of grid/corrosion layer interfaces
suitable for examination using electron optical techniques.
Results showed that corrosion growth propagates along tin
rich grain boundaries.
Acknowledgements
The authors would like to thank Hawker Energy Products
Ltd., Newport for supplying and cycling the test batteries.
Thanks are extended to Mark Deven and Buehler/Krautkra-
mer, Coventry, for their invaluable assistance with the
materialographic preparation of samples. EPSRC support
is acknowledged.
References
[1] D. Pavlov, A theory of the grid/positive active mass (PAM) interface
and possible methods to improve PAM utilization and cycle life of
lead/acid batteries, J. Power Sources 53 (1995) 9–21.
[2] D. Pavlov, The lead/acid battery lead dioxide active mass: a gel-
crystal system with proton and electron conductivity, J. Electrochem.
Soc. 139 (11) (1992) 3075–3080.
Fig. 19. Lead/tin phase diagram (a ¼ lead, b ¼ tin).
R.J. Ball et al. / Journal of Power Sources 111 (2002) 23–38 37
[3] G.J. May, Operational experience with valve regulated lead/acid
batteries, J. Power Sources 53 (1995) 111–117.
[4] F. Lappe, Some physical properties of sputtered PbO
2
films, J. Phys.
Chem. Solids 23 (1962) 1563–1572.
[5] A.F. Hollenkamp, K.K. Constanti, M.J. Koop, L. Apateanu, M.
Calabek, K. Micka, Effects of grid alloy on the properties of positive-
plate corrosion layers in lead/acid batteries. Implications for
premature capacity loss under repetitive deep-discharge cycling
service, J. Power Sources 48 (1994) 195–215.
[6] B. Monahov, D. Pavlov, Influence of antimony on the structure and
the degree of hydration of the anodic PbO
2
layer formed an Pb–Sb
electrodes, J. Electrochem. Soc. 141 (9) (1994) 2316–2326.
[7] D. Paolov, B. Monahov, Mechanism of action of Sn on the
passivation phenomena in the lead/acid battery positive plate (Sn
free effect), J. Electrochem. Soc. 136 (1989) 27–34.
[8] J. Garche, N. Anastasijevic, K. Wiesener, Electrochimica. Acta 26
(10) (1981) 1363–1373.
[9] R.F. Nelson, D.M. Wilson, J. Power Sources 33 (1991) 165–
185.
[10] R.J. Ball, R. Evans, M. Deven, R. Stevens, Characterisation of
defects observed within the positive grid corrosion layer of the
valve regulated lead/acid battery, J. Power Sources 103 (2002)
207–212.
[11] Optimas 6.1, Optimas UK Ltd., West Maling, Kent, UK.
38 R.J. Ball et al. / Journal of Power Sources 111 (2002) 23–38