Getting Started with Open Office .org 3 part 21 ppt
Bạn đang xem bản rút gọn của tài liệu. Xem và tải ngay bản đầy đủ của tài liệu tại đây (4.76 MB, 10 trang )
Alternatively, select Insert > Spreadsheet from the main menu bar.
This opens a small spreadsheet in the middle of the slide. When a
spreadsheet is inserted using this method, it is already in edit mode. It
is also possible to insert a spreadsheet as an OLE object.
To add a chart to a slide, select the corresponding layout in the list of
predefined layouts in the task pane or use the Insert Chart feature.
Impress offers the capability of inserting in a slide various other types
of objects such as music or video clips, Writer documents, Math
formulas, generic OLE objects and so on. A typical presentation may
contain movie clips, sound clips, OLE objects and formulas; other
objects are less frequently used since they do not appear during a slide
show.
For details on using spreadsheets, charts, and other objects in Impress,
refer to Chapter 7 of the
Impress Guide
.
Setting up the slide show
Impress gives you the tools to organize and display a slide show,
including:
• Which slides to show and in what order
• Whether to run the show automatically or manually
• Transitions between slides
• Animations on individual slides
• Interactions: what happens when you click a button or link
Chapter 9 of the Impress Guide describes these tools.
Most tasks associated with putting together a show from your slides
are best done in Slide Sorter view. Choose View > Slide Sorter from
the menu bar or click the Slide Sorter tab at the top of the workspace.
All of your slides appear in the workspace; you may need to scroll to
see them all.
Custom animations are found on the Tasks pane. This is an advanced
technique and is explained in Chapter 9 (Slide Shows) in the
Impress
Guide
.
Your first slide show should probably have the same slide transition for
all slides. Setting
Advance slide
to On mouse click is the default and
a simple setting. If you want each slide to be shown for a specific
amount of time, click Automatically after and enter the number of
seconds. Click Apply to all slides.
Chapter 6 Getting Started with Impress 201
Slide transition choices are also found on the Tasks pane. For more
information about slide transitions, see Chapter 9 in the
Impress
Guide
.
Tip
The Slide transition section has a very useful choice:
Automatic preview
. Select its checkbox. Then when you make
any changes in a slide transition, the new slide is previewed in
the Slide Design area, including its transition effect.
Running the slide show
To run the slide show, do one of the following:
• Click Slide Show > Slide Show.
• Click the Slide Show button on the Presentation toolbar.
Figure 147: Presentation Toolbar
• Press
F5
or
F9
.
If the slide transition is
Automatic after x seconds
, let the slide show
run by itself.
If the slide transition is
On mouse click
, do one of the following to
move from one slide to the next:
• Use the arrow keys on the keyboard to go to the next slide or to
go back to the previous one.
• Click the mouse to move to the next slide.
• Press the spacebar on the keyboard to advance to the next slide.
Right-click anywhere on the screen to open a menu from which you can
navigate the slides and set other options.
To exit the slide show at any time including at the end, press the
Esc
key.
202 Getting Started with OpenOffice.org 3
Chapter 7
Getting Started with Draw
Vector drawing in OpenOffice.org
What is Draw?
Draw is a vector graphics drawing program. It offers a series of
powerful tools that enable you to quickly create all sorts of graphics.
Vector graphics store and display an image as vectors (two points and
a line) rather than a collections of pixels (dots on the screen). Vector
graphics allow for easier storage and scaling of the image.
Draw is perfectly integrated into the OpenOffice.org suite, and this
makes exchanging graphics with all components of the suite very easy.
For example, if you create an image in Draw, reusing it in a Writer
document is as simple as copying and pasting. You can also work with
drawings directly from within Writer and Impress, using a subset of the
functions and tools from Draw.
Draw’s functionality is very extensive and complete. Although it was
not designed to rival high-end graphics applications, Draw possesses
more functions than the majority of drawing tools that are integrated
into office productivity suites.
A few examples of drawing functions might whet your appetite: layer
management, magnetic grid point system, dimensions and
measurement display, connectors for making organization charts, 3D
functions enabling small three-dimensional drawings to be created
(with texture and lighting effects), drawing and page style integration,
and Bézier curves, to name a few.
This chapter introduces some of Draw’s features, but it does not
attempt to cover all of the them. See the
Draw Guide
and the
application Help for more information.
The Draw workspace
The main components of the Draw workspace are shown in Figure 148.
You can surround the drawing area with toolbars and information
areas. The number and position of the visible tools vary with the task
at hand or user preferences. Therefore, your setup may appear a little
different. For example, many people put the main Drawing toolbar on
the left-hand side of the workspace, not at the bottom as shown here.
You can split drawings in Draw over several pages. Multipage drawings
are used mainly for presentations. The
Pages
pane, on the left side of
the Draw window in Figure 148 gives an overview of the pages that
you create. If the Pages pane is not visible on your setup,you can
enable it from the View menu (View > Page Pane).
204 Getting Started with OpenOffice.org 3
Figure 148. Initial Draw window
Rulers
You should see rulers (bars with
numbers) on the upper and left-hand
side of the workspace. These show
the size of a selected object on the
page (see the gray double lines,
highlighted in Figure 149). When no
object is selected, they show the
location of the mouse pointer, which
helps to accurately position drawing
objects. You can also use the rulers to
manage object handles and guide lines, making it easier to position
objects. The page margins in the drawing area are also represented on
the rulers. You can change the margins directly on the rulers by
dragging them with the mouse.
Chapter 7 Getting Started with Draw 205
Figure 149: Rulers show the
size of the selected object
To modify the units of measurement of
the rulers, right-click on one of the
rulers. The two rulers can have different
units.
Status bar
The Status bar is located at the bottom of the workspace. The middle
part of the Status bar shows Draw-specific fields, as identified in
Figure 151.
For details on the contents and use of these fields, please refer to the
Draw Guide
.
Note
The sizes are given in the current measurement unit (not to be
confused with the ruler units). This unit is defined in Tools >
Options > OpenOffice.org Draw > General, where you can
also change the scale of the page. Another way to change the
scale is to double-click on the number shown in the status bar.
Figure 151: Items on the Draw status bar
Toolbars
The various Draw toolbars can be displayed or hidden according to
your needs.
To display or hide the toolbars, click View > Toolbars. On the menu
that appears, choose which toolbars you want to display.
206 Getting Started with OpenOffice.org 3
Figure 150. Ruler units
You can also select the buttons that you wish to appear on the
corresponding toolbar. On the View > Toolbars menu, select
Customize, click on the Toolbars tab, select the toolbar you want to
change, and then select the desired buttons for that toolbar.
Many toolbar buttons are marked with a small arrow beside the button.
The arrow indicates that this button has additional functions. Click the
arrow and a submenu or toolbar appears, showing its additional
functions (see Figure 152). Most buttons marked with the small arrow
can become
floating toolbars
.
To make a submenu into a floating toolbar, click the area at the top of
the submenu, drag it across the screen, and then release the mouse
button. Floating toolbars can be docked on an edge of the screen or
within one of the existing toolbar areas at the top of the screen, as
described in Chapter 1.
Figure 152. An arrow next to a button
indicates additional functions
Click the arrow on the title bar of a floating toolbar to display
additional functions (see Figure 153).
Figure 153. An arrow on a floating toolbar indicates
additional functions
Chapter 7 Getting Started with Draw 207
The tools available in the various toolbars are explained in the
following sections. The appearance of the toolbar icons may vary with
your operating system and the selection of icon size and style in Tools
> Options > OpenOffice.org > View.
Standard toolbar
The Standard toolbar looks like this:
It is the same for all parts of OpenOffice.org.
Line and Filling toolbar
The Line and Filling toolbar lets you modify the main properties of a
drawing object. See page 227 for details.
If the selected object is text, the toolbar changes to the one shown
below, which is similar to the Formatting toolbar in Writer.
Drawing toolbar
The Drawing toolbar is the most important toolbar in Draw. It contains
all the necessary functions for drawing various geometric and freehand
shapes and organizing them on the page.
Color Bar
To display the Color Bar, use View > Toolbars > Color Bar. The
toolbar then appears at the bottom of the workspace.
This toolbar lets you rapidly choose the color of the objects in your
drawing. The first box in the panel corresponds to transparency (no
color).
You can access several specialized color palettes in Draw, as well as
change individual colors to your own taste. This is done using the Area
dialog, reached by choosing Format > Area or the
pouring can
icon on
the Line and Filling toolbar.
On the Area dialog, choose the tab marked Colors.
208 Getting Started with OpenOffice.org 3
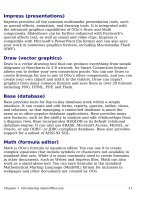
Figure 154. Changing the color palette
To load another palette, click on the Load Color List button (circled).
The file selector dialog asks you to choose one of the standard OOo
palettes (files bearing the file extension *.soc). For example, web.soc
is a color palette that is adapted to creating drawings that are going to
appear in Web pages. The colors will correctly display on workstations
with screens displaying at least 256 colors.
The color selection box also lets you individually change any color by
modifying the numerical values in the fields provided to the right of the
color palette. You can use the color schemes known as CMYK (Cyan,
Magenta, Yellow, Black), RGB (Red, Green, Blue) or HSB (Hue,
Saturation, Brightness).
Clicking on the Edit button opens a special dialog to allow setting
individual colors (see Figure 155). Many more input possibilities are
available in this dialog.
In the lower area you can enter values in the RGB and CMYK models
as well as the HSB (Hue, Saturation and Brightness) model.
The two color fields at lower right show the value of the color as
selected (left) and the currently set value from the color value fields
(right).
For a more detailed description of color palettes and their options, see
Chapter 8 (Tips and Tricks) in the
Draw Guide
.
Chapter 7 Getting Started with Draw 209
Figure 155. Defining color schemes
Options toolbar
The Options toolbar lets you activate or deactivate various drawing
aids. The Options toolbar is not displayed by default. To display it,
select View > Toolbars > Options. The most important options to
learn when starting to work in Draw are enclosed in red. The functions
of the various icons are described in Table 2.
Figure 156: Options toolbar
Table 2: Functions on the Options toolbar
Icon Function
Rotation mode after clicking object
Display (or hide) the grid
Display (or hide) the guides
Display (or hide) guides when moving
Snap to grid
Snap to guides
Snap to page margins
210 Getting Started with OpenOffice.org 3
Color
schemes