SAS Data Integration Studio 3.3- P32 doc
Bạn đang xem bản rút gọn của tài liệu. Xem và tải ngay bản đầy đủ của tài liệu tại đây (532.41 KB, 5 trang )
150 Example: Creating a Job That Joins Two Tables and Generates a Report Chapter 10
Example: Creating a Job That Joins Two Tables and Generates a Report
Preparation
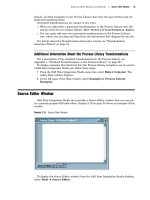
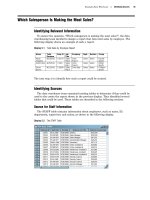
Suppose that you wanted to create a report that shows which sales person is making
the most sales, as described in “Which Salesperson Is Making the Most Sales?” on page
45. You decide to extract columns from several existing tables, write that information to
a new table, and run a report on the new table. An example of this report is shown in
the following display.
Display 10.1 Total Sales by Employee Report
One way to create this report is to create a SAS Data Integration Studio job that
joins the required tables and writes the output of the join to a new table. The new table
would be the input to a report transformation. This example demonstrates one way to
create such a process flow.
In the example, columns from source tables (ORGANIZATION_DIM and
ORDER_FACT) are extracted and mapped to columns in the main target table
(Total_Sales_By_Employee). The main target table, in turn, is the input to a report
transformation (Publish to Archive) that creates the desired report.
Assume the following about the example job:
Metadata for both source tables in the job (ORGANIZATION_DIM and
ORDER_FACT) is available in a current metadata repository. “Identifying Targets”
on page 48 describes how these tables were created by combining information from
other tables.
The ORGANIZATION_DIM and ORDER_FACT tables have the same key column:
Employee_ID. In the current example, these tables will be joined on the
Employee_ID column.
Metadata for the main target table in the job (Total_Sales_By_Employee) is
available in a current metadata repository. “Example: Using the Target Table
Designer to Register SAS Tables” on page 140 describes how the metadata for this
table could be specified. As described in that section, the
Total_Sales_By_Employee table has only those columns that are required for the
report. The metadata for these columns is shown in Display 9.5 on page 144.
You have selected a default SAS application server for SAS Data Integration
Studio, as described in “Selecting a Default SAS Application Server” on page 96.
This server can access all tables that are used in the job.
The main metadata repository is under change-management control. For the
current example, the metadata for the Total_Sales_By_Employee table must be
checked out because (a) the metadata for this table was created and checked in
earlier, as described in “Example: Using the Target Table Designer to Register
Example Process Flows Create the New Job and Specify the Main Process Flow 151
SAS Tables” on page 140, and (b) the metadata for the table must be updated for
the current job. When you are finished with the current job, metadata for the new
job and the updated metadata for the Total_Sales_By_Employee table will be
checked in. For details about change management, see “Working with Change
Management” on page 113.
It is assumed that you have started SAS Data Integration Studio and have opened
the appropriate metadata profile.
The first task is to check out any existing metadata that must be updated for the
current job.
Check Out Existing Metadata That Must Be Updated
You do not have to check out the metadata for a table in order to add it as a source or
a target in a job. However, the metadata for the Total_Sales_By_Employee table must
be checked out because its metadata must be updated for the current job. The
Total_Retail_Price column in the table must be updated so that it summarizes a total
revenue number from individual sales.
Follow these steps to check out existing metadata:
1 On the SAS Data Integration Studio desktop, select the Inventory tree.
2 In the Inventory tree, open the
Tables folder.
3
Select the table that must be updated for the current job:
Total_Sales_By_Employee.
4 Select Project
Check Out from the menu bar. The metadata for this table will
be checked out and will appear in the Project tree.
The next task is to create and populate the job. In this example, you will populate
the job in two stages. First, you will create and test the process flow that loads the
Total_Sales_By_Employee table. Then you will add the report generation process to the
end of the flow.
Create the New Job and Specify the Main Process Flow
Follow these steps to populate a job that loads the Total_Sales_By_Employee table.
To populate a job means to create a complete process flow diagram, from sources,
through transformations, to targets.
1 From the SAS Data Integration Studio menu bar, select Tools
Process
Designer. The New Job wizard displays.
2
Enter a name and description for the job. Type the name
Total_Sales_By_Employee, press the TAB key, the enter the description
Generates a report that ranks salespeople by total sales revenue
.
3 Click Finish. An empty job will open in the Process Designer window. The job has
now been created and is ready to be populated with two sources, a target, and an
SQL Join transformation.
4
On the SAS Data Integration Studio desktop, click the
Process Library tab to
display the Process Library.
5 In the Process Library, open the Data Transforms folder.
152 Create the New Job and Specify the Main Process Flow Chapter 10
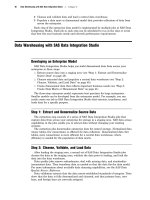
6 Click, hold, and drag the SQL Join
transformation into the empty Process
Designer window. Release the mouse button to display the SQL Join
transformation template in the Process Designer window for the new job. The SQL
Join transformation template displays with drop zones for two sources and one
target, as shown in the following display.
Display 10.2 The New SQL Join Transformation in the New Job
7 On the SAS Data Integration Studio desktop, click the Inventory tab to display
the Inventory tree.
8 In the Inventory tree, open the Tables folder.
9 In the Tables folder, click and drag the ORGANIZATION_DIM table into one of the
two input drop zones in the Process Designer window, then release the mouse
button. The
ORGANIZATION_DIM table appears as a source in the new job.
10 Repeat the preceding step to specify the ORDER_FACT table as the second of the
two sources in the new job.
11 On the desktop, click the Project tab to display the Project tree. You will see the
new job and the Total_Sales_By_Employee table that you checked out.
Example Process Flows (Optional) Reduce the Amount of Data Processed by the Job 153
12 Click and drag Total_Sales_By_Employee
table into the output drop zone in the
Process Designer window. The target replaces the drop zone and a Loader
transformation appears between the target and the SQL Join transformation
template, as shown in the following display.
Display 10.3 Sources and Targets in the Example Job
The job now contains the main flow diagram, from sources, through transformations,
to target. The next task is to update the default metadata for the transformations and
the target.
(Optional) Reduce the Amount of Data Processed by the Job
As you build the process flow for a job, you might want to create and test part of the
flow before adding more processes and tables to the flow. However, repeated executions
of a job can become tedious if you have to work with large amounts of data. One way to
reduce the amount of data processed by a job is to specify the SAS System option OBS=
on the
Pre and Post Process tab in the properties window for the job.
Follow these steps to specify an OBS= option in the properties window for the job
that was created in the previous section:
1 In the Process Designer window for the job, right-click the canvas and select
Properties from the pop-up menu. The properties window for the job displays.
2 Click the Pre and Post Process tab.
3 Select the Pre Processing check box.
4 In the Type selection box, select Metadata.
154 (Optional) Reduce the Amount of Data Processed by the Job Chapter 10
5 In the Description
field, enter a description of the option that you are about to
set, such as Limit data rows processed by this job. The
Pre and Post Process
tab should resemble the following display.
Display 10.4 Pre and Post Processing Tab
6 Click Edit to display the window where you will specify the OBS= option. Specify
a convenient number of observations (rows of data). For this example, specify
OBS=500. The Edit Source Code window should resemble the following display.