Lecture Notes in Computer Science- P46 pot
Bạn đang xem bản rút gọn của tài liệu. Xem và tải ngay bản đầy đủ của tài liệu tại đây (215.09 KB, 5 trang )
214 S. Han et al.
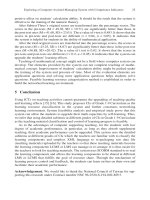
Fig. 11. If-else quiz made with flash
Fig. 12. If-else quiz operation
figure 11. If the student inputs a value into the text-box which is a multiple of three it
draws a red box. If not, it draws a yellow box, as shown in figure 12. If the student
wants to repeat from the beginning, he or she only needs to press the button for the
first stage.
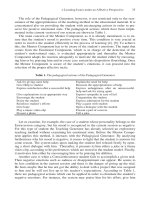
Figure 13 shows a flash quiz in which the student practices how to use an array of
a two dimensional sort variable of character type. If the student inputs a free character
line in the text-box indicated by the finger, a character is stored in a picture of the
memory , below an address value. Students can understand the fact that the charac-
ters are stored in a[0], a[1], a[2], a[3], in sort element variables of character form. In
this case it's expressed in pointer form, it can be shown as *a, *(a+1), *(a+2), *(a+3).
Development of Contents Improving the Effectiveness of Self Learning 215
Fig. 13. Quiz about a sort variable of the character type
Fig. 14. Quiz operation about a sort variable of the character type
Figure 14 shows that this quiz is in progress, and the student has input C++, JAVA,
XML, FORTRAN into the text-box and then presses the result checking button. The
student can verify that each character in the lines were placed into each element a[0],
a[1], a[2], a[3] in a sort variable of the character form.
2.2 Flash Animation Production to Understand Concepts
Assume that an integer number's data occupies two bytes of memory , and consider
positive numbers and negative numbers. The range of numbers which is possible is -
32768-32767. If there is a smaller value than -32768 among the values assigned to
variable, an overflow occurs. An underflow is assigned to smaller numbers than can
be assigned to a variable. An overflow is assigned to larger numbers than can be as-
signed to a variable. In order to make overflow and underflow concepts easier for
students to understand,, we produced a scenario and implemented flash as follows. A
fish is compared to an integer number's data and a nursery is compared to the role of
216 S. Han et al.
Fig. 15. An integer number’s range
Fig. 16. Example of an underflow
Fig. 17. Example of an overflow
data contained in variables The proper fishes only live within a fish tank, but the
smaller fishes will escape from a net, as shown in figure 6. This is an underflow. Very
large fishes will escape by tearing a net, as shown in figure 7. Therefore, figure 7
shows that large fishes can’t be put in a net.
Development of Contents Improving the Effectiveness of Self Learning 217
2.3 Production of a JAVA Applet for the Purpose of Understanding Algorithms
There are educational contents which consist of a sort algorithm and hanoi-top
transfer algorithms, which deal with the C language and are comparatively complex
algorithms[10-11]. We use JAVA to utilize an algorithm learning applet on the web.
Real-time technical animation with JAVA threads is used to aid in understanding an
algorithm[12-15].
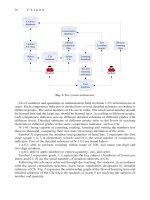
Firstly, figure 18 is the main screen of a sort algorithm learning applet. In this
study, we deal with five sort algorithms, namely, bubble sort, selection sort, insertion
sort, shell sort, and quick sort .
The entire applet consists of the top toolbar, the source code implementing each
sort algorithm as C language, at the left side, and the animation pad, at the right side.
This pad is arranged randomly to sort values. Based on a student's inputted sort factor,
we used it to see how to randomly arrange the numbers from one to the number of the
sort factor . For example, when a student performs a ten sort, the applet shows on
the first screen that numerals from 1 to 10 are randomly arranged.
Fig. 18. Applet of sort learning algorithms
Fig. 19. A numeral pad animation process
218 S. Han et al.
A student selects sort algorithms at the applet tool bar, and inputs the units using a
numeral pad. Then, the student clicks a sort start button, then the sort process
ends.Between sorts, a code section shows that a sort source is now selected, as shown
in figure 18, and creates a numeral pad animation. A source code section shows a red
square, indicating the current line of source code. The light side of a numeral pad
animation shows an image, as shown in figure 19. The sort animation process shown
in the figure first changes the numeral pad into a heavy yellow(a), continuously
moves vertically in space(b), exchanges a pad in (c), finally moves vertically, then the
color of a pad changes into the original color(d).
The animation process, such as that of figure 20, shows how numerals are sorted.
By contrast, the characteristics of sort algorithms can be analyzed through graph an-
imations, such as figure 20. When the student presses the ‘graphic analysis’ button to
see this sort process as a graph, a new frame window is created and the sort process is
shown as an animated graph. Figures 20 shows examples., These are screens which
display a bubble sort process.
Fig. 20. Sort process graphs
The axis X is j and the axis Y is the value a[j]. (a) is the first stage, prior to sorting,
(b) the halfway stage and (c) the final stage. We can see from the graph that the upper
portion sorts quickly and the lower portion is sorting gradually. Thus, the time re-
quired for a bubble sort is very long because of the need to search for the maximum
value and sort it imprecisely.
When the sorting is finished, two components of information appear in the bottom
of the applet, as shown in figure 21. Students check how often values are compared in
order to sort information, and how often values are exchanged. Then, this can be
saved based on their sorts.
Data saved will be used later, with a measure comparing advantages and disadvan-
tage of the sorts. For example, profitable algorithms are selected based on the number
Fig. 21. Comparison of sorts and information window of the exchange times