Microsoft SQL Server 2008 R2 Unleashed- P18 pdf
Bạn đang xem bản rút gọn của tài liệu. Xem và tải ngay bản đầy đủ của tài liệu tại đây (580.02 KB, 10 trang )
ptg
124
The first place you should look when creating a new trace is at the trace templates. These
templates contain predefined trace settings that address some common auditing needs.
They have preset events, data columns, and filters targeted at specific profiling scenarios.
The available trace templates, found in the template drop-down on the General tab of the
Trace Properties window, are listed in Table 6.1.
CHAPTER 6 SQL Server Profiler
TABLE 6.1 SQL Profiler Templates
Template Description
SP_Counts
Tracks all the stored procedures as they star t. No event except for the stored
procedure starting is traced.
Standard
Traces the completion of SQL statements and Remote Procedure Calls (RPCs)
as well as key connection information.
TSQL
Traces the star t of SQL statements and RPCs. This template is useful for
debugging client applications where some of the statements are not complet-
ing successfully.
TSQL_Duration
Traces the total execution time for each completed SQL statement or RPC.
TSQL_Grouped Traces the star t of SQL statements and RPCs, g rou ped by Application,
NTUser, LoginName, and ClientProcessId.
TSQL_Locks
Traces the completion of SQL statements along with the key lock information
that can be used to troubleshoot lock timeouts, deadlocks, and lock escalation
issues.
TSQL_Replay
Captures profiling information that is useful for replay. This template contains
the same type of information as the standard template, but it adds more
detail, including cursor and RPC output details.
TSQL_SPs
Traces stored procedures in detail, including the star t and completion of each
stored procedure. The SQL statements within each procedure are traced as
well.
Tuning
Performs a streamlined trace that tracks only the completion of SQL state-
ments and RPCs. The completion events provide duration details that can be
useful for performance tuning.
Download from www.wowebook.com
ptg
125
Creating Traces
6
Keep in mind that the templates that come with SQL Server 2008 are not actual traces.
They simply provide a foundation for you in creating your own traces. After you select a
template, you can modify the trace setting and customize it for your own needs. You can
then save the modified template as its own template file that will appear in the template
drop-down list for future trace creation.
Trace Name is another property you can modify on the General tab. Trace Name is a rela-
tively unimportant trace property for future traces. When you create a new trace, you can
specify a name for the trace; however, this trace name will not be used again. For instance,
if you have a trace definition you like, you can save the trace definition as a template file.
If you want to run the trace again in the future, you can create a new trace and select the
template file that you saved. You will not be selecting the trace to run based on the trace
name you entered originally. Trace Name is useful only if you are running multiple traces
simultaneously and need to distinguish between them more easily.
TIP
Do yourself a favor and save your favorite trace definitions in your own template. The
default set of templates that come with SQL Server are good, but you will most likely
want to change the position of a column or add an event that you find yourself using all
the time. It is not hard to adjust one of the default templates to your needs each time,
but if you save your own template with exactly what you need, it makes the task all the
more easy. After you save your own template, you can set it as the default template,
and it will be used by default every time you start the Profiler.
The Save to File and Save to Table options on the General tab of the Trace Properties page
allow you to define where the trace output is stored. You can save the output to a flat file
or SQL Server table. These options are discussed in more detail later in the chapter, in the
section “Saving and Exporting Traces.”
The last option on the General tab of the Trace Properties window is the Enable Trace Stop
Time option. This scheduling-oriented feature allows you to specify a date and time at
which you want to stop tracing. This capability is handy if you want to start a trace in the
evening before you go home. You can set the stop time so that the trace will run for a few
hours but won’t affect any nightly processing that might occur later in the evening.
Events
The events and data columns that will be captured by your Profiler trace are defined on
the Events Selection tab. An example of the Events Selection tab is shown in Figure 6.3.
The Events Selection tab consolidates the selection of events, data columns, and filters on
one screen. One of the biggest advantages of the SQL Server 2008 Events Selection tab is
that you can easily determine which data columns will be populated for each event by
looking at the columns that have check boxes available for the event. For example, the
Audit Login event has check boxes for Text Data, ApplicationName, and others but does
not have a check box available for CPU, Reads, Writes, and other data columns that are
not relevant to the event. For those data columns that have check boxes, you have the
Download from www.wowebook.com
ptg
126
CHAPTER 6 SQL Server Profiler
FIGURE 6.3 The Events Selection tab.
option of unchecking the box so that the data column will not be populated for the event
when the trace is run.
You may find that adding events in SQL Server 2008 is a bit confusing. When you select a
template, the event categories, selected events in those categories, and selected columns
are displayed in the Events Selection tab. Now, if you want to add additional events, how
do you do it? The answer to this question lies in the Show All Events check box in the
lower-right corner of the Events Selection tab. When you click this check box, all the
available event categories are listed on the screen. The events and columns that you had
previously selected may or may not be visible on the screen. They are not lost, but you
may need to scroll down the Events Selection tab to find the event categories that contain
the events you had selected prior to selecting the Show All Events check box.
You will also notice that all the events in the categories in which you had events selected
are displayed. In other words, if you had only 2 events selected in the Security Audit cate-
gory and then selected the Show All Events check box, you see all 42 events listed. The
only 2 events selected are the ones you had selected previously, but you need to wade
through many events to see them. One upside to this kind of display is that you can easily
view all the events for a category and the columns that relate to the events. One possible
downside is that the Events Selection tab can be very busy, and it may take a little extra
time to find what you are looking for.
Download from www.wowebook.com
ptg
127
Creating Traces
6
TIP
If you capture too many events in one trace, the trace becomes difficult to review.
Instead, you can create several traces, one for each type of information that you want
to examine, and run them simultaneously. You can also choose to add or remove
events after the trace has started. Keep in mind that you can pause a running trace,
change the selected events, and restart the trace without losing the output that was
there prior to pausing the trace.
Your ability to select and view events is made easier by using the tree control available on
each event. The tree control allows you to expand or compress an event category. When
you click the + icon next to a category, all the events are displayed. When you click the –
icon, the event category is collapsed to a single row on the display. When an event has
been selected for use within a category, the category name is shown in bold. If you want
to add all the events in a category to your trace, you can simply right-click the category
name and choose the Select Event Category option. You can also remove all events in a
category by right-clicking the category name and choosing the Deselect Event Category
option.
Understanding what each of the events captures can be a challenging task. You can refer to
“SQL Server Event Class Reference” in Books Online for a detailed description, or you can
use the simple Help facility available on the Events Selection tab. The Events Selection tab
has a Help facility that describes each of the events and categories. The Help text is
displayed on the Events Selection tab below the list of available events. When you mouse
over a particular event or event category, a description of that item is shown. This puts the
information you need at your fingertips.
NOTE
If you are going to use SQL Server Profiler, you should spend some time getting to
know the events first and the type of output that Profiler generates. You should do this
first in a development environment or standalone environment where the Profiler’s
effect on performance does not matter. It’s a good idea to start a trace with a few
events at a time and execute some relevant statements to see what is displayed for
each event. You will soon realize the strength of the SQL Server Profiler and the type of
valuable information it can return.
Data Columns
The columns of information captured in a Profiler trace are determined by the Data
Columns selected. The Events Selection tab has the functionality you need to add
columns, organize the columns, and apply filters on the data returned in these columns.
As mentioned earlier, you can select and deselect the available columns for a particular
event by using the check boxes displayed for the listed events. To understand what kind of
Download from www.wowebook.com
ptg
128
CHAPTER 6 SQL Server Profiler
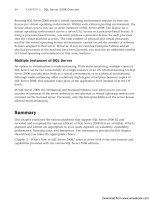
FIGURE 6.4 Help for data columns on the Events Selection tab.
information a column is going to return, you can simply mouse over the column, and
Help for that item is displayed in the second Help box below the event list. Figure 6.4
shows an example of the Help output. In this particular case, the mouse pointer is over
the ApplicationName column returned for the SQL:BatchCompleted event. The first Help
box displays information about the SQL:BatchCompleted event, and the second Help box
shows information about the data column.
Keep in mind that there is a default set of columns displayed for each event. You can view
additional columns by selecting the Show All Columns check box. When you choose this
option, an additional set of columns is displayed in the Events Selection tab. The addi-
tional columns are shown with a dark gray background, and you may need to scroll to the
right on the Events Selection tab to be able to see them. Figure 6.5 shows an example of
the additional columns displayed for the Performance event when the Show All Columns
option is used. Some of the additional columns available for selection in this example are
BigintData1 and BigintData2.
To organize the columns you have selected, you can choose the Organize Columns selec-
tion on the Events Selection tab. This Organize Columns window allows you to change
the order of the columns in the trace output as well as group the data by selected
columns. Figure 6.6 shows an example of the Organize Columns window with the groups
and columns selected by default when you use the TSQL_Grouped template.
To change the order of a column, you simply select the column in the list and use the Up
or Down buttons to move it. The same movement can be done with columns selected for
grouping. You add columns to groups by selecting the column in the data list and clicking
the Up button until the column is moved out of the Columns list and into the Groups
Download from www.wowebook.com
ptg
129
Creating Traces
6
FIGURE 6.5 Additional columns displayed with the Show All Columns option.
FIGURE 6.6 Organizing columns in the Events Selection tab.
list. For example, in Figure 6.6, you can group the SPID column by selecting it and click-
ing the Up button until it moves into the Groups tree structure instead of the Columns
tree structure.
TIP
You can select a par ticular column for all events by right-clicking the column header in
the Events Selection tab and choosing the Select Column option. This causes all the
check boxes on the grid to be selected. To remove a column from all events, you right-
click the column header and choose Deselect Column.
Download from www.wowebook.com
ptg
130
CHAPTER 6 SQL Server Profiler
FIGURE 6.7 Grouping on a single column.
The number of columns selected for grouping and the order of the columns are both
important factors in the way the trace data will be displayed. If you choose only one
column for grouping, the trace window displays events grouped by the values in the
grouped data column and collapses all events under it. For example, if you group by
DatabaseId, the output in the trace window grid displays DatabaseId as the first column,
with a + sign next to each DatabaseId that has received events. The number displayed to
the right of the event in parentheses shows the number of collapsed events that can be
viewed by clicking on the + sign. Figure 6.7 shows an example of the trace output window
that has been grouped by DatabaseId only. The database with a DatabaseId equal to 6 is
shown at the bottom of the grid in this example. The grid has been expanded, and some
of the 20 events that were captured for this DatabaseId are shown.
If you select multiple columns for grouping, the output in the trace window is ordered
based on the columns in the grouping. The events are not rolled up like a single column,
but the trace output grid automatically places the incoming events in the proper order in
the output display.
TIP
The organization of columns in a trace can happen after a trace has been defined and
executed. If you save the trace to a file or table, you can open it later and specify what-
ever ordering or grouping you want to reorganize the output. This flexibility gives you
almost endless possibilities for analyzing the trace data.
Filters
Filters restrict the event data returned in your trace output. You can filter the events
captured by the SQL Profiler via the Column Filters button on the Events Selection tab. An
example of the Edit Filter window is shown in Figure 6.8. All the available columns for the
Download from www.wowebook.com
ptg
131
Creating Traces
6
trace are shown on the left side of the Edit Filter window. Those columns that have filters
on them have a filter icon displayed next to the column in the column list.
The filtering options in SQL Server 2008 are similar to those available in SQL Server 2005.
Which options are available depends on the type of column you are filtering on. The
different filtering options are as follows:
. Like/Not Like—This option enables you to include or exclude events based on a
wildcard. You should use the % character as your wildcard character. When you have
completed a filter definition you can press Enter to create an entry space for another
filter definition. For example, with the ApplicationName filter, you can specify Like
Microsoft%, and you get only those events related to applications that match the
wildcard, such as Microsoft SQL Server Management Studio. This filtering option is
available for text data columns and data columns that contain name information,
such as NTUserName and ApplicationName.
. Equals/Not Equal To/Greater Than or Equal/Less Than or Equal—Filters with
this option have all four of these conditions available. For the Equals and Not Equal
To conditions, you can specify a single value or a series of values. For a series of
values, you hit enter after each value is entered and a new entry space is created for
you to enter the next value. For the other conditional types, a single value is
supplied. For example, you can filter on DataBaseID and input numeric values under
the Equals To node of the filtering tree. This filtering option is available for numeric
data columns such as Duration, IndexId, and ObjectId.
. Greater Than/Less Than—This type of filtering option is available only on time-
based data columns. This includes StartTime and EndTime filters. These filters expect
date formats of the form YYYY-MM-DD or YYYY-MM-DD HH:MM:SS.
Each data column can use one of these three filtering options. When you click the data
column available for filtering, you see the filtering options for that column displayed in
the right pane of the Edit Filter window. You enter the values on which you want to filter
FIGURE 6.8 Editing filter properties.
Download from www.wowebook.com
ptg
132
CHAPTER 6 SQL Server Profiler
in the data entry area on the filter tree. This input area is shown when you select a
specific filtering option. For multiple filter values, you press the Enter key after you enter
each value. This causes a new data entry area to appear below the value you were on.
CAUTION
Filters applied to columns that are not available or selected for an event do not prevent
the event data from being returned. For example, if you place a filter on the
ObjectName column and choose the SQL:StmtStarting event as part of your trace,
the event data is not filtered because ObjectName is not a valid column for that event.
This behavior may seem relatively intuitive, but it is something to consider when you
are receiving output from a trace that you believe should have been filtered out.
Also, be careful when specifying multiple filter values and consider the Boolean logic
applied to them. When you specify multiple values for the Like filter, the values are
evaluated with an OR condition. For example, if you create a filter on ObjectName and
have a Like filter with values of A%, B%, and C%, the filter returns object names that
start with A or B or C. When you use the Not Like filter, the AND condition is used on
multiple values. For example, Not Like filter values for ObjectName of A% and C%
result in objects with names that do not start with A and object names that do not
start with C.
Executing Traces and Working with Trace Output
After you define the events and columns you want to capture in a trace, you can execute
the Profiler trace. To do so, you click the Run button on the Trace Properties window, and
the Profiler GUI starts capturing the events you have selected. The GUI contains a grid
that is centrally located on the Profiler window, and newly captured events are scrolled on
the screen as they are received. Figure 6.9 shows a simple example of the Profiler screen
with output from an actively running trace.
The Profiler GUI provides many different options for dealing with an actively running
trace. You can turn off scrolling on the trace, pause the trace, stop the trace, and view the
properties of an actively running trace. You can find strings within the trace output, and
you can even move the columns around in the display so that they are displayed in a
different order. These options provide a great deal of flexibility and allow you to focus on
the output that is most important to you.
Saving and Exporting Traces
In many cases, you want to save or export the trace output generated by a Profiler trace.
The output can be analyzed, replayed, imported, or manipulated at a later time after it has
been saved. Trace output can be saved as the trace is running or saved after it has been
generated to the Profiler GUI. The Trace Properties window provides options for saving
trace output while the trace is running. The options are defined using the Save to File and
Save to Table options on the General tab of the Trace Properties window. You can save to a
Download from www.wowebook.com
ptg
133
Saving and Exporting Traces
6
FIGURE 6.9 The Profiler GUI with an active trace.
file, a table, or both a table and a file. Figure 6.10 shows an example of a trace that will
save to both a file and table while it is executing.
Saving Trace Output to a File
When you save a running trace to a file, you have several options for controlling the
output. One option you should always consider is the Set Maximum File Size (MB) option.
This option prevents a trace output file from exceeding the specified size. Controlling the
FIGURE 6.10 Saving trace output while a trace is running.
Download from www.wowebook.com