Hands-On Microsoft SQL Server 2008 Integration Services part 45 doc
Bạn đang xem bản rút gọn của tài liệu. Xem và tải ngay bản đầy đủ của tài liệu tại đây (457.18 KB, 10 trang )
418 Hands-On Microsoft SQL Server 2008 Integration Services
a randomly selected 15 percent of the total records in the segment. One other example
could be that you need to create a training data set and a test data set for your data
mining models and you want to divide your data set based on a defined percentage. In
such a case, you can use the Percentage Sampling transformation to create a sample
data set from the input rows using the specified percentage. This transformation helps
you create a representative data set much smaller in size that you can use for variety
of purposes, such as testing your packages in a development environment or using the
sample data set for surveys and marketing purposes.
The Percentage Sampling transformation has a simple and intuitive user interface with
just four fields. The first field, Percentage Of Rows, allows you to specify a percentage
of sampling. The Percentage Sampling transformation uses an algorithm to select at
random the number of rows according to the specified percentage. However, the number
of rows that this transformation selects does not precisely match with the percentage
calculations—i.e., the output rows may be a little bit too many or a little bit too few. The
next two fields allow you to specify the names for selected sample output rows and the
remaining unselected output rows. As this transformation selects rows for sampling, it
outputs those rows onto its first output and the remaining unselected rows are outputted
on to its second output. This transformation supports one input and two outputs to
support both the selected and unselected data sets and supports no error output.
The last field is a check box and a value pair, you can select the check box if you
want to specify a sampling seed and type a value in the field provided as the sampling
seed. If you specify a sampling seed and reuse the same sampling seed in a later run, it
will produce the same sample output no matter how many times you run the package
with the same data set. This is helpful in testing of packages. Alternatively, if you don’t
specify a sampling seed, this component will generate a random number using the tick
count of the operating system. Hence, each time you run a package, a different random
number is generated and a different data set is sampled.
Row Sampling Transformation
The Row Sampling transformation works quite similar to the Percentage Sampling
transformation to sample a data set. However, the Row Sampling transformation
outputs an exact number of rows as specified in the transformation. This random
selection of a precise number of rows is sometimes very useful. An example of such
a scenario can be a gift allocation to the random selection of people. Suppose you’re
running a campaign to introduce your new product to different segments of your
customers and prospects by sending them an e-mail every week. To promote readers’
interest, you decide to award gifts to a random selection of 50 persons who show
interest in your product by evaluating it every week. You can easily build this package
by bringing into the data flow the records for the persons who evaluated the product in
Chapter 10: Data Flow Transformations 419
the current week and then apply a Row Sampling transformation to select 50 persons
out of these records.
In the Row Sampling Transformation Editor, you specify the number of rows
you want to output. This transformation supports two outputs—one for extracting
the selected records and the other for unselected records. You can type in the names
for both the outputs in the user interface. It is not necessary for you to configure a
downstream data flow to capture the unselected records. You can simply ignore this
output, and the records appearing on this output will not be included in the data flow.
You can choose to specify a random seed for selection of records by clicking in
the “Use the following random seed” check box. This transformation selects random
records on the basis of an algorithm that uses the random seed. If you specify the same
random seed, the algorithm will select the same random records for the same input
data. When you check this option, a message will pop up to tell you that using the same
random seed on the same input data always generates the same sample, and specifying
a random seed is recommended only during the development and testing of a package.
Specifying a random seed affects the selection of records, and when you don’t specify
a random seed, the transformation uses the tick count of the operating system to create
the random number that is obviously different each time you run the package, and
hence the selected random records will be different even for the same input data.
Pivot Transformation
Relational databases are modeled to store normalized data. This normalization of data
changes the data view in a way that sometimes may not be as intuitive as businesses
desire. The process that is used to convert data from a normalized form to a denormalized
form is called pivoting. To understand how you can use this transformation, you will be
working through a Hands-On exercise later; but for now, let’s discuss what a normalized
data is by looking at the data we are going to use.
The data you will use in an exercise later is in an Excel spreadsheet that keeps sales
order details in three columns: SalesOrderID, ProductName, and OrderQuantity. To
keep the data in a normalized form, the table contains multiple entries or rows for the
same SalesOrderID. For example, if three products have been purchased under a single
SalesOrderID, the normalized data is represented by listing three rows for the same
SalesOrderID with a different ProductName in each row to show the purchase quantity
for that product. But the sales manager may prefer to see the sales order details with the
products and the quantity for each of them listed against the SalesOrderID on the same
row. This is when you need to use pivot function to denormalize the data.
Before SSIS made it available, the pivot function was available in Microsoft Excel or
third-party tools, or you had to write custom code to accomplish the task. Integration
Services now provides both a Pivot transformation and an UnPivot transformation to
420 Hands-On Microsoft SQL Server 2008 Integration Services
provide different data views or forms. The Pivot transformation converts a normalized
data set into a less normalized form by pivoting the input data on a column value. The
role a column performs in pivoting is defined by the PivotUsage property specifying
values ranging from 0 to 3. The column that is used to pivot the data around forms the
set key for pivoting, and this column is assigned a value of 1 for the PivotUsage property.
Assigning a value of 1 to the PivotUsage property of an input column indicates that it is part
of the set key of a single-row or multirow set. In our example, the SalesOrderID column
will act as a set key for pivoting and the multiple rows with the same SalesOrderID will
be combined into one row.
When the data is pivoted, the values in a column, called pivot key values, are pivoted
to the columns in the output. For specifying the values to be pivoted to output columns,
you assign a value of 2 to the PivotUsage property on the input column. In our example,
the ProductName column has 10 different values for the products. When this data is
pivoted, 10 columns are created on the basis of 10 different values in the ProductName
column—e.g., the value Mountain–100 of the ProductName column becomes the
Mountain–100 column in the pivoted output. These newly created columns in the
pivoted output get the values from the third column, which is used to provide values for
newly created columns in the pivoted output by specifying a value of 3 to the PivotUsage
property. All other input columns that don’t participate in the pivoting process are
assigned PivotUsage value of 0, and for the set of input rows that has same set key, the
first input value for the column is copied to the output column.
The Pivot transformation pivots the data on the basis of set key column value. For the
same value of set key, the Pivot transformation merges multiple rows into a single row and
pivots the input rows into columns. This implies that if the data is not sorted to list the
same set key values in one collection of rows, this transformation will output the same key
values multiple times. In our example, to get only one record for a SalesOrderID, the data
must be sorted on SalesOrderID. However, if the data is not sorted on SalesOrderID, this
transformation will generate multiple records for same SalesOrderID, as it will pivot the
rows to columns each time the value of SalesOrderID changes.
All this may appear quite complex, but it is not that complicated when it comes to
configuring the Pivot transformation. Let’s see how to use this transformation to pivot
data from an Excel worksheet.
Hands-On: Pivoting Sales Order
Records in an Excel Worksheet
The records exported from the Sales order database to an Excel worksheet are in the
normalized form—i.e., one sales order number appears in multiple rows to store details
for the products ordered against it. The sales manager wants to see details of all the
products ordered against each sales order in a single row.
Chapter 10: Data Flow Transformations 421
Before starting this exercise, open the C:\SSIS\RawFiles\SalesOrders.xls file to
verify that the file has only one worksheet labeled Normalized. This exercise adds
another worksheet to this file; if it already has two worksheets, delete the second
worksheet and then start this exercise. Also, if you are using the provided package code,
you may get a validation error, as the Excel Destination used in the package looks for
the worksheets during this exercise. In this case, leave the worksheets as is.
Method
In this exercise, you will be using a Pivot transformation to transform the given data
to the required format and will put the pivoted data in a new worksheet. As Pivot
transformation pivots the data every time the set key column value changes, you will
need to sort the data before the Pivot transformation.
Exercise (Add Connection Manager and Data Flow Task)
You will start this exercise with adding a new package to the Data Flow transformations
project, and then adding an Excel Connection Manager to it.
1. Open the Data Flow transformations project in BIDS. Right-click the SSIS
Packages in the Solution Explorer and choose New SSIS Package. This will add
a new SSIS package called Package1.dtsx.
2. Rename the Package1.dtsx package to Pivoting SalesOrders.dtsx.
3. Right-click in the Connection Managers area and choose New Connection
from the context menu. Select the Excel Connection Manager type from the
list in the Add SSIS Connection Manager dialog box and click Add. Next, Type
C:\SSIS\RawFiles\SalesOrders.xls in the Excel file path field in the Excel
Connection Manager dialog box. Leave the Excel Version selected as Microsoft
Excel 97-2003 and see that the check box for First Row has column names
checked. Click OK to add the Excel Connection Manager in the Connection
Managers area. Rename it as SalesOrders Connection Manager.
4. Drag the Data Flow Task from the Toolbox and drop it onto the Control Flow
Designer surface. Rename this task Transforming SalesOrders. Double-click it
to open the Data Flow tab and configure this task.
Exercise (Configure the Data Flow Task)
To configure a data flow for pivoting SalesOrders data, here you will add an Excel source
to extract data from a normalized worksheet of the SalesOrders.xls file and then sort this
data on the SalesOrderID, as a Pivot transformation requires all the rows having the same
set key to be together in a sorted set for merging them to a single row. After sorting the
data, you will configure the Pivot transformation to pump the pivoted data through to an
Excel destination that will write the pivoted output to a new Excel worksheet.
422 Hands-On Microsoft SQL Server 2008 Integration Services
5. From the Toolbox, drag and drop the Excel source onto the Data Flow Designer
surface. Rename this adapter Normalized Data Source. Double-click the
Normalized Data Source to open the Excel Source Editor. The SalesOrders
Connection Manager will be listed in the OLE DB Connection Manager field
for you. Select the Normalized$ in the “Name of the Excel sheet” field.
6. Go to the Columns page, and verify that all the three fields have been selected
from the Available External Columns. Click OK to close the editor.
7. Drop the Sort transformation from the Toolbox onto the Data Flow Designer
surface just below the Normalized Data Source and join both the components
using green connector. Rename it as Sort on SalesOrderID and double-click to
open the Sort Transformation Editor. Click to select the check box before the
SalesOrderID column. This column will appear in the lower half of the dialog
box with Sort Type as ascending and Sort Order equal to 1. Leave these setting
as is and click OK to close this editor.
8. Drop the Pivot from the Toolbox onto the Designer surface just below the Sort
on SalesOrderID. Connect the two transformations using the green arrow.
Double-click the Pivot to open the Advanced Editor for Pivot, as Pivot doesn’t
have a custom UI. In the Component Properties tab, change the Name field to
Pivot on ProductName.
9. Go to the Input Columns tab and select all three columns.
10. Move on to the Input and Output Properties tab. Expand the Input Columns
under Pivot Default Input on the left side of the dialog box to reveal the three
columns you have selected in the Input Columns tab. Click the SalesOrderID
to list the properties of this column on the right pane of the dialog box. Scroll
down in the properties to locate the PivotUsage property. Assign a value of 1 to
PivotUsage, indicating that this field will be treated as a set key. Now, click the
ProductName column and assign a value of 2 to its PivotUsage property to indicate
that this field is a pivot key field and the distinct values in this field will create
corresponding columns in the output. Next, click the OrderQuantity column and
assign a value of 3 to its PivotUsage property to indicate that the values from this
field will be populated in the columns generated by the pivot key column.
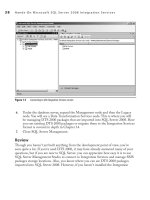
11. Expand Pivot Default Output and then click the Output Columns. You will
notice that no output column appears in this transformation yet. Click Add
Column and rename the newly added column SalesOrderID. This output
column needs to be linked to an input column. In the properties of this column,
locate the SourceColumn property. This property holds the lineage identifier
of an input column and tells the Pivot transformation to populate the output
column using values from the specified input column. To specify the source in
this column, click the SalesOrderID column under Input Columns and note the
LineageID (not the ID). Specify this value of LineageID in the SourceColumn
property of SalesOrderID output field. The value 32 shown in the SourceColumn
property in Figure 10-10 is the LineageID of the SalesOrderID input column.
Chapter 10: Data Flow Transformations 423
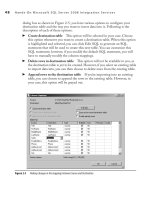
12. As you did in Step 11, add 10 more columns in the Output Columns and
rename them as per the following table. Also, assign values to the PivotKeyValue
and SourceColumn properties of the new output columns. Remember that
PivotKeyValue is one of the distinct values of pivot key column and the
SourceColumn indicates from which input column the data will populate the
concerned output column. The new columns added here will be populated by
Figure 10-10 Setting LineageID on the SourceColumn property
424 Hands-On Microsoft SQL Server 2008 Integration Services
OrderQuantity input column, so the LineageID of OrderQuantity will be used to
populate all of them.
Output Column Renamed to PivotKeyValue SourceColumn
Column Mountain-100 Mountain-100 LineageID Value of OrderQuantity column
Column1 Mountain-200 Mountain-200 LineageID Value of OrderQuantity column
Column2 Mountain-300 Mountain-300 LineageID Value of OrderQuantity column
Column3 Road-150 Road-150 LineageID Value of OrderQuantity column
Column4 Road-250 Road-250 LineageID Value of OrderQuantity column
Column5 Road-350 Road-350 LineageID Value of OrderQuantity column
Column6 Touring-1000 Touring-1000 LineageID Value of OrderQuantity column
Column7 Touring-2000 Touring-2000 LineageID Value of OrderQuantity column
Column8 Touring-3000 Touring-3000 LineageID Value of OrderQuantity column
Column9 Sport-100 Sport-100 LineageID Value of OrderQuantity column
Refer to Figure 10-11 to see how this will look. In the figure, the value 42 in the
SourceColumn is the LineageID of OrderQuantity input column. Click OK to
close this transformation.
13. Drop the Excel destination from the Toolbox just below the Pivot on ProductName
and connect the two transformations using the green arrow. Rename it as Pivoted
Data Destination. Double-click the Pivoted Data destination to open the Excel
Destination Editor. You will use the same connection manager and the same Excel
workbook. But you will add a new worksheet called Pivoted in the Excel workbook
to store the pivoted data. Click the New button opposite the “Name of the Excel
sheet” field and you will see a script to create a new worksheet in the Excel workbook.
Change the Pivoted Data Destination just after CREATE TABLE statement to
Pivoted only. This will create a new worksheet named Pivoted in the SalesOrders.xls
file. Click OK and select the Pivoted sheet in the “Name of the Excel sheet” field.
14. Go to the Mappings page. As you click Mappings, you should see all the mappings
created for you automatically. Click OK to close the editor for this component.
Exercise (Add Data Viewers and Execute the Package)
After having configured all the data flow components, you are ready to execute the
package. However, in this exercise, you will also add data viewers before and after the
Pivot transformation to see how the data has been pivoted.
15. Double-click the data flow path connecting Sort on SalesOrderID and Pivot
on ProductName. In the Data Flow Path Editor, click the Data Viewers page,
and then click Add and add a grid type data viewer. Click OK twice to close the
editor window.
Chapter 10: Data Flow Transformations 425
16. Similarly, add another grid type data viewer on the data flow path between Pivot
on ProductName and Pivoted Data Destination.
17. Press 5 to execute the package. As the Normalized Data Source extracts data and
passes to the Sort on SalesOrderID, you can see Normalized Data Source turns
green, indicating a successful extraction of data and a total of 2,187 records extracted.
The next two components will appear in yellow, as the data viewer is holding the
execution process for you to check the data. Click the Detach button on the first data
Figure 10-11 Configuring output columns for the Pivot transformation
426 Hands-On Microsoft SQL Server 2008 Integration Services
viewer to let the execution proceed. As you detach the first data viewer, you will see
the second data viewer pop up with populated data and the Pivot on ProductName
outputting 1,302 rows. As the data passes the Sort on SalesOrderID, it will turn
green to indicate a successful sort operation (see Figure 10-12). When you are
done checking the data, click the Detach button on the second data viewer and let
the package complete successfully.
18. Stop debugging by pressing -5. Save and close the project. Open the
SalesOrders.xls file and check out the Pivoted worksheet to see how the data has
been pivoted.
Review
You’ve used a Pivot transformation to convert normalized data to a less normalized form.
During this exercise, you sorted the data before sending it to the Pivot transformation
Figure 10-12 Data viewers showing data before and after Pivot transformation
Chapter 10: Data Flow Transformations 427
and created output columns for the pivoted data. Finally, you created a new Excel
worksheet using an Excel destination. Note that you’ve used only one connection
manager to connect to Excel file for both extractions of data using a source adapter
and loading of data using a destination adapter.
Unpivot Transformation
This transformation works in an opposite way to the Pivot transformation and converts
a denormalized data set into a more normalized version—i.e., one row may be broken
down into multiple atomic rows so that they can be stored in a relational database.
We will use the data you derived in the last exercise, in which each row lists multiple
products against a single SalesOrderID. When you run this transformation, the records
will be broken up into multiple rows containing the same value for SalesOrderID, but
having only one product in each row. To support its functions, this transformation uses
one input, one output, and an error output.
This transformation has a custom user interface that is much simpler than that of the
Pivot transformation. To get an idea of how to configure this transformation, consider
the pivoted data that you created in the preceding exercise. To get the data formatted
in the normalized form—i.e., from where you started in the last Hands-On—you will
configure the Unpivot transformation, as shown in Figure 10-13.
Following is the step-by-step method you will use to get the pivoted data back to
normalized form:
1. Use the Excel source to bring the Pivoted worksheet data in the data flow.
2. Add an Unpivot transformation and configure it. Let the set key column pass
through the transformation as is, which is SalesOrderID in this case. Then
select all the columns that you want to unpivot. As you select the check boxes for
Available Input Columns, the Input Column and the Pivot Key Value columns
will be filled in using the column name selected. After that, manually fill in
the Destination Column name where you want the values of input columns
to be populated, which is OrderQuantity in this example. Last, specify the
column name in which you would like pivot key values to be populated. These
configurations indicate that the input column names will be converted into the
values specified in the Pivot Key Value, which will then be populated in pivot
key value column (ProductName in this case), and input column values will
be populated in a new column specified in the Destination Column, which is
OrderQuantity column in this example.
3. Finally, add an Excel destination to collect the normalized data in an Excel
worksheet.