Lập trình Wrox Professional Xcode 3 cho Mac OS part 63 pps
Bạn đang xem bản rút gọn của tài liệu. Xem và tải ngay bản đầy đủ của tài liệu tại đây (1.76 MB, 7 trang )
480
❘
CHAPTER 18 DEBUGGING
EXAMINING DATA
Now that you ’ ve learned all about controlling the fl ow of your application while debugging, let ’ s
return to examining the content of variables. “ The Variables Pane ” section briefl y introduced the
variables pane of the debugging window. Now look at that pane in a little more detail and look at
other ways of examining the contents of memory.
To recap, the variables pane (previously shown in Figure 18 - 4) displays the known variables within
the scope of the selected stack frame. Variables are grouped by type. Structures and objects appear
as groups, forming a hierarchy of containers and values. These are described by the debug symbol
information attached to your program.
As you step through your program, the debugger compares the values that were displayed when
your program was last started against the values that appear when the debugger stopped it again.
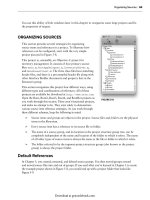
Any values that are different are highlighted in red, as shown in Figure 18 - 26 — it may be diffi cult
to see in this black - and - white illustration, but the value of variable
j is red.
FIGURE 18-26
The code was stopped at line 57 where the value of j was undefi ned. The Step Over command was
issued. The debugger allowed one statement (the for statement) to be executed and stopped the
program again. The value of j is now 4 and Xcode highlights the change in the display. Using the Step
Over command again returns the value to black again, because that statement did not alter its value.
It doesn ’ t matter how much the program executes between stops. As long as the variables pane is
showing the same set of variables at the next stop, Xcode highlights whatever values are now different.
Scalar Formats
The Value column displays the primitive value of each variable. For scalar values, this is a numeric
value. For structures and pointers to structures, it is the address of the structure or the value of the
pointer. The default display format for scalar values is Natural. For signed integers and fl oating -
point numbers, the column displays a signed decimal value. Unsigned integers display an unsigned
c18.indd 480c18.indd 480 1/22/10 12:55:45 PM1/22/10 12:55:45 PM
Download at getcoolebook.com
decimal number. Character types display both the decimal and Unicode representations of the value.
Pointers and structures are shown as hexadecimal memory addresses. The natural format is usually
suffi cient, but you can manually choose a different representation. The choices are as follows:
Hexadecimal
Decimal
Unsigned Decimal
Octal
Binary
OSType
You can fi nd these formats in the Run ➪ Variables View menu, or in the Right/Control - click
contextual menu of the variables pane. Select one or more variables in the pane and then choose
one of these fi xed formats to force the expression of the value, or values, into the desired format.
Choose Natural to return to Xcode ’ s automatic formatting. The fi rst fi ve formats are self - explanatory.
The OSType format displays a 32 - bit integer as a four - character string. This data type is used by
many system APIs.
Viewing Data in Another Window
You can also choose to examine the contents of a value or structure in a separate window. Double -
click the variable name, choose the Run ➪ Variables View ➪ View Variable In Window command,
or from the Right/Control + click contextual menu. This can be particularly useful for viewing large
or complex objects. It is also handy because the variable ’ s value continues to be displayed as long
as the variable exists. You can place a local structure pointer in a separate window and continue to
examine its value while stepping though other functions. After the variable is no longer in scope or
its stack frame is released, the window containing the value closes.
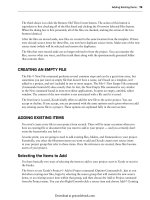
If a variable type isn ’ t even close to the type of data it represents, you can use the Run ➪ Variables
View ➪ View Value As command, also available via the Right/Control + click contextual menu of the
variables pane. Select a variable in the list and choose this command. Xcode prompts you to enter a
cast for the variable ’ s value, as shown in Figure 18 - 27.
➤
➤
➤
➤
➤
➤
FIGURE 18-27
Xcode then attempts to interpret the value of that variable using the type cast. This is particularly
useful for generic types such as void* . As shown in Figure 18 - 27, the pointer to a string was
assigned to a void* variable. By using the View Value As command, you can coerce the debugger to
interpret the void* value as if it was a char* variable, shown on the right.
Examining Data
❘
481
c18.indd 481c18.indd 481 1/22/10 12:55:47 PM1/22/10 12:55:47 PM
Download at getcoolebook.com
482
❘
CHAPTER 18 DEBUGGING
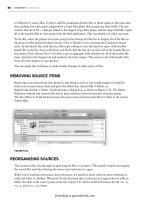
Sometimes you just need to look at memory. Using the Debug ➪ Variables View ➪ View As Memory
command, you can open the memory browser window shown in Figure 18 - 28.
FIGURE 18-28
The browser displays a block of memory in hexadecimal and ASCII formats, much like the
hexdump command. The Address fi eld determines the starting address of the display. Initially,
this is the address of the selected scalar, structure, or object in the variables pane. If the selected
variable is a pointer or object reference, the address is the value of that pointer (a dump of what
the pointer points to, not a dump of the pointer ’ s value). The Bytes menu lets you select how much
memory is disassembled in the window. Choose one of the preset values or enter your own. Use the
up and down arrows between the Address and Bytes fi eld to move one page of memory forward
or backward. The Word Size and Columns menus control the number of bytes in each column of
hexadecimal values, and the number of columns in each line, respectively.
There is only one memory browser window. Selecting a new address using the View As Memory
command simply changes the address in the Address fi eld. The Address fi eld has a pop - up menu
that keeps a short history of previously viewed addresses. If you need to follow a pointer to another
address that you fi nd in a block of memory, simply copy the address from the hexadecimal listing
and paste it into the Address fi eld (prefi xing it with 0x).
If you try to view memory that is outside the address space of your application, the memory browser
displays A ’ s for the bytes it can ’ t access.
Viewing Global Variables
The Globals group in the variables pane contains a selected set of global variables that you want to
examine. Normally, this group has nothing. It ’ s impractical for this group to contain every global
variable in your application ’ s process space. The group could contain hundreds of variables, be
impossible to navigate, and place a huge burden on the debugger display.
Instead, the group starts out empty. Use the global variables window, shown in Figure 18 - 29, to
add variables to this group or merely browse the global variables in your application. You can open
this window using the Run ➪ Show ➪ Global Variables command or by attempting to expand the
Globals group when it is empty.
c18.indd 482c18.indd 482 1/22/10 12:55:48 PM1/22/10 12:55:48 PM
Download at getcoolebook.com
The global variables window is divided between a list of modules on the left and the list of global
variables in each module on the right. Select a module, and Xcode lists all of the global variables
that your application has access to on the right. To search for a particular variable name, enter some
fragment of the variable ’ s name in the search fi eld at the top of the window.
Figure 18 - 29 examines the global variables declared in a program named DataBlock. The listing
tells you the fi lename the variable is declared in, its current value, and its type. By selecting the box
in the View column, this variable is added to the Globals group in the variables pane. The viewed
global variables are recorded in the user preferences of the project document. After these variables
are added, they will always appear in the Globals group of your variables pane until they are
removed or until the variable itself no longer exists.
Expressions
Another way to view variables is through expressions.
Expressions appear in the Expressions window,
shown in Figure 18 - 30. You can open this window
using the Run ➪ Show ➪ Expressions command. To
add an expression in the window, type the expression
in the input fi eld at the bottom of the window, or
select any variable and choose Run ➪ Variables
View ➪ View Variable As Expression.
These are debugger expressions and are subject to all of the limitations and caveats of breakpoint
conditions. In the Expressions window, each expression acts like a variable. You can alter its display
format or open it in a separate window. You can also add type casts to an expression to coerce the
interpretation of the expression ’ s value.
Expressions are interpreted within the context of the currently selected stack frame, and those
expressions retain that context. In the example previously shown in Figure 18 - 30, there are
two expressions that resolve to value of the integer
i , but these two variables are from different
stack frames. Each was added to the window and a different stack frame was selected in the threads
pane. The fi rst one was added while a function was executing, but that function has now returned.
Therefore, the context that defi ned that variable no longer exists and the expression is marked as
“ out of scope. ”
FIGURE 18-29
FIGURE 18-30
Examining Data
❘
483
c18.indd 483c18.indd 483 1/22/10 12:55:48 PM1/22/10 12:55:48 PM
Download at getcoolebook.com
484
❘
CHAPTER 18 DEBUGGING
To delete an expression, select it in the Expressions window and press the Delete key.
Expressions are very useful for examining the contents of array values. An expression like stack[1]
examines the second element in the stack array. The expression buffer[index] examines whichever
element the variable index refers to.
DATA FORMATTERS
The summary column in the variables pane is designed to present a compact, informative
explanation of the value or object. For some objects, like strings, the summary value is obvious.
For objects like a collection it might display the size of the collection — not a lot of detail, but
still informative. For an opaque FSRef structure, it might convert that structure into a readable
fi lename — very informative, indeed. This descriptive transformation is done using data formatters.
Xcode includes many data formatters, but they won ’ t help with any object that you defi ne. You can
create your own data formatters to summarize complex data structures and objects in the debugger.
Creating a Custom Data Formatter
Creating your own data formatters is very easy. It is really nothing more than a format string with
placeholders for values or expressions derived from the variable being summarized. Any regular
text in the data formatter is displayed verbatim. There are two kinds of placeholders: references and
expressions.
References are delimited by two percent characters ( %reference% ). A reference can refer to a single
member variable by name. If the variable is contained in a substructure, use the appropriate period
(.) separated variable name. You cannot use operators such as pointer dereferences or array indexes.
For that, you need to use an expression. Taking the class that ’ s defi ned in Listing 18 - 3, the reference
to the integer
record_no of DataBlock class would be %header.record_no% .
LISTING 18 - 3: Sample class
typedef struct {
int record_no;
unsigned long checksum;
} BlockHeader;
@interface DataBlock : NSObject
{
@public
BlockHeader header;
NSMutableData* data;
}
An expression is any debugger expression; the same kind of expression that you can add to the
Expressions window. In fact, it ’ s good to think of an expression in a data formatter as an expression
in the Expressions window, as you ’ ll see in moment.
Expressions are contained between matching braces ( { expression } ). Unlike references, expressions
do not assume the context of the value being examined. To refer to the object being examined, use
c18.indd 484c18.indd 484 1/22/10 12:55:49 PM1/22/10 12:55:49 PM
Download at getcoolebook.com
the $VAR macro in the expression. $VAR will be replaced with the name of the variable when the data
formatter is evaluated. Using the previous class as an example again, the expression to access the
record_no value would be {$VAR.header.record_no} . If you ’ re now guessing that you can refer to
other variables in the context of the current stack frame, you ’ re correct. However, this isn ’ t a good
idea, which is explained later. Limit your evaluation to the structure or object being examined.
The advantage of expressions over references is that they are more expressive. You can perform
math, include conditionals, and even call member functions. Again using the class defi ned in
Listing 18 - 3, here are some valid expressions:
{$VAR.header.record_no}
{$VAR.header.checksum & 0x0000ffff}
{$VAR.data?(int)[$VAR.data length]:0}
Combining these two techniques, you can now create a data formatter for the DataBlock object
type. Start by running the program and stopping the debugger with an instance of the DataBlock
class in scope. Make sure that Run ➪ Variables View ➪ Enable Data Formatters is checked. Select
the DataBlock variable in the variables pane and choose the Run ➪ Variables View ➪ Edit Summary
Format. The debugger lets you edit the data formatter for the variable. Now you can enter the data
formatter string shown in Figure 18 - 31.
➤
➤
➤
FIGURE 18-32
FIGURE 18-31
After it has been entered, this text becomes the data formatter used for every instance of the
DataBlock class. The debugger resolves the references and expressions for each instance, creating
the more informative summary shown in Figure 18 - 32.
The syntax used for references and expressions can be extended to obtain other information
about the value or expression. The fi nal display value can be something different from the value to
which the expression evaluates. The other types of information that can be extracted from an
expression are chosen using one of the column selectors listed in the following table. The “ column ”
Data Formatters
❘
485
c18.indd 485c18.indd 485 1/22/10 12:55:50 PM1/22/10 12:55:50 PM
Download at getcoolebook.com
486
❘
CHAPTER 18 DEBUGGING
you are selecting is one of the columns in the variables pane or the Expressions window. In essence,
the result of a reference or expression is treated as if it had been entered into the Expressions
window. The column selector lets you choose which column in the window will be used as the result
of the expression. You can think of an expression result as an object with four properties (value,
name, type, and summary) — the column selector lets you choose which property to display.
COLUMN SELECTOR DESCRIPTION
{ expression }:v ,
% reference %:v
The value of the expression — that is, the primitive numerical value that
would appear in the Value column of the Expressions window. This is the
default column. Omitting the column selector is equivalent to using
:v .
{ expression }:t ,
% reference %:t
The type of the fi nal data object to which the expression evaluates. A
numerical expression would result in a primitive data type, such as int or
double. The type of an expression that refers to a member variable, or
calls a function, will be the type of the expression ’ s result. For example,
the expression
{[$VAR owner]}:t would display the type of the object
returned by the method owner.
{ expression }:s ,
% reference %:s
This selector results in the text that would appear in the Summary column
of the expression. Because the Summary column can be formed using
data formatters, this is a way of using other data formatters in portions
of your data formatter. You can only use this on expressions that have a
summary display. Expressions that result in primitive values do not have
any content in their Summary column.
{ expression }:n ,
% reference %:n
The name of the variable or expression that would appear in the
Expression column of the Expressions window. The column is self -
referential and not particularly useful.
The type column ( :t ) can be useful for displaying the type or class of a member value. For
example, if you have a class that manages a collection of homogenous objects, a data formatter
of collection of {[$VAR lastObject]}:t would tell you what kind of objects your collection
contains.
The summary column selector is the most useful. You can use it to construct data formatters from
other data formatters.
To get a feel for creating your own data formatters, look at the following example. Let ’ s assume
you have a project with the DataBlock class shown in Listing 18 - 3, and a subclass named
StampedDatablock, shown in Listing 18 - 4.
LISTING 18 - 4: DataBlock subclass
@interface StampedDataBlock : DataBlock
{
@private
NSCalendarDate* createdDate;
NSCalendarDate* modifiedDate;
}
c18.indd 486c18.indd 486 1/22/10 12:55:51 PM1/22/10 12:55:51 PM
Download at getcoolebook.com