Lập trình Wrox Professional Xcode 3 cho Mac OS part 62 pptx
Bạn đang xem bản rút gọn của tài liệu. Xem và tải ngay bản đầy đủ của tài liệu tại đây (4.32 MB, 16 trang )
If you like the mini - debugger, you ’ ll probably want to set the On Start Open Mini Debugger setting
in the debugging preferences pane.
BREAKPOINTS
Breakpoints are locations in your program where you want the debugger to take control. Formally,
a breakpoint is set at a particular address in memory. When the CPU ’ s program counter matches
the address of a breakpoint — that is to say at the instant before the instruction at that breakpoint ’ s
address is to be executed — the CPU stops executing your program and passes control to the
debugger.
So far you ’ ve created only basic breakpoints. The default action of a breakpoint is to halt the
execution of your program, hand over control to the debugger, and wait for instructions, but
breakpoints are capable of much more.
Before getting into more advanced techniques for defi ning breakpoints, here ’ s a quick review of the
methods for creating a basic breakpoint — one that simply stops the program when encountered:
Click in the gutter of a source fi le.
Right/Control - click in the gutter of a source fi le and choose the Add Breakpoint command.
Choose the Run ➪ Manage Breakpoints ➪ Add Breakpoint At Current Line (Command+\)
command when the active text cursor is in a source fi le.
Use any of the debugger commands to create a temporary breakpoint and start the program
running.
When you ’ re setting breakpoints graphically, Xcode allows you to set a breakpoint on just about
any line of the source fi le. A lot of times this doesn ’ t make any sense, but Xcode can ’ t tell that.
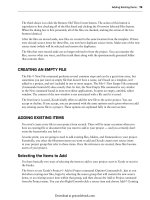
When you set a breakpoint in a source fi le, you ’ re actually setting the breakpoint at the fi rst
executable instruction produced by the source fi le at, or following, the line you clicked. Figure 18 - 18
shows three breakpoints set in a source fi le. All three of these breakpoints point to the same address
location. The fi rst one is set on a declaration statement that produces no code, and the second one is
set on a completely blank line. Only the source code on line 30 produces any executable code in the
application. Ultimately, you could set a breakpoint on line 28, 29, or 30 with the same results. The
breakpoint is set at the instruction that implements the
switch statement.
➤
➤
➤
➤
FIGURE 18-18
Breakpoints
❘
465
c18.indd 465c18.indd 465 1/22/10 12:55:22 PM1/22/10 12:55:22 PM
Download at getcoolebook.com
466
❘
CHAPTER 18 DEBUGGING
In a similar vein, source code that you might not think of as producing code often does. A good
example is the closing brace of a C++ function. All functions have to return, and the closing brace
of the function body produces code that destroys any automatic objects, pops the stack frame, and
returns to the caller. This happens even in void functions. Consequently, you can set a breakpoint at
the closing brace of a function if you want to catch the function after the body of the function has
executed, but before it returns to the caller.
The concept that this section is trying to express is that there is not always a simple one - to - one
correlation between the source code statements and the executable code with which the debugger
deals. The debugger does its best to translate between the two, but inconsistencies do occur. Just be
prepared for this and understand what ’ s going on.
Breakpoint Types
There are two kinds of breakpoints: source breakpoints and symbolic breakpoints. So far, this
chapter has only dealt with source breakpoints. Source breakpoints are associated with a particular
line in a source fi le. You set and see source breakpoints right in the gutter of the source fi le ’ s
editor pane.
Symbolic breakpoints are breakpoints that have been created for a particular symbol — that is, at
the address of a symbol defi ned in the program. There are two important differences between a
symbolic breakpoint and a breakpoint set at a line in a source fi le.
The most obvious is that you don ’ t have to have the source fi le. Using symbolic breakpoints, you
can set a breakpoint at the entry point of any library routine or framework API. For example,
you could set a symbolic breakpoint at the
free() function. Any code that calls the free( )
function would break into the debugger.
The other important difference is that the breakpoint address is not associated with a line in a source
fi le. You could cut the function from one fi le and paste it into another, and the breakpoint would
still work.
You fi nd out how to create symbolic breakpoints shortly.
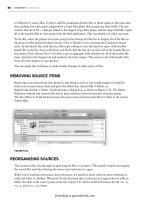
Breakpoints Window
Breakpoint management gets far more interesting when you open the breakpoints window,
shown in Figure 18 - 19. You can do this by choosing the Run ➪ Show ➪ Breakpoints
(Command+Option+B) command — which is also available as a button in many toolbars.
The toolbar button has an icon of a window containing a breakpoint (not to be confused with the
other breakpoints button that has a + sign). You can also double - click any breakpoint you see in a
source fi le.
c18.indd 466c18.indd 466 1/22/10 12:55:22 PM1/22/10 12:55:22 PM
Download at getcoolebook.com
Breakpoints
❘
467
The Breakpoints window has two panes: a Groups & Files pane containing the Breakpoints smart
group and a details pane listing the individual breakpoints. It should be noted that this is really just
an abbreviated view of your project window, without the editor pane. Everything you can do in the
Breakpoints window can be accomplished in the Breakpoints smart group and details pane of your
project window.
Breakpoint Groups
The Breakpoints smart group has two subgroups. Each open project creates a group that contains
all breakpoints specifi c to that project. The group might be simply named Project Breakpoints, or if
multiple projects have been opened you will see a group named for each project. When you create a
source fi le breakpoint in an open project, it ’ s added to its group. These breakpoints are saved (per
user) in the project document, so your breakpoints will persist between Xcode sessions.
The Global Breakpoints group contains breakpoints that are available to all projects. This is
particularly useful for complex symbolic breakpoints that you want to use in different projects.
Possibly, you could keep breakpoints in a common library that you use in several projects. Global
breakpoints are saved in your Xcode Preferences.
Breakpoint Details
The list in the details pane shows the breakpoints selected in the Groups & Files window, or all the
breakpoints contained in a selected group or groups. To limit the list of breakpoints to a particular
subset, select only that subgroup in the Groups & Files pane. To see all of the breakpoints defi ned,
select the top - level Breakpoints group.
Each breakpoint listed displays an icon, description, enabled check box, location, condition, and
continue option. By Right/Control - clicking the column header of the table you can optionally
choose to display the (normally hidden) Comments, Last Modifi ed, and Hit Count columns. You
may also hide columns that don ’ t interest you.
The icon indicates the type of the breakpoint. Source breakpoints have a source fi le icon, and
symbolic breakpoints have a 3D cube. Source breakpoints are described by the function name and
line number within the source fi le, shown in the Location column, where they are set. Symbolic
breakpoints are described by the symbol of the breakpoint address, possibly with a qualifi er to
distinguish between similar symbols. The location of a symbolic breakpoint is the library or module
where it resides.
FIGURE 18-19
c18.indd 467c18.indd 467 1/22/10 12:55:23 PM1/22/10 12:55:23 PM
Download at getcoolebook.com
468
❘
CHAPTER 18 DEBUGGING
The name or address of a symbolic breakpoint is editable — double - click the name to change the
symbol. Source breakpoints are not. Double - clicking a source breakpoint in the list jumps to that
location in the source fi le. This is the complement of double - clicking a breakpoint in a source fi le,
which jumps to that breakpoint in the breakpoint window.
The Comments column contains a text fi eld for recording your comments about, or a description
of, the breakpoint. If you have a lot of comments, open the Info window for the breakpoint and edit
the comments there. The Last Modifi ed fi eld records the last time the breakpoint was altered. The
Continue column is explained later in the “ Breakpoint Actions ” section, and the Condition fi eld is
explained in the “ Iffy Breakpoints ” section.
A breakpoint ’ s detail line can be expanded to display the its actions, described later in the
“ Breakpoint Actions ” section.
Breakpoint Details in an Editor Pane
You ’ ve seen breakpoints in editor panes more than a dozen times so far, but there ’ s a somewhat
obscure command for displaying some details about the breakpoint right in the editor pane, as
shown in Figure 18 - 20.
FIGURE 18-20
The View ➪ Message Bubbles ➪ Show Breakpoints command reveals breakpoint bubbles containing
some details about each breakpoint. This same command is accessible via the Right/Control - click
menu in the editor pane, also shown in Figure 18 - 20.
The enabled, auto - continue, and breakpoint condition can be edited right in the editor pane. This
can be particularly handy when using the mini - debugger.
Deleting Breakpoints
To delete one or more breakpoints in the breakpoints window, select the breakpoints in the window
and press the Delete key. You can also select a group of breakpoints in the Groups & Files pane and
choose the Delete command from the Right/Control - click contextual pop - up menu.
To delete a source breakpoint from within a source fi le editor, click and drag the breakpoint out
of the gutter. You can also Right/Control - click the breakpoint and choose the Remove Breakpoint
command.
c18.indd 468c18.indd 468 1/22/10 12:55:24 PM1/22/10 12:55:24 PM
Download at getcoolebook.com
Breakpoints
❘
469
Enabling and Disabling Breakpoints
The check mark column in the breakpoints list shows whether that breakpoint is enabled. You
can enable or disable an individual breakpoint by ticking its check box. This is synonymous with
clicking the breakpoint ’ s indicator in the source fi le. Enabled breakpoints are dark blue; disabled
breakpoints are light blue.
Selecting breakpoints in the Groups & Files pane lets you to enable and disable breakpoints
en masse. Select any combination of breakpoints and breakpoint groups in the Groups & Files
pane — these commands do not work in the details list. Right/Control - click one of the selected items
and choose either the Enable Breakpoints or the Disable Breakpoints command from the contextual
menu. Enabling or disabling a group sets the state of every breakpoint contained in that group.
Hold down the Option key and the Enable Breakpoints command turns into the Enable Only These
Breakpoints command. This command enables the selected breakpoints, and then disables all other
project breakpoints. This is a quick way of enabling a strategic group of breakpoints you want to
focus on while simultaneously disabling all others.
You may notice that some breakpoints display a – sign in their enabled check
box. These are enabled breakpoints that the debugger can ’ t set for some reason.
Examine the debugger console output (covered later) to fi nd out which
breakpoints are having problems. This is most commonly encountered with
symbolic breakpoints that the debugger can ’ t resolve. Beyond the obvious reason
that the symbol simply doesn ’ t exist in the application ’ s name space, it can also
happen when you ’ re using ZeroLink or lazily loaded libraries. These
technologies defer the loading and linking of functions until they are actually
called, which means that the code for many functions won ’ t be loaded into
memory when the program starts executing. Until the debugger can turn a
symbol name into an absolute memory address, it can ’ t set a breakpoint.
Creating Symbolic Breakpoints
To create a symbolic breakpoint, fi rst select the Breakpoints group in which you want the
breakpoint created. At the bottom of the details pane list is a special placeholder breakpoint with
a border around the name Double - Click For Symbol. To create a new symbolic breakpoint, do just
what it says, as shown in Figure 18 - 21.
FIGURE 18-21
c18.indd 469c18.indd 469 1/22/10 12:55:25 PM1/22/10 12:55:25 PM
Download at getcoolebook.com
470
❘
CHAPTER 18 DEBUGGING
The symbol can be any function name known to the linker. This can be a function in your own
application or any system API or library to which your application is linked. For C function calls,
just the name of the function is suffi cient. If there is any ambiguity, Xcode prompts you to choose
the specifi c symbol that you meant. In Figure 18 - 22, a breakpoint is set on the free symbol, and
Xcode wants to know which “ free ” it ’ s referring to.
FIGURE 18-22
Objective - C and C++ methods must be expressed in their complete form. To set a symbolic
breakpoint at the isPrime: method of the SieveOfEratosthenes class, create a breakpoint for
the - [SieveOfEratosthenes isPrime:] symbol. Note that the symbol must have a + or – sign
indicating a class or member method. In this example, : indicates that the method takes a single
parameter. Just like when you ’ re using the @selector operator, isPrime and isPrime: are two
different methods. If the method took a second BOOL parameter, the symbol would be something
like - [SieveOfEratosthenes isPrime:ignoringMap:] .
In C++, the symbol should be a complete, fully qualifi ed, prototype of the method. If the
NestOfBugs class contained a member function named catchMe that took a single integer as a
parameter, the symbol to use would be NestOfBugs::catchMe( int i ) . Unlike the Objective - C
symbol, the name of the parameter is included exactly as it was declared in the class statement. gdb
will not fi nd the function without a complete copy of its declaration. The return type of a function
is not part of its name.
Symbolic breakpoints do not appear as breakpoint indicators in the gutter of the source fi le
editor pane, even if the symbol identifi es a function in your source code. Other than the visual
differences, symbolic breakpoints are just like source breakpoints and share all of the same
capabilities and traits.
I y Breakpoints
One of the fi rst things you ’ ll notice about breakpoints is that they always work. Although it might
be gratifying to know that the technology is reliable, you may soon discover that it can be a curse
c18.indd 470c18.indd 470 1/22/10 12:55:31 PM1/22/10 12:55:31 PM
Download at getcoolebook.com
Breakpoints
❘
471
as well. Setting a breakpoint in a function that gets called a million times is enough to wear out the
button of any mouse if you have to click the Continue button 999,999 times. Furthermore, quite
often the problem with a loop will be found at the end, not the beginning. Placing a breakpoint in
the middle of a loop can be a study in tedium.
What you really want to do is break at the moment your application is doing something interesting
or suspicious. For example, you want to break a loop on its last iteration or just when a parameter
is
NULL .
You can accomplish this by using a breakpoint conditional. In the Condition fi eld of the breakpoint,
enter any C Boolean expression. If the breakpoint is enabled and the conditional expression
evaluates to true when the breakpoint is encountered, the breakpoint stops the program.
Otherwise, the breakpoint is ignored and the program continues to run.
Conditional Breakpoint Example
The best explanation is an example. The following function calculates a factorial:
static long long int factorial( long long int n )
{
if (n > =1)
n *= factorial(n-1);
return (n);
}
int main (int argc, const char * argv[])
{
printf("20! = %lld\n",factorial(20));
return 0;
}
You build and run the application, and it produces the following output in the debugging console
window:
20! = 0
Clearly, that ’ s not the correct answer. You suspect that the problem is when n is small, so you set a
breakpoint at the fi rst line of the factorial() function (the line if (n > =1) ). You start the program
under the control of the debugger, and it immediately stops in the factorial function. The variable n
has a value of 20.
You click Continue and the program recursively calls factorial again, causing the breakpoint to
stop again; this time n equals 19.
You can see where this is leading. You ’ ll have to restart the application another 18 times before you
get to a value of n that ’ s interesting. Though 18 isn ’ t so bad, 180 would be, and 18,000 would be
ridiculous in the extreme.
What you really want to know about is what happens when n is small (2 or less). To fi nd out, you
set a breakpoint condition, as shown in Figure 18 - 23. Now the breakpoint stops only when n is less
than or equal to 2.
c18.indd 471c18.indd 471 1/22/10 12:55:32 PM1/22/10 12:55:32 PM
Download at getcoolebook.com
472
❘
CHAPTER 18 DEBUGGING
With a single breakpoint condition, you ’ ve skipped to the 19th invocation of the factorial function
in a single debugging step. Now that you ’ re here, you use the Step Over and Step Into commands
to walk through the next few invocations of factorial and immediately see what the problem
is: When n is 1, the if condition is still true, factorial(n - 1) is called, which returns 0, and the
multiplication zeros out the total.
The solution is change the conditional to if (i > 1) .
Conditional Expressions
A breakpoint ’ s conditional expression can contain only primitive C statements. It can ’ t employ
preprocessor macros or make use of any variables beyond what appears in the variables pane.
In other words, it can only evaluate expressions based on what the debugger knows about your
program.
As an example, take the C variable char string[MAX_LEN] . Assuming MAX_LEN was 100, you could
test to see if the string buffer contained a character near the end of the array using the expression
string[98]!='\0 ' . However, you could not use the expression string[MAX_LEN - 2]!='\0 '
because the debugger doesn ’ t normally know about preprocessor macros.
If there is a problem with the expression, Xcode displays a warning symbol next to the condition
in the Breakpoints window. Sometimes this is normal, because an expression might refer to local
variables that aren ’ t in scope when the condition is defi ned. The debugger reevaluates the breakpoint
condition when the breakpoint actually occurs, but if the expression is still invalid, it is ignored and
the breakpoint acts as if it has no condition. The debugger also notes the problem with a message
in the debugger console like “ warning: Error parsing breakpoint condition expression. ”
FIGURE 18-23
c18.indd 472c18.indd 472 1/22/10 12:55:32 PM1/22/10 12:55:32 PM
Download at getcoolebook.com
Breakpoints
❘
473
Be very careful about expression side effects. The expression i==0 activates
the breakpoint when the value of
i is zero, and ignores the breakpoint if it is
any other value. The expression
i=0 sets the value of i to zero and continues
executing. Assignment, increment, and decrement operations all have their
normal effect on values. Be careful of expressions like
o[++k]!=NULL that alter
the value of
k when the debugger evaluates them. The equivalent expression
without side effects would be
o[k+1]!=NULL .
Be conservative and defensive when you ’ re using expressions. Don ’ t make assumptions that will
cause your expression to miss problems, or cause more problems itself. The following table describes
a few examples:
EXPRESSION RESULTS
i > 1000000
Poor. The variable is a signed integer. If the value exceeds
MAX_INT , the value will be negative and the condition will
never be true. If you ’ re looking for a problem where this integer
exceeds its nominal range of 0 to 1,000,000, this expression
could miss it.
!(i > =0 & & i < =1000000)
Better. The range of the integer is bounded at both ends.
ptr - > m!=0
Poor. ptr is a pointer that could be NULL , causing the expression
evaluation itself to throw an address error.
(ptr!=0 & & ptr - > m!=0)
Better. The member value m will not be tested if the ptr is NULL ,
avoiding possible access errors.
(ptr==0 || ptr - > m!=0)
Best. If you really never expect ptr to be NULL , the breakpoint
should break on that condition as well.
If your condition requires something to be computed, consider adding some code to your application
to help your debugging. Here ’ s an example that assumes that you have defi ned a DEBUGGING macro
and set it to a non - zero value when compiling your code for testing:
#if DEBUGGING
int actualStrLen = strlen(str);
#endif
strncpy(buffer,str,1024);
You can now set a breakpoint at the strncpy statement with the condition actualStrLen > =1024 .
Breakpoint Ignore Count
A common breakpoint condition is to simply ignore the next few hits. If you hit a breakpoint in
a loop that ’ s going to repeat 1,000 times and you want to know what happens toward the end of
the loop, you just want to skip over the next 998 occurrences of that breakpoint. This is easily
accomplished by setting a breakpoint ’ s ignore count setting.
In the breakpoint window, fi nd the Ignore Count column for the breakpoint and enter a non - zero
integer. The next occurrences of that breakpoint will be ignored. To reactive the breakpoint, set the
ignore count back to zero.
c18.indd 473c18.indd 473 1/22/10 12:55:33 PM1/22/10 12:55:33 PM
Download at getcoolebook.com
474
❘
CHAPTER 18 DEBUGGING
Breakpoint Actions
In addition to just stopping the program, breakpoints can also perform actions when they are
encountered. When a breakpoint is taken, the program stops and control is passed to the debugger.
If the breakpoint has breakpoint actions, the debugger immediately performs those actions.
To add or edit actions, expose the breakpoint ’ s contents in the Breakpoints window. For source
breakpoints, double - click the breakpoint in the gutter of the source fi le and Xcode takes you to that
breakpoint in the Breakpoints window. Click the + button to add a new action. Click the – button
to delete an action. You can ’ t reorder actions, so when you ’ re adding actions, use the + button above
the point where you want to new action inserted.
After you ’ ve added an action, choose the type of action from the pop - up menu at the top. There are
fi ve kinds of breakpoint actions, as listed in the following table:
ACTION FUNCTION
Log Logs a message to the system console.
Sound Plays a sound.
Debugger Command Executes a command in the debugger.
Shell Command Executes a shell command.
AppleScript Executes an AppleScript.
Log a Message
The Log command enables you to generate a message when the breakpoint occurs. How you receive
this message is controlled by the two check boxes in the lower - right corner of the action, shown in
Figure 18 - 24. Log outputs the message to the debugger console, and Speak uses the Macintosh text -
to - speech technology to say the message out loud.
FIGURE 18-24
c18.indd 474c18.indd 474 1/22/10 12:55:38 PM1/22/10 12:55:38 PM
Download at getcoolebook.com
Breakpoints
❘
475
The message can contain any of the following special character sequences:
MESSAGE TOKEN REPLACED WITH
%B The name of the breakpoint
%H The number of times this breakpoint has been tripped
%C The comments attached to the breakpoint
@ expression @ Any gdb expression
The open - ended @ expression @ form permits you to include anything that the debugger can
evaluate at that moment in the program. The example in Figure 18 - 24 shows a breakpoint that logs
the following message:
testTimer fired, userInfo has 3 entries
The expression [[timer userInfo] count] is executed and the resulting value is inserted into the
log message. Again, be very careful of side - effects when using expressions.
Make a Sound
The Sound action plays the system sound selected from the pop - up menu.
Have the Debugger Do Something Else
The Debugger Command action is where the power of breakpoint actions really begins to reveal
itself. This action enables a breakpoint to execute almost any other gdb command. There ’ s a lot of
potential here, but some all - time favorites are the print , backtrace , and breakpoint commands.
Two gdb commands that you should never use in a breakpoint action are jump
and
continue . Using jump or continue can interfere with Xcode ’ s ability to
execute other breakpoint actions. See the “ Breakpoint Continuation ” section for
information about the action you want your program to continue after hitting a
breakpoint.
The print command prints the value of an expression to the debugger console, similar to the Log
action. The backtrace command dumps a summary of the call stack.
The log action and the print and backtrace commands are extremely useful, to be sure, but
they ’ re all relatively passive. Executing gdb commands automatically opens up a universe of
possibilities — or Pandora ’ s box, if you ’ re not careful.
The power of debugger command actions can be illustrated using breakpoints that create and clear
other breakpoints. One common problem is trying to debug the behavior of a function when it ’ s
called under specifi c circumstances; circumstances that can ’ t be easily described in a breakpoint
conditional. This kind of situation occurs often in complex object - oriented applications where
seemingly innocuous methods get called under unusual situations, or at unexpected times. The
reason these problems are so diffi cult to isolate is that the function encountering the problem might
c18.indd 475c18.indd 475 1/22/10 12:55:39 PM1/22/10 12:55:39 PM
Download at getcoolebook.com
476
❘
CHAPTER 18 DEBUGGING
be called hundreds, if not millions, of times under normal conditions where the problem doesn ’ t
manifest itself; so simply setting a breakpoint at the problematic method is out of the question.
The following example illustrates this kind of puzzle. You ’ re developing an iPhone application with
a custom view defi ned in a nib document. You create many instances of this view, confi gure it via a
- setValues: message, display it, and then discard it.
1 @interface QuickView : UIView {
2 //
3 }
4 - (void)setValues:(id)info;
5 @end
6
7 @implementation QuickView
8
9
10
11 - (void)setValues:(id)info
12 {
13 // Configure view to display values
14 }
15
16 @end
So far, so good. While analyzing the performance of your app, you discover that loading every new
view from the nib document is taking too much time. You would get better performance if you
loaded a few of these view objects from the nib document, and then reused them again later, so you
create a simple pool of view objects:
1 @class QuickView;
2
3 @interface ViewPool : NSObject {
4 @private
5 NSMutableArray *pool;
6 }
7 - (QuickView*)view;
8 - (void)recycleView:(QuickView*)view;
9 @end
10
11 @implementation ViewPool
12
13 - (QuickView*)view
14 {
15 // Return an existing view from the pool, or load a new one.
16 QuickView *freshView;
17 if ([pool count]!=0) {
18 freshView = [[[pool lastObject] retain] autorelease];
19 [pool removeLastObject];
20 } else {
21 // Load the NIB and extract the single top-level object
22 freshView = [[[NSBundle mainBundle] loadNibNamed:@"QuickView"
23 owner:nil
24 options:nil]
25 lastObject];
26 }
c18.indd 476c18.indd 476 1/22/10 12:55:42 PM1/22/10 12:55:42 PM
Download at getcoolebook.com
Breakpoints
❘
477
27 return (freshView);
28 }
29
30 - (void)recycleView:(QuickView*)staleView
31 {
32 [pool addObject:staleView];
33 }
34
35 @end
While testing your program, you discover a problem. The correct order of use should be:
1. Create a bunch of QuickView objects.
2. Confi gure their content using - setValues: .
3. Display the views.
4. Return all of the views to the pool.
What ’ s happening in your application is that something is calling - setValues:
after the view
has been returned to the pool. You suspect that some object is still trying to use the view after it has
been recycled, but you can ’ t determine when or why.
This kind of problem can be trapped using breakpoints and breakpoint actions:
1. Create two breakpoints in ViewPool.m at lines 27 and 32.
2. Add a breakpoint action to the breakpoint at line 32. Set the action type to Debugger
Command, and enter the following gdb command:
break QuickView.m:13
3. Add a breakpoint action to the breakpoint at line 27. Set the action type to Debugger
Command, and enter the following gdb command:
clear QuickView.m:13
4. Build and start the program under the control of the debugger.
Your program runs normally until a QuickView object receives a - setValues: message between
being returned to the pool, but before being pulled out again. The sender is the likely culprit.
Here ’ s how the solution works: the breakpoint action in the - recycleView: method creates a
breakpoint in the - setValues: method. If any code should invoke - setValues: after one or more
view objects have been returned to the pool, the program will stop. Once new view objects are
requested again, it ’ s assumed that - setValues: messages are acceptable again, so the breakpoint in
the - view method clears (deletes) the - setValues: breakpoint. The result is a breakpoint that only
exists between calls to - recycleView: and - view: .
The one annoying aspect of this solution that the breakpoints in - view and - recycleView: still
stop execution of your application. The solution to that is to set their continue fl ag, described later
in the “ Breakpoint Continuation ” section.
Note that the automatically created breakpoints may not appear in Xcode because Xcode didn ’ t
create them; but they ’ re fully functional breakpoints nevertheless. Using the debugger command
action requires an understanding of the gdb debugger commands and their syntax. Documentation
for the gdb debugger is available online at .
c18.indd 477c18.indd 477 1/22/10 12:55:43 PM1/22/10 12:55:43 PM
Download at getcoolebook.com
478
❘
CHAPTER 18 DEBUGGING
Run a Script
The Shell Command and AppleScript breakpoint actions can be used to execute any arbitrary
command - line program or AppleScript program fi le.
The usefulness of these actions depends entirely on what you ’ re trying to accomplish. Say you have
a database program that is corrupting record data. You could create a breakpoint action to execute a
MySQL query statement that would dump the contents of suspect records at strategic points in the
program. Another clever trick is to use Mac OS X ’ s screen capture tool ( screencapture ) to take a
snapshot of your display at a critical moment.
The Shell Command action takes a command fi le and a list of arguments. This must be an
executable command fi le — a binary program or an executable script. You can enter the path
directly, or click the Choose button to browse for it. The path can be an absolute or project - relative
path. Arguments are space - separated, just as if you executed the command using the shell, and you
can include gdb expressions enclosed between two
@ characters just like the Log action. Normally,
the debugger executes the command asynchronously. That is, it starts the command executing and
immediately returns control to the debugger. If you want the debugger to wait until the command is
fi nished before continuing, check the Wait Until Done option.
The AppleScript action accepts an AppleScript in the action pane. The script does not need to be in a
handler block. You can compile your script and check for syntax errors using the Compile button and
try out your script using the Test button. The AppleScript executes in the context of the
gdb process,
so interactive AppleScript commands like display can ’ t be used. Commands like delay , beep , and
say work just fi ne. The script can also contain gdb expressions enclosed between @ characters.
Breakpoint Continuation
The earlier example of using breakpoints to set breakpoints glossed over a serious problem. The
breakpoints with the actions will still break. After the breakpoint has been hit, and all of its
actions have been executed, the debugger still stops your program and waits for instructions. In
the example of trying to trap a call that occurs during a destructor, this defeats the purpose of
having breakpoints created and deleted automatically. What you really want is for the breakpoint
to execute its actions and immediately resume execution of your program. This is exactly what the
continue option does.
The continue option is the CD - player - style “ play ” column in the breakpoints list, as shown in
Figure 18 - 25. Checking this option for a breakpoint means that the breakpoint does not return
control to you. The actions of the breakpoint are executed, and the program continues executing
exactly as if you had clicked the Continue button.
FIGURE 18-25
c18.indd 478c18.indd 478 1/22/10 12:55:44 PM1/22/10 12:55:44 PM
Download at getcoolebook.com
Breakpoints
❘
479
The continue option makes all manner of debug automation and checking possible. There are,
however, some hazards. Debug actions are executed asynchronously. That is, the debug action
merely starts the action. The debugger does not normally hang around waiting for them to
complete, so be careful about creating breakpoints that will start, or queue up, hundreds of
breakpoint actions. This can be particularly annoying when you ’ re using audio feedback.
The Shell Script breakpoint action has the Wait Until Done option that suspends the debugger
and your program until the Shell Command completes. Breakpoint actions can be combined with
a breakpoint condition. The breakpoint and all of its actions are executed only if the condition
evaluates to
true .
Importing and Exporting Breakpoints
Pretend that you are working on a project with another programmer. You ’ ve isolated a problem
using a complex set of breakpoints. How do you send those breakpoints to your team members so
that they can reproduce the problem and fi x it? Project breakpoints are saved on a per - user basis
in the project, so you can ’ t just give them a copy of the project document. When they load the project,
they won ’ t see any of the project breakpoints you ’ ve set. And scrawling breakpoint descriptions on
napkins doesn ’ t sound particularly effi cient either.
The solution is to export the breakpoints to a fi le using the Export Breakpoints command. Select
any set of breakpoints or breakpoint groups in the Groups & Files pane and Right/Control - click the
selection. Choose the Export Breakpoints command to export the selected breakpoints to a text fi le.
The Import Breakpoints command creates a new subgroup with the name of the breakpoint export
fi le and populates it with its contents. Rename and reorganize the imported breakpoints as you see fi t.
As a single developer, you can use these commands to archive a collection of breakpoints for some
future purpose or move some breakpoints between projects without resorting to making them
global breakpoints.
Breakpoint Templates
Xcode provides a number of preconfi gured breakpoints that you can insert by Right/
Control - clicking a line in your source code and then selecting any of the breakpoint templates from
the Built - In Breakpoints menu. You can also create your own breakpoint templates, which will
appear in the same menu.
To create a reusable breakpoint, create and confi gure a breakpoint. Once you are happy with it,
create a breakpoint group in the Groups & Files pane named Template Breakpoints (Right/Control -
click and choose Add ➪ New Group). This group can be a subgroup of your project breakpoints or
the global breakpoints. You can even have both. Now drag the breakpoints you want to reuse into
this group.
Any breakpoints that appear in the Template Breakpoints group also appear in the Right/
Control - click contextual menu in any source fi le ’ s gutter. Creating a breakpoint from one of the
templates inserts a breakpoint that ’ s a copy of the breakpoint in the template. The only thing that is
different is its location.
c18.indd 479c18.indd 479 1/22/10 12:55:44 PM1/22/10 12:55:44 PM
Download at getcoolebook.com
480
❘
CHAPTER 18 DEBUGGING
EXAMINING DATA
Now that you ’ ve learned all about controlling the fl ow of your application while debugging, let ’ s
return to examining the content of variables. “ The Variables Pane ” section briefl y introduced the
variables pane of the debugging window. Now look at that pane in a little more detail and look at
other ways of examining the contents of memory.
To recap, the variables pane (previously shown in Figure 18 - 4) displays the known variables within
the scope of the selected stack frame. Variables are grouped by type. Structures and objects appear
as groups, forming a hierarchy of containers and values. These are described by the debug symbol
information attached to your program.
As you step through your program, the debugger compares the values that were displayed when
your program was last started against the values that appear when the debugger stopped it again.
Any values that are different are highlighted in red, as shown in Figure 18 - 26 — it may be diffi cult
to see in this black - and - white illustration, but the value of variable
j is red.
FIGURE 18-26
The code was stopped at line 57 where the value of j was undefi ned. The Step Over command was
issued. The debugger allowed one statement (the for statement) to be executed and stopped the
program again. The value of j is now 4 and Xcode highlights the change in the display. Using the Step
Over command again returns the value to black again, because that statement did not alter its value.
It doesn ’ t matter how much the program executes between stops. As long as the variables pane is
showing the same set of variables at the next stop, Xcode highlights whatever values are now different.
Scalar Formats
The Value column displays the primitive value of each variable. For scalar values, this is a numeric
value. For structures and pointers to structures, it is the address of the structure or the value of the
pointer. The default display format for scalar values is Natural. For signed integers and fl oating -
point numbers, the column displays a signed decimal value. Unsigned integers display an unsigned
c18.indd 480c18.indd 480 1/22/10 12:55:45 PM1/22/10 12:55:45 PM
Download at getcoolebook.com