Data Mining and Knowledge Discovery Handbook, 2 Edition part 128 pps
Bạn đang xem bản rút gọn của tài liệu. Xem và tải ngay bản đầy đủ của tài liệu tại đây (1.68 MB, 10 trang )
1250 Qingyu Zhang and Richard S. Segall
Fig. 65.4. Link Diagram for
each of the 40 soil types using
PolyAnalyst 5.0
Fig. 65.5. Bin selection rule for
the forest cover type data using
PolyAnalyst 5.0
Fig. 65.6. Workspace of SAS
Enterprise Miner for human lung
project
Figure 6 shows the workspace of SAS Enterprise Miner that was used in the data mining
of the human lung dataset. Figure 7 shows a partial view of the decision tree diagram obtained
by data mining using SAS Enterprise Miner as specified for a depth of 6 from the initial node
of NL279. Figure 8 shows a 2x3 Self-Organized Maps (SOM) that provides results in the form
65 Commercial Data Mining Software 1251
Fig. 65.7. Decision Tree for
specified depth of 6 from Node
ID=1
Fig. 65.8. SOM two-dimensional
cluster proximities for the forest
cover data
of an interactive map that illustrates the characteristics of the clusters and importance of each
variable. Especially it shows the normalized means for the clusters of the variables and cluster
proximities respectively. Figure 8 shows that the normalized means for the cluster proximities
of the gene type variables are scattered and not uniform.
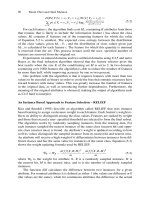
65.3.4 PASW Modeler/ Formerly SPSS Clementine
PASW (Predictive Analytics Software) Modeler (formerly Clementine) makes it easy to dis-
cover insights in your data with a simple graphical interface. The PASW base model per-
forms decision lists, factor and principle component analysis, linear regression, CHAID (Chi-
squared Automatic Interaction Detector) which is one of the oldest tree classification meth-
ods. Add-on modules to the PASW base model are available for neural networks, time series
forecast models, clustering, and sequential association algorithm, binomial and multinomial
logistic regression, and anomaly detection.
Some of the key features of PASW Modeler include the ability to incorporate all types of
data including structured (tabular), unstructured (textual), web site, and survey data. PASW
Modeler has several data-cleaning options and also visual link analysis for revealing meaning-
ful association in the data.
1252 Qingyu Zhang and Richard S. Segall
PASW Modeler is able to perform data mining within existing databases and score mil-
lions of records in a matter of minutes without additional hardware requirements. Through
multithreading, clustering, embedded algorithms, and other techniques, the user of PASW
Modeler can conserve resources and control information technology costs while delivering
results faster. PASW Modeler offers many features that provide faster and greater return on
your analytical investment. Automated modeling, for example, helps you quickly identify the
best performing models and combine multiple predictions for the most accurate results (SPSS
2009a).
Figure 9 shows the workspace of PASW Modeler with the result file that can be written to a
database, an Excel spreadsheet, or other. Figure 10 is a screen of PASW Modeler for selection
of the fields to be included and excluded for the cluster analysis. Figure 11 is a screen of
PASW Modeler where on the left is the available clusters for selection for performing cluster
comparisons as shown on the right.
Fig. 65.9. Workspace of PASW
Modeler (SPSS 2009a)
Fig. 65.10. Screen of PASW
Modeler for selection of the
fields to be included and ex-
cluded for the cluster analysis
(SPSS 2009b)
65.3.5 IBM DB2 Intelligent Miner
IBM DB2 Intelligent Miner for Data performs mining functions against traditional DB2 databases
or flat files. IBM’s data mining capabilities help you detect fraud, segment your customers, and
65 Commercial Data Mining Software 1253
Fig. 65.11. Screen of PASW
Modeler where on the left are the
available clusters for selection
for performing Cluster com-
parisons as shown on the right.
(SPSS 2009b)
simplify market basket analysis. IBM’s in-database mining capabilities integrate with your ex-
isting systems to provide scalable, high performing predictive analysis without moving your
data into proprietary data mining platforms. It also has capabilities to access data in other re-
Fig. 65.12. The Graphics View
of the Clustering Visualize (IBM
2004)
Fig. 65.13. The Tree Node Dis-
tribution View of the Classifica-
tion Visualizer (IBM 2004)
lational Database Management Systems (DBMSs) using ODBC (Open Database Connectivity
Standard). IBM Intelligent Miner performs functions of association rules, clustering, predic-
1254 Qingyu Zhang and Richard S. Segall
tion, sequential patterns, and time series. IBM Intelligent Miner for Text performs mining
activities against textual data, including e-mail and Web pages.
In April 2008, IBM D2 Intellgent Miner was replaced with IBM InfoSphere Warehouse
9.7 that incorporates Intelligent Miner Modeling and Text Analytics within the Departmental
and Enterprise full versions.
Figure 12 shows the graphics view for an overview of the relevant clusters, their size,
and their fields. Each row in the table of Figure 12 describes one cluster by showing how
the field values are distributed for the records in this cluster. Figure 13 shows the Tree Node
Distribution View that includes the tree, the appending node IDs, and the distribution of field
values in the nodes.
65.4 Supercomputing Data Mining Software
Table 65.2. Supercomputing Data Mining Software
Features Avizo JMP
Data Data Import x x
Acquisition Image segmentation x x
Slicing and clipping x
Analyze large microarrays x
Surface rendering x x
Volume rendering x x
Data Scaler and vector visualization x x
Analysis Molecular data support x x
Matlab bridge x
Geometric models x x
Surface reconstruction x x
Geometric models x x
Results Visual presentation x x
Reporting Scripting x
Unique features Special editions
for Avizo earth,
wind, fire,
green
For genetic
data
Supercomputing data mining is used for highly calculation intensive tasks such as prob-
lems involving quantum mechanical physics, weather forecasting, molecular modeling, and
physical simulations. The selected software for supercomputing are Avizo by Visualization
Science Group and JMP Genomics from SAS Institute. Shown in Table 2, Avizo is a general
supercomputing software with unique editions specifically for earth, wind, fire, and environ-
mental data while JMP Genomics is specialized specifically for genetic data.
65.4.1 Data Visualization using Avizo
Avizo software is a powerful, multifaceted tool for visualizing, manipulating, and understand-
ing scientific and industrial data. Wherever three-dimensional datasets need to be processed,
65 Commercial Data Mining Software 1255
Avizo offers a comprehensive feature set within an intuitive workflow and easy-to-use graph-
ical user interface (VSG, 2009).
Fig. 65.14. Four views of a
human skull in single screen of
3D visualization by Avizo
Fig. 65.15. Avizo workspace
for the 3D visualization of a
motor in a front view
Fig. 65.16. The atomic struc-
ture of 14 atoms having 13
bonds and 1 residue
1256 Qingyu Zhang and Richard S. Segall
Fig. 65.17. 3-D Visualization of
Molecular structure using Avizo
with oblique slice
Fig. 65.18. The airflow around a
wing component such as found
on aircraft
Some of the core features of Avizo include advanced 3D visualization by surface and vol-
ume rendering, scientific visualization of flow data and processing very large datasets at inter-
active speed, and 3D data exploration and analysis by displaying single or multiple datasets
in a single or multiple viewer window, and navigate freely or around or through these objects.
Avizo can also perform 3D reconstruction by employing innovative and robust algorithms
from image processing and computational geometry to reconstruct high resolution 3D images
generated by CT or MRI scanners, 3D ultrasonic devices, or confocal microscopes (VSG,
2009).
Avizo software is used for supercomputing data mining as shown in this paper using the
standard edition. Figure 14 shows four views of 3D visualization of a human skull in single
screen by Avizo. Figure 15 show Avizo workspace for the 3D visualization of a component of
a motor in a front view. Figure 16 shows the atomic structure of 14 atoms having 13 bonds and
1 residue. Fig. 17 shows 3-D Visualization of Molecular structure using Avizo with oblique
slice. Figure 18 shows the airflow around a wing component such as found on aircraft or other.
65.4.2 Data Visualization using JMP Genomics
JMP Genomics is statistical discovery software that can uncover meaningful patterns in high
throughput genomics and proteomics data. JMP Genomics is designed for biologists, biostatis-
ticians, statistical geneticists, and those engaged in analyzing the vast stores of data that are
common in genomic research (SAS, 2009).
65 Commercial Data Mining Software 1257
Fig. 65.19. Correlation of 5
principal components with
respective scatterplot matrices
Fig. 65.20. 3D scatterplot of 2
principle components
Fig. 65.21. Model accuracy
comparison for each cross-
validated model
Using data of characteristics for patients diagnosed with adenocarcinoma cancer, Figure
19 shows correlation analysis of 5 principal components for correlations with their respective
scatterplot matrices presented by grouping by columns. Fig. 20 shows 3D scatterplot of 2
principle components. Figure 21 shows model accuracy comparison for each cross-validated
model after 50 iterations for the dependent variable of grade. Figure 22 shows almost equal
distributions of data type for training data for “true
grade” variable, with the corresponding
actual probabilities, quartiles, and correct prediction frequencies. Figure 22 also shows the
1258 Qingyu Zhang and Richard S. Segall
Fig. 65.22. Distributions of
data type for training data for
“true
grade” variable
Fig. 65.23. Heat map and
dendogram
contingency analysis of predicted class by grade
true data type of training as shown in the
mosaic plot and contingency table. Figure 23 shows a complete heat map and dendrogram.
65.5 Text Mining Software
Some of the popular software currently available for text mining include SAS Text Miner
and Megaputer PolyAnalyst. Both software provide a variety of graphical views and analysis
tools with powerful capabilities to discover knowledge from text databases (shown in Table
3). The main focus here is to compare, discuss, and provide sample output for each as visual
comparisons. As a visual comparison of the features for both selected text mining software,
the authors of this chapter constructed Table 3, where essential functions are indicated as being
either present or absent with regard to data preparation, data analysis, results reporting, and
unique features. As Table 3 shows, both Megaputer PolyAnalyst and SAS Text Miner have
extensive text mining capabilities.
65.5.1 SAS Text Miner
SAS Text Miner is actually an “add-on” to SAS Enterprise Miner with the inclusion of an ex-
tra icon in the “Explore” section of the tool bar (Woodfield, 2004). SAS Text Miner performs
65 Commercial Data Mining Software 1259
Table 65.3. Text Mining Software
Features SAS Text
Miner
Megaputer
PolyAna-
lyst
Data Text parsing and extraction x x
Preparation Define dictionary x
Preparation Automatic Text Cleaning x
Categorization x
Filtering x
Data Concept Linking x x
Analysis Text Clustering x x
Dimension reduction techniques x x
Results Interactive Results Window x x
Reporting Support for multiple languages x x
simple statistical analysis, exploratory analysis of textual data, clustering, and predictive mod-
eling of textual data.
Fig. 65.24. Workspace of SAS
Text Miner for Animal Text
Fig. 65.25. Interactive Window
of SAS Text Miner for Animal
Text