Encyclopedia of Global Resources part 32 pdf
Bạn đang xem bản rút gọn của tài liệu. Xem và tải ngay bản đầy đủ của tài liệu tại đây (230.55 KB, 10 trang )
their forests, their consumption patterns have led to
the continuing deforestation of the tropics.
Impact of Deforestation
Deforestation has several directly observable impacts
on and long-term consequences for the environment.
Clearing of forests without suitable replanting de-
creases timber supplies, often leads to potential deg-
radation of the soil and water, reduces species diver-
sity,andmaycontributetolong-term climatic change.
In addition there are often negative impacts on indig-
enous populations who are forced to move or subsist
on substandard land.
Because of reforestation projects, forest cover in
the United States and Western Europe began growing
in 1990, in spite of population pressure. However, in
the tropics, the rate of deforestation began accelerat-
ing in 1990. The United Nations Food and Agricul-
ture Organization reports that Brazil, for example,
lost 423,033 square kilometers of Amazonian forest
(roughly the size of California) from 1990 to 2005. Al-
though the rate of decrease had slowed dramatically
by 2007, the deforestation rate in Amazonia increased
by 3.8 percent from August, 2007, to July,2008,as Bra-
zil deforested 11,968 square kilometers of the area.
Although Brazil has deforested the most land, other
tropical countries also have deforested large areas,
most notably Indonesia, Sudan, Burma, Côte d’Ivoire,
and the Democratic Republic of the Congo. Total
area deforested is one means of measuring deforesta-
tion; another is percentage of forested land cleared.
Because Brazil has such a large total of forested land,
its situation does not appear as bad by this measure.
Eighteen tropicalcountriescleared atleast20percent
of their forests between 1990 and 2005. Comoros, an
island nation near Madagascar, cleared 60 percent of
its forests during the period; Burundi cleared 47 per-
cent of its forests; and Togo, Mauritania, and Hondu-
ras also cleared significant forestland during this pe-
riod. Haiti and Madagascar had cleared much of their
forestland before 1990 but continued to clear what lit-
tle forested land remained. The countries with high
rates of deforestation have cleared land for a combi-
nation of reasons, including selling the wood prod-
ucts to foreign firms and producing more land for ag-
riculture.
Much of the logging of the past was carried out
without any regard to the availability of future timber
supplies, andthisremains thecaseinareas suchas Ma
-
laysia. Mostrecent commercial loggingoperationsen
-
gage in clear-cutting of an area rather than selective
cutting of some trees.
When trees are replanted and allowed to mature in
clear-cut areas, it is possible to achieve a sustainable
yield. However, the original forest often consisted of a
variety of trees, while newly planted forests generally
consist ofonlyone or two typesof trees, oftenpines.In
areas in which no replanting is done after the timber
is harvested, a variety of negative impacts occur, such
as erosion and the subsequent silting up of neighbor-
ing streams.
Some cleared forestland remains suitable for agri-
culture for a long period of time. Tropical rain forest
land, however, is not always suitable for agriculture.
Once exposed to the direct impact of rain and sun-
light, this land quickly becomes degraded through
erosion, oxidation, and laterization. After only a few
years of agricultural productivity, the former rain for-
est land is often abandoned with scant hope of regen-
eration.
Forested land slows runoff from rains, preventing
erosion and floods downstream. When tropical rain
forests are cleared, runoff increases, leading to pollu-
tion of streams and, eventually,to the silting up of res-
ervoirs downstream and the loss of topsoil. This pro-
cess spreads the impact of deforestation to areas that
are notdirectly affected bythe forest clearingandmay
create substantialcostsas the useful lifeofreservoirs is
reduced.
The impact of forest clearing on species diversity is
twofold. Even when forests are replanted by commer-
cial loggers they are generally monoculture forests
with onlyonespecies of tree,reducing local species di-
versity. Clear-cutting, in particular, often forces some
animals and birds to migrate from the area, often not
to return. Estimates indicate that the 7 percent of the
Earth’s surface that is covered by tropical rain forests
is home to 47 percent of the Earth’s species of ani-
mals, plants, and other organisms. The dramatic de-
forestation oftropical rain forests that occurred in the
late twentieth century has caused some species to be
destroyed even before they have been cataloged. This
reduction in species diversity through direct destruc-
tion or the loss of habitat may lead to the loss of vari-
ous organisms of great value.
The impact of global deforestation in producing
climate change is gradually becoming known. A vari-
ety of studies indicate that deforestation can have a
substantial long-term regional and global impact in
increasing carbon dioxide and methane, two green
-
280 • Deforestation Global Resources
house gases. Some researchers indicate that dimin
-
ished biomass leads to a decrease in the absorption of
carbon dioxide and resulting global warming. In ad-
dition, deforestation can lead to greater climatic ex-
tremes within a particular region. Brazil, which is not
an industrial country, is now viewed as the fourth larg-
est contributor to global warming because of the im-
pact of deforestation, especially in terms of forest fires
that occur when timber is cut in some areas.
In some tropical countries the indigenous forest
populations have come under intense pressure from
companies and individuals who want to clear the for-
ests for profit. The situation is most troubling in the
Amazon basin in Brazil, where native people such as
the Bororo have been attacked and killed in efforts
to forcethem out of theforest so thatitcan be cleared.
In other areas native people may not be attacked but
are forced to subsist without their usual habitat or
move elsewhere. Although the Brazilian government
has taken some measures to alleviate the abuses in
Amazonia, timber cutters still threaten the native
people.
Prospects for the Future
Many of the industrialized nations are no longer
clearing forestland for agriculture and engage in con-
trolled harvesting of timber so that sustainable yields
can be achieved. In some cases, for example in the
eastern United States, substantial reforestation began
occurring in the early twentieth century. Neverthe-
less, threats to the forests of industrialized countries
remain, most notably through acid precipitation,
which has caused substantial damage to forests, such
as Germany’s Black Forest, in some regions.
In developing countries, particularly those with
tropical forests,deforestation is a significant problem.
In some cases the rates of deforestation are continu-
ing to increase. Without efforts to deal with popula-
tion and economic pressures, slowing the rate of for-
est loss will be difficult. Some developing countries
are trying to preserve their forests as future reserves
or as present economic assets by having them serve as
attractions for foreign tourists. Costa Rica, for exam-
ple, has lost much of its forest but has instituted a pro-
gram of setting aside extensive forest reserves as a
method of preservation. Designating parkland is not
always effective, however. In some countries, people,
often driven by poverty, continue to cut timber in
parks. An example of this behavior has occurred in
the Bom Futuro National Reserve in Brazil, which lost
nearly one-quarter of its forest cover (64,800 hect
-
ares) from 2002 to 2007.
Some international environmental groups have of-
fered economic incentives to developing nations to
preserve their forests. The Nature Conservancy, for
example, engages in a program of buying up parts of a
nation’s debt in return for guarantees that the coun-
try will preserve some of its forests. The Brazilian gov-
ernment is taking measures to strengthen local land
ownership rules, setting aside forest reserves and lim-
iting tax credits for firms that do not comply with envi-
ronmental rules governing deforestation. However,
overcoming local logging that is driven by economic
necessity is difficult. Selective logging is used in Bo-
livia so that local communities can achieve some eco-
nomic gain and preserve large forest tracts rather
than indigenous people having to sell large tracts to
timber companies to raise money. Elsewhere, govern-
ments continue to pursue economic development at
all costs, leading to further deforestation. Extensive
work by all nations working together to prevent fur-
ther deforestation is necessary.
John M. Theilmann
Further Reading
Benhin, James K. A. “Agriculture and Deforestation
in the Tropics: A Critical, Theoretical, and Empiri-
cal Review.”Ambio 35,no.1 (February,2006):9-16.
Chew, Sing C. World Ecological Degradation: Accumula-
tion, Urbanization, and Deforestation, 3000 B.C A.D.
2000. Walnut Creek, Calif.: AltaMira Press, 2001.
Geist, Helmut J., and Eric F. Lambin. “Proximate
Causes and Underlying Driving Forces of Tropical
Deforestation.” BioScience 52, no. 2 (2002): 143-
150.
Humphreys, David. Logjam: Deforestation and the Crisis
of Global Governance. London: Earthscan, 2006.
Jensen, Derrick, and George Draffan. Strangely Like
War: The Global Assault on Forests. White River Junc-
tion, Vt.: Chelsea Green, 2003.
Laarman, Jan G., and Roger A. Sedjo. Global Forests: Is-
sues for Six Billion People. New York: McGraw-Hill,
1992.
May, Elizabeth. At the Cutting Edge: The Crisis in Can-
ada’s Forests. Rev. ed. Toronto: Key Porter Books,
2005.
Moran, Emilio F., and Elinor Ostrom, eds. Seeing the
Forest and the Trees: Human-Environment Interactions
in Forest Ecosystems. Cambridge, Mass.: MIT Press,
2005.
Global Resources Deforestation • 281
Nagendra, Harini. “Do Parks Work? Impact of Pro
-
tected Areas on Land Cover Clearing.” Ambio 37,
no. 5 (July, 2008): 330-337.
Palo, Matti, and Heidi Vanhanen, eds. World Forests
from Deforestation to Transition? Boston: Kluwer Aca-
demic, 2000.
Raven, Peter H., Linda R. Berg, and David M. Has-
senzahl. Environment. 6th ed. Hoboken, N.J.: Wiley,
2008.
Russell, Emily Wyndham Barnett. People and the Land
Through Time. New Haven: Yale University Press,
1997.
Vajpeyi, Dhirendrea K., ed. Deforestation, Environment,
and Sustainable Development: A Comparative Analysis.
Westport, Conn.: Praeger, 2001.
Williams, Michael. Deforesting the Earth: From Prehistory
to Global Crisis. Chicago: University of Chicago
Press, 2003.
Woodwell, George M. Forests in a Full World. New Ha-
ven: Yale University Press, 2001.
See also: Acid precipitation; Agenda 21; Brazil;
Clear-cutting; Climate and resources; Forestry; For-
ests; Genetic diversity; Plants as a medical resource;
Rain forests; Reforestation; Slash-and-burn agricul-
ture; Wood and timber.
Deltas
Category: Geological processes and formations
A delta is a deposit of sediments, composed primarily of
clay, gravel, and sand, at the mouth of a river. Deltas
are sometimes highly valued as agricultural lands.
The sandstones formed at the front of a delta are often
good reservoir rocks for oil and gas deposits.
Definition
Deltas are triangular-shaped bodies formed when
rivers flow into large bodies of standing water; they
form where the river’s speed and ability to carry sedi-
ments are suddenly reduced. The formation of deltas
is affected mainly by climate, seasonal fluctuations
of marine and river forces, geological features (the
shape of existing coastline and of the seafloor), and
river size and flooding patterns. The shape and inter
-
nal structure of deltas can be explained by the nature
and interaction of two forces: the sediment-carrying
stream fromariver and the current and wave actionof
the water body in which the delta is being built. This
interaction ranges from complete dominance of the
sediment-carrying stream (still-water deltas) to com-
plete dominance of currents and waves, resulting in
redistribution of the sediment over a wide area (no
deltas).
Overview
Through progressive outbuilding, the delta can be-
come overextended with long river courses. Even-
tually shorter, steeper, less-resistive paths to the sea
will be developed and the existing delta will be aban-
doned in favor of a shorter course. The Mississippi
Delta is a good example, where seven different deltas
have been built over the past five thousand years.
Abandoned deltas gradually submerge and become
eroded by wave action. The presently active Missis-
sippi Delta would be abandoned for a new one off the
Atchafalaya River if artificial control did not keep the
flow in check.
While dozens of major deltas exist today, not all
rivers, or even all major ones, have deltas. This situa-
tion is the result of a rise in sea level following the last
glacial period, which produced deep bodies of water
along many coastlines around the world that have not
yet been filled. Delta thicknesses vary widely. The Nile
Delta is 15 meters thick in a shallow embayment,
whereas the Mississippi Delta is more than 100 meters
thick, building out into deep water.
Deltas have fertile soil that makes them excellent
agricultural areas. The rich land of the Mississippi
Delta in Louisiana produces fruits, vegetables, and
other crops. The Nile Delta has been farmed since
ancient times, while the Irrawaddy Delta in Burma
and the Mekong Delta in Vietnam support large rice
fields. The Netherlands (with its Rhine and Maas
Deltas) isanexample of whatcan be donetowardland
reclamation when population is great.
Over time, because of pressure on the underlying
beds, a delta is buried deeper and deeper. Since the
sandstones formed at the front of a delta often have
good porosity (pore spaces) and permeability (chan-
nels connecting the pores), if there is a source of pe-
troleum, then old, deeply buried deltas can develop
into good oil reservoirs. An excellent example is the
Bell Creek oil field in the Powder River Basin, extend-
ing from southeastern Montana into northeastern
Wyoming.
Alvin K. Benson
282 • Deltas Global Resources
See also: Agricultural products; Land-use planning;
Oil and natural gas reservoirs; Rice; Sedimentary pro-
cesses, rocks,and mineral deposits;Streams and rivers.
Denmark
Categories: Countries; government and resources
Denmark is the leading exporter of fish in Europe. The
country is also the leader in wind-energy use and tech-
nological advances and the production of wind tur-
bines. Chalk and limestone cover a majority of the
landscape. The chalk cliffs of Møn Island and several
limestone caves are key tourist sites. The energy surplus
that allows the export of natural gas and oil brings bil-
lions of dollars into Denmark’s economy each year.
The Country
Denmark became a state during the tenth century and
a constitutional monarchy in 1849. Its citizens often
rank as the happiest in the world in global
surveys, and the country is the second most
peaceful in the world. Denmark islocatedon
the Jutland Peninsula in northern Europe.
It borders the Baltic and North Seas and
Germany to the south. Sweden is located to
the northeast. The country also includes
the islands of Fyn, Sjælland, and several
other smaller ones. Its position gives it con-
trol of the Danish Straits, which link the Bal-
tic and North Seas. Denmark is a low-lying
nation, prone to flooding, that is protected
from the sea by a series of dikes. The eleva-
tion of the country ranges from 171 meters
above sea level to 7 meters below sea level.
Denmark is a pioneer in harnessing energy
from wind power, combating the country’s
air pollution problem. Approximately one-
quarter of the population lives in the capital
city of Copenhagen. Denmark joined the
European Union in 1973 but did not adopt
the euro as its currency. Denmark’s stan-
dard of living and per-capita gross national
product areamongtheworld’s highest. The
country is also a welfare state, leading the
world in incomeequality. Among Denmark’s
top resources are limestone, chalk, natural
gas, petroleum, and salt.
Fish
Surrounded by water, Denmark has a long history
with the fishing industry. A wide range of fish are
found off the shores of Denmark, including haddock,
mackerel, cod, and trout. The town of Skagen, in the
northern tip of Denmark, is famous for its sea fishing.
A local museum is dedicated to thehistory of the town
and the fishing industry. Pike and trout are found in
the country’s rivers, lakes, and estuaries. Organic fish
farms can be found throughout the country and are
highly regulated by the Danish government. The or-
ganic fish farms cannot use feed containing geneti-
cally modified organisms or colorants, cannot treat
fish with medicine more than once in their lives, and
cannot harm predatory animals that might affect the
fish population. In order to protect the fish from at-
tackers, the farms are usually enclosed using a fine
mesh or bird nets.
Denmark is Europe’s largest exporter of industrial
fish. The country has a number of fish-processing
companies, but those exports are not as high. Most
processed fish is made with herring, mackerel, or cod.
Global Resources Denmark • 283
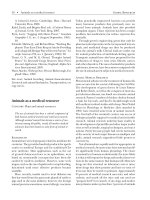
Denmark’s economy is reliant on the country’s fishing industry. In this 1956
photo, a Danish fisherman prepares his catch for market. (Hulton Archive/
Getty Images)
284 • Denmark Global Resources
Denmark: Resources at a Glance
Official name: Kingdom of Denmark
Government: Constitutional monarchy
Capital city: Copenhagen
Area: 16,640 mi
2
; 43,094 km
2
Population (2009 est.): 5,500,510
Language: Danish
Monetary unit: Danish krone (DKK)
Economic summary:
GDP composition by sector (2008 est.): agriculture, 1.3%; industry, 26.1%; services, 72.6%
Natural resources: petroleum, natural gas, fish, salt, limestone, chalk, stone, gravel and sand
Land use (2005): arable land, 52.59%; permanent crops, 0.19%; other, 47.22%
Industries: iron, steel, nonferrous metals, chemicals, food processing, machinery and transportation equipment,
textiles and clothing, electronics, construction, furniture and other wood products, shipbuilding and
refurbishment, windmills, pharmaceuticals, medical equipment
Agricultural products: barley, wheat, potatoes, sugar beets, pork, dairy products, fish
Exports (2008 est.): $114.9 billion
Commodities exported: machinery and instruments, meat and meat products, dairy products, fish, pharmaceuticals,
furniture, windmills
Imports (2008 est.): $116.4 billion
Commodities imported: machinery and equipment, raw materials and semimanufactures for industry, chemicals,
grain and foodstuffs, consumer goods
Labor force (2008 est.): 2.88 million
Labor force by occupation (2005 est.): agriculture, 2.9%; industry, 23.8%; services, 72.7%
Energy resources:
Electricity production (2007 est.): 36.99 billion kWh
Electricity consumption (2006 est.): 34.68 billion kWh
Electricity exports (2007 est.): 11.38 billion kWh
Electricity imports (2007 est.): 10.43 billion kWh
Natural gas production (2007 est.): 9.223 billion m
3
Natural gas consumption (2007 est.): 4.555 billion m
3
Natural gas exports (2007 est.): 4.517 billion m
3
Natural gas imports (2007 est.): 0 m
3
Natural gas proved reserves ( Jan. 2008 est.): 70.51 billion m
3
Oil production (2007 est.): 313,800 bbl/day
Oil imports (2006 est.): 164,000 bbl/day
Oil proved reserves ( Jan. 2008 est.): 1.188 billion bbl
Source: Data from The World Factbook 2009. Washington, D.C.: Central Intelligence Agency, 2009.
Notes: Data are the most recent tracked by the CIA. Values are given in U.S. dollars. Abbreviations: bbl/day = barrels per day;
GDP = gross domestic product; km
2
= square kilometers; kWh = kilowatt-hours; m
3
= cubic meters; mi
2
= square miles.
Copenhagen
Sweden
Norway
Germany
Denmark
Poland
Baltic
Sea
North
Sea
These products are made with both imported and do
-
mestically caught fish. Only 5 percent of the pro-
cessed fish products remain in Denmark. Between
1983 and 1998 the amount of fresh fish and fillets ex-
ported from Denmark doubled. Because of this large
increase, the processed fish industry has relied more
heavily on imports. The four main imports are her-
ring (from Norway), trout, salmon, and shrimp. The
industry produces a wide variety of products that are
frozen, canned (mostly herring, mackerel, and blue
mussels), smoked, pickled, andmarinated.Mostmeat
and oil processing is done in the northern and west-
ern portions of the country, with mackerel and her-
ring mainly processed in the north. Amanda Seafood,
established in 1916, was among the first makers of
Danish canned fish. During the mid-1950’s the com-
pany introduced a line of pressed cod roe in cans. The
Lykkeberg company was founded by Peter Lykkeberg
in 1899 to produce “semi-preserved” herring. The
company remains in business and is known globally
for the quality of its herring. Fish and seafood exports
account for roughly 3.5 percent of Denmark’s ex-
ports. In the fifteen years following 1983, exports in-
creased from 634,900 metric tons to more than 1 mil-
lion metric tons. By 2002, Denmark was exporting
1.03 million metric tons of fish. Danish fishermen
caught 1.32 million metric tons of fish that year.
Natural Gas
Following the discovery of natural gas in Denmark’s
region of the North Sea, the Danish government
passed the Natural Gas Supply Planning Act in 1979.
The first gas was pumped to shore five years later. The
gas supply continued to grow until it was available na-
tionwide by early in the 1990’s. In 2002, natural gas ac-
counted for 23 percent of Denmark’s energy con-
sumption. At that time, the reserves in the North Sea
were estimatedto be enough tolastfor eighteen years.
Between 2006 and 2007,Danishexportsofnaturalgas
rose by 60 percent to more than 4.5 billion cubic me-
ters, ranking the country twenty-fourth in that cate-
gory worldwide. Exports dropped 9 percent by 2008.
Denmark has considered building a pipeline to Po-
land to import natural gas when its reserves in the
North Sea begin to decline. Denmark’s increasing re-
liance onwindpower has helped increasethenumber
of years thecountry can be energy self-sufficient. Den-
mark first had a surplus of oil and gas in 1995. In 2007,
exports of natural gas and oil amounted to 28.3 bil
-
lion Danish kroner (about $5.4 billion). In January,
2009, Denmark’s estimated reserves for natural gas
were 107 billion cubic meters.
Oil
In 1973, Denmark relied on oil for 88.7 percent of
its energy needs. By 2001, the country had lowered
that to 45.8 percent. Oil production began in 1972,
in the coastal waters surrounding the country. There
are nineteen active oil-producing fields in Denmark.
In January, 2008, Denmark’s oil reserves were esti-
mated to be 1.188 billion barrels, ranking it forty-
seventh in that category worldwide. At the beginning
of 2009, the country’s oil reserves had dropped. At its
2009 rate of production, accounting for its estimated
reserves, Denmark was expected to exhaust its oil in
2018 and its natural gas in 2020. However, with im-
proved technology and the discovery of additional oil
sources, Denmark could extend its domestic oil use to
2029.
A study published in 2009 may lead to increased
Danish oil production. A group of researchers from
the Nano-Science Center at the University of Copen-
hagen havebeenstudying the rockson the floorofthe
North Sea. The rocks are mainly composed of chalk,
which no study has previously investigated in this ca-
pacity. They found that the areas that contained oil
displayed drastically different surface qualities from
those expected. The chalk was expected to repel the
oil; instead the scientists found that the oil stuck to it.
These findings may lead to a new or better method of
extracting oil from the North Sea and increased oil
production.
Limestone
Much of Denmark is limestone. The Mønsted mine
and quarry west of Viborg is the largest limestone
mine in the world. The mine shut down in 1953 after
one thousand years of mining. Limestone was initially
of little use to the Danes, but this changed after the
country converted to Christianity. Many churches
were built using limestone, more than two thousand
in two hundred years, greatly boosting the area’s
economy. An underground furnace was also built to
burn limestone; the result was used as a mortar. There
are around 60 kilometers of underground caves of
varying sizes and depths. Two kilometers of the mines
are equipped with electricity and are open to the pub-
lic. The mines include two underground lakes. There
is a multimedia presentation that explains the history
of limestone and the mines. Concerts are also held in
Global Resources Denmark • 285
some of the larger caves. The limestone caverns are
the winter home to more than five thousand bats. The
cool, steady conditions allow the Mønsted caves to be
used to age 180 metric tons of cheese made by a local
dairy.
The Daugbjerg mine is located 3 kilometers from
the Mønsted mine. This mine is also open to the pub-
lic, with candlelight tours givingtouristsanidea about
the working conditions of miners. These caves are
where the legendary Jens Olesen, a Robin Hood-type
criminal from the 1620’s, hid from authorities. The
mine also ages cheese and stores sausages and wines,
all of which can be purchased on site. The Daugbjerg
mine is home to the largest collection of bats, more
than twelve thousand, in Denmark.
The Thingbæk mine was owned by Anders Bund-
gaard, a sculptor by trade. In 1936, the caves were con-
verted into a sculptural museum. Limestone was
mined there for generations, but the mine was
not highly profitable. Most of the exhibits were Bund-
gaard’s own works of art, including plaster models of
famous foreign pieces. He created the Emigration
Cave, which features a number of reliefs that tell the
story of those who moved to the United States. In
1969, plaster works of another artist, C. J. Bonnesen,
were donated to the museum.
The rocky island of Bornholm in the Baltic Sea also
has a number of limestone caves, caverns, mines, and
quarries. The largest cavern is 70 meters long and is
located in the northern section of the island. Several
other mines and quarries can be found throughout
the country. Through the end of the twentieth cen-
tury, Denmark still produced almost 1 million metric
tons of agricultural and industrial limestone.
Chalk
Møns Klint, the cliffs of Møn, are a major tourist at-
traction along the eastern coast of the island of Møn
in the Baltic Sea. The cliffs are bright white and com-
posed of chalk. They cover 8 kilometers along the
coast of the island. Someofthecliffs have a steep drop
of 120 meters from the top to sea level. The cliffs and
surrounding land are protectedaspart ofanaturalre-
serve. Touristswho visit the cliffs enjoy walking and cy-
cling along the many marked trails throughout the
nature reserve. In 2007, a museum was opened near
the top of the cliffs that focuses on the geological his-
tory ofDenmarkand the formation ofthechalk cliffs.
The chalk formed from the shells of millions of mi
-
croscopic sea creatures that were more than seventy
million years old. Layers of chalk strata covered the
seabed as the creatures died. Glaciers crossed Den-
mark during the last ice age, about sixteen thousand
years ago. The glaciers moved westward across the
area, putting the seabed under great pressure. The
chalk strata were compacted and pushed upward in
front of the slow-moving glacier. When the glacier re-
treated, the chalk cliffs of Møns remained. The cliffs of
Rügen, Germany, across the Baltic, formed at the same
time fromthesame deposits. The areais abundant with
fossils of shellfish. The soil in the region is very chalky,
which has led to the growth of a variety of rare plants,
including several orchids. The soil conditions also give
beech trees at the top of the cliffs a light-green hue,
which the trees keep throughout the summer.
Because of the steepness of the cliffs and the quali-
ties of chalk, landslides are a possibility. In 1952, at
Røde Udfald a landslide created a peninsula that
stretches 450 meters out into the ocean. In 1988, at
Møns Klint, one of the landmark cliffs slid into the
ocean. Several other landslides and rock slides have
occurred. The worst landslide in fifty years on Møn
was in 2007. Store Taleren (the big speaker)—
417,200 metric tons of chalk, clay, and sand—fell into
the ocean. The landslide created a peninsula that
reached 300 meters into the Eastern Sea. A smaller
rockslide that formed a peninsula 100 meters long oc-
curred to the south less than six weeks later.
Wind Energy
Following the oil crisis of 1973 many Danes began to
rally for cheaper, cleaner energy, other than nuclear
power, which they felt was unsafe. The Nordic
Folkecenter for Renewable Energy, the leader in de-
veloping commercial applications of wind and renew-
able energy sources, was founded in 1983. By the mid-
1980’s, the grassroots movement finally convinced
the government to focuson non-oil energy sources.In
1988, the government set a goal of lowering carbon
emissions by 22 percent by 2005. Typical wind speeds
measured at 10 meters inland are 4.9-5.6 meters per
second. Highest values are found in the western re-
gion of the country and on islands to the east. How-
ever, Denmark’s offshore regions have the highest
wind speed capacities in Europe: 8.5-9 meters per sec-
ond measured at an elevation of 50 meters.
In 1996, the Danish government began offering
tax credits to citizens who either invested in wind-
turbine collectives or purchased their own turbines.
In 2004,reports showedthat86 percent ofDanes were
286 • Denmark Global Resources
in favor of wind energy. The first offshore wind farm
worldwide, Vindeby, was built by Denmark in 1991.
The Middelgrunden offshore wind farm was the larg-
est in the world when it was built in 2000. The farm
consists of twenty turbines off the coast of Copenha-
gen. In 2009, Denmark had approximately six thou-
sand wind turbines in operation, with more sched-
uled to follow. A larger wind farm, off the island of
Anholt, was expected to be operational by 2012. The
existing wind farms produce a growing amount of
Denmark’s electricity supply, rising from 12.1 percent
in 2001 to 19.7 percent in 2007. Denmark is the world
leader in manufacturing wind turbines, exporting ap-
proximately 90 percent of those produced. In 2003,
38 percent of the global wind-turbine industry was
Danish companies.
Despite the high approval rating of wind energy
among Danes, and the world’s growing desire to end
its dependence on coal and oil, wind energy has a
number of critics. Wind farms worldwide have killed
tens of thousands of birds and bats, including many
rare and endangered species. Other critics argue that
the wind farms are actually doing more harm than
good. Denmark had notshutdownany of its fossil fuel
power plants as of 2009. Some scientists argue that the
wind farms actually increase carbon emissions be-
cause a growing number of power plants are needed
to back up the turbines in case of diminished wind
speeds. Electricity produced by wind is the highest
priced of renewable energies.
Other Resources
The production of salt is sometimes referred to as
Denmark’s first industry. The island of Laesø has an
abundance of salt, which was first produced there
hundreds of years ago. Now the island is a popular
tourist site. The Salt Center, the only salt-themed mu-
seum in Scandinavia, offers a variety of activities and
exhibits. The center features the history of salt and
the saltindustry,ascience lab for hands-onsalt experi-
ments, and a “Dead Sea” indoor pool where visitors
can experience weightlessness.
Denmark also has a number of farming coopera-
tives and one of the world’s leading free-trade econo-
mies. The country produces barley, wheat, potatoes,
and sugar beets.TheDanishdiet consists of fish, pork,
and cheese and other dairy products. Most of Den-
mark’s agricultural trading partners are fellow Euro
-
pean Union countries.
Jennifer L. Campbell
Further Reading
“Denmark: Wind Power.” BusinessWeek (September
15, 2003): 22.
Fielding, Andrew, and Annelise Fielding. The Salt In-
dustry. Westminster, Md.: Shire, 2008.
Jensen, Jørgen. The Prehistory of Denmark. London:
Routledge, 2000.
Jespersen, Knud. A History of Denmark. New York:
Palgrave Macmillan, 2004.
Jones, Gwyn. A History of the Vikings. 2d ed. New York:
Oxford University Press, 2001.
Van Est, Rinie. Winds of Change: A Comparative Study
on the Politics of Wind Energy Innovation in California
and Denmark. Utrecht, Netherlands: International
Books, 2000.
See also: Fisheries; Limestone; Renewable and non-
renewable resources; Wind energy.
Department of Agriculture, U.S.
Category: Organizations, agencies, and programs
Date: Established 1862
The U.S. Department of Agriculture is known for its
stewardship of natural resources, research to ensure a
safe and abundant food supply, inspection of agricul-
tural products, and provision of loans in rural com-
munities.
Background
President Abraham Lincoln founded the U.S. Depart-
ment of Agriculture (USDA) to help farmers improve
their yield. This service is one of many now provided
by the agencies within the USDA. Many USDA pro-
grams assist farmers. The USDA Consolidated Farm
Service Agency (CFSA) administers programs to im-
prove the economic stability of agriculture. Farmers
are helped to adjust production to meet demand
through acreage reductions. Federal crop insurance
guards against losses from unavoidable causes.
Impact on Resource Use
USDA researchers provide objective statistical infor-
mation to food producers to enable them to produce
high-quality food without damaging the environment.
For a rural population struggling with job losses, emi
-
gration, and declining living standards, the USDA
Global Resources Department of Agriculture, U.S. • 287
will fund projects that create jobs, services, and hous
-
ing. For the general population, the USDA acts as a
bridge between farmer and consumer by advocating
nutrition. Most nutrition programs are directed at
low-income Americans; such programs include soup
kitchens and food banks, nutrition programs for the
elderly,andthe food stamp and national school lunch
programs.
The USDA keeps track of what Americans eat,
where they eat it, and how much they spend on food.
Statistics are also gathered on farm income, employ-
ment, and thepoverty rateinrural areas of the United
States. Ensuring that food is safe to eat is a prime con-
cern of the USDA. Inspection teams stamp their ap-
proval on meat and poultry, and tools to aid in the de
-
tection of bacteria are continually developed by
USDA’s Food Safety and Inspection Service. A water-
quality program protects the nation’s waters from con-
tamination by agricultural chemicals and provides fi-
nancial assistancetoaddress environmentalconcerns.
As a steward of the land, the USDA manages fed-
eral lands through the U.S. Forest Service and the
Natural Resources Conservation Service (NRCS, for-
merly the Soil Conservation Service). About 78 mil-
lion of the 300 million hectares of forestland in the
United States are in the Forest Service system. The
Forest Service strives to sustain ecosystems by ensur-
ing their health, diversity, and productivity. Lands are
288 • Department of Agriculture, U.S. Global Resources
U.S. Department of Agriculture
SECRETARY
Deputy Secretary
Director of
Communications
Inspector
General
General
Counsel
Assistant Secretary
for Congressional
Relations
Assistant Secretary
for
Administration
Assistant Secretary
for Civil Rights
Chief Information
Officer
Chief Financial
Officer
Executive
Operations
Under
Secretary
for Natural
Resources and
Environment
Under
Secretary
for Farm
and Foreign
Agricultural
Services
Under
Secretary
for Rural
Development
Under
Secretary
for Food,
Nutrition,
and Consumer
Services
Under
Secretary
for Food
Safety
Under
Secretary
for Research,
Education,
and
Economics
Under
Secretary for
Marketing and
Regulatory
Programs
•ForestService
• Natural
Resources
Conservation
Service
•FarmService
Agency
•Foreign
Agricultural
Service
•Risk
Management
Agency
• Rural Utilities
Service
•RuralHousing
Service
• Rural Business
Cooperative
Service
• Food and
Nutrition
Service
•Centerfor
Nutrition Policy
and Promotion
• Food Safety and
Inspection
Service
•Agricultural
Research
Service
•National
Institute of Food
and Agriculture
•Economic
Research
Service
•National
Agricultural
Library
•National
Agricultural
Statistics Service
•Agricultural
Marketing
Service
• Animal and
Plant Health
Inspection
Service
•Grain
Inspection
Packers and
Stockyards
Administration
protected from wildfire, epidemics of disease and in
-
sect pests, erosion, floods, and air and water pollu-
tion. Advocating the policy of multiple use, the Forest
Service encourages public recreation in national for-
ests. Rangelands are managed to provide food for
both livestock and wildlife; they also serve as water-
sheds and recreational sites.
The NRCS provides landowners with technical as-
sistance for developing and implementing conserva-
tion plans. Its field staff also collect data from more
than twelve hundred mountain sites to provide vital
information on water supplies; its Plant Materials
Centers develop plant strains to increase propagation
for mass production. The passing of the Federal Crop
Insurance Reform and Department of Agriculture
Reorganization Act in 1994 resulted in substantial re-
organization of the USDA with the goals of improving
coordination among its agencies and cutting costs to
taxpayers.
Jill A. Cooper
Web Site
U.S. Department of Agriculture
/>See also: Agriculture industry; Agronomy; Forest
Service, U.S.; Natural Resources Conservation Ser-
vice; Public lands.
Department of Energy, U.S.
Category: Organizations, agencies, and programs
Date: Established 1977
The Department of Energy is the primary developer
and manager of U.S. energy resources. Energy is an
area crucial to the U.S. economy and subject to politi-
cal debate. The Department of Energy oversees the na-
tion’s massive energy needs while also trying to con-
serve its precious resources.
Background
The Department of Energy is part of the executive
branch of the U.S. government. The secretary of en-
ergy is a member of the president’s cabinet, con-
firmed by the Senate. James Schlesinger was the first
energy secretary. Established by Congress on October
1, 1977, the Department of Energy assumed responsi
-
bilities that numerousfederalagencies had previously
had in managing the nation’s natural resources. The
Department of Energy assumed duties long exercised
by the Department of the Interior and three federal
agencies—the Federal Power Commission, the Fed-
eral Energy Administration, and the Energy Research
and Development Administration (ERDA). The De-
partment of Energy also oversees the nation’s nuclear
energy and weapons programs.
Impact on Resource Use
The Department ofEnergywas established duringthe
administration of President Jimmy Carter in reaction
to the oil crisis of the 1970’s. Its roots, however, go
deeper in history.Thefederalgovernment had always
played a role in developing and managing the na-
tion’s water, timber, mineral, coal, oil, and other en-
ergy resources. With the Manhattan Project of the
1940’s and the Atomic Energy Commission of the
1950’s (eventually incorporated into the ERDA), the
federal government exercised exclusive control over
the creation of atomic weapons and energy. The De-
partment of Energy assumed these responsibilities
by way of the October 1, 1977, Department of Energy
Organization Act. The United States has always en-
joyed an abundance of energy through its vast natural
resources and unparalleled industrial development.
However, in the 1970’s, the nation had to reassess its
energy situation when the major oil-producing coun-
tries declared oil embargoes. The response was the
creation of the Department of Energy, whose man-
date was to foster energy research, development, and
production to meet domestic and international chal-
lenges. In line with Carter’s energy policies, the De-
partment of Energy began programs to increase use
of solar energy and to conserve fossil-fuel resources.
The administration of President Ronald Reagan em-
phasized increased production of energy by reducing
federal regulationofthe energy supply.Inresponse to
threatened oil embargoes, the Department of Energy
built up petroleum reserves, reaching 250 million
barrels in 1982. The Department of Energy also be-
gan well-publicized programs to dispose of by-prod-
ucts of energy development. For example, in 1983,
the Department of Energy created a Civilian Radioac-
tive Waste Department. It also started a program to
develop “clean” (less-polluting) coal-burning facili-
ties. In 1989, the Department of Energy created an of
-
fice of Environmental Restoration and Waste Man
-
agement.
Global Resources Department of Energy, U.S. • 289