Commodity Trading Advisors: Risk, Performance Analysis, and Selection Chapter 5 pdf
Bạn đang xem bản rút gọn của tài liệu. Xem và tải ngay bản đầy đủ của tài liệu tại đây (319.58 KB, 26 trang )
CHAPTER
5
CTA Performance Evaluation
with Data Envelopment Analysis
Gwenevere Darling, Kankana Mukherjee, and Kathryn Wilkens
W
e apply data envelopment analysis to a performance evaluation frame-
work for CTAs. The technique allows us to integrate several perform-
ance measures into one efficiency score by establishing a multidimensional
efficient frontier. Two dimensions of the frontier are consistent with the
standard Markowitz mean-variance framework, while additional risk and
return dimensions include skewness and kurtosis. We also illustrate a
method of analyzing determinants of efficiency scores. Tobit regressions of
efficiency scores on equity betas, beta-squared, fund size, length of manager
track record, investment style (market focus), and strategy (discretionary vs.
systematic) are performed for CTA returns over two time frames represent-
ing different market environments. We find that the efficiency scores are
negatively related to beta-squared in both time periods. Results also indi-
cate that emerging CTAs (those with shorter manager track records) tend to
have better efficiency scores as defined by the DEA model used in our study.
This relationship is strongest during the period from 1998 to 2000, but not
statistically significant during the period from 2000 to 2002. For both time
periods, fund size is not related to efficiency scores.
INTRODUCTION
Industry performance reports for commodity trading advisors (CTAs)
present multiple performance measures such as return, standard deviation,
drawdowns, betas, and alphas. Investors and fund managers recognize the
importance of considering a multitude of performance measures to analyze
fund risk from various perspectives. It is particularly important for the
growing alternative investment class of managed futures, which have dif-
79
c05_gregoriou.qxd 7/27/04 11:07 AM Page 79
ferent risk/return profiles from those of traditional mutual funds as well as
those of many hedge fund strategies. For all asset classes, however, the aca-
demic literature has done little to offer a comprehensive framework that
incorporates multiple risk measures in an integrated fashion (Arnott
2003). Too often, studies focus on single measure of risks, arguing for one
relative to another.
“Managed futures” are a subset of hedge funds that uses futures con-
tracts as one among several types of trading instruments (including swaps
and interbank foreign exchange markets) and for which futures are a
means, rather than an end, with which to implement their strategy. The
name wrongly suggests that futures are the dog rather than the tail. Man-
aged futures encompass the broad set of individual commodity trading
advisors (CTAs). CTAs are also unfortunately named because, on balance,
most of their trading is in the financial markets, not the commodity mar-
kets. Like any other class of alternative investments, managers are repre-
sented by a variety of styles and substyles. For example, there are systematic
and discretionary CTAs, CTAs who exclusively try to capture trends, those
who identify countertrend opportunities, and those who combine the two
approaches.
1
In this study we look at the performance of CTAs based on multiple criteria
using data envelopment analysis (DEA). DEA establishes a multidimensional
efficient frontier and assigns each CTA an efficiency score whereby 1 (or 100
percent) indicates perfect efficiency and scores lower than 1 represent rela-
tively less efficient CTAs based on the performance criteria chosen.
The criteria we choose as bases for performance evaluation are monthly
returns, kurtosis, minimum return, skewness, standard deviation of returns,
and percentage of negative monthly returns. Although there are many other
possibly appropriate criteria, those not included here are likely either to be
redundant with variables included or to not make sense in an optimization
framework. Criteria that make sense in this framework are those that are
desirable to maximize or minimize across various market conditions. This
aspect leads us to reject equity betas as a criterion in the DEA model, for
example, because CTAs may desire a higher beta in up-market environ-
ments but negative betas in down-market periods.
In addition to applying the DEA methodology to evaluate CTA per-
formance, we explore the relationship between the efficiency scores and
fund size, investment style and strategy, length of the manager’s track
80 PERFORMANCE
1
Another important dimension of styles is the time frame. There are long-term,
short-term, and medium-term traders and those who combine time frames.
c05_gregoriou.qxd 7/27/04 11:07 AM Page 80
record, and measures of the covariance of CTA returns with equity market
returns. We ask:
■ Do emerging hedge fund managers
2
really do better than larger, estab-
lished managers?
■ Is there a relationship between efficiency scores and equity markets,
and if so, does the market environment impact the relationship?
■ Do strategies (systematic, discretionary, trend-based) or styles (diversi-
fied, financial, currency, etc.) matter in different market environments?
We analyze monthly CTA returns in two different market environ-
ments: over 24 months beginning in 1998, when equity market returns are
predominantly positive, and over 24 months beginning in 2000, when they
are more often negative. We find that emerging managers perform better
than well-established managers in the sense that funds with shorter track
records have a greater efficiency score. Fund size and manager tenure are
weakly positively correlated. In contrast with the conventional wisdom,
however, larger funds have better efficiency scores. These results provide
some insight into capacity issues concerning optimal fund size. The fund
size and manager tenure coefficients are, however, statistically significant
only during the first (1998–2000) time period, indicating that capacity
issues may be less important during flat equity markets.
For both time periods, squared equity beta is inversely related to the
efficiency scores and the coefficient is highly significant. This result appears
to be influenced by the risk-minimizing design of our DEA model. The style
dummy variable (diversified versus nondiversified) was not a significant fac-
tor impacting efficiency scores. The systematic strategy variable was signif-
icant, but only during the second (2000–2002) down-market period. We
consider these results as preliminary because several issues may be affecting
their significance. Notably, when our sample size is broken down by invest-
ment style and strategy, the number of CTAs representing each group is very
small. Nevertheless, we believe that the approach is a promising avenue for
further research.
The next section of this chapter provides a background discussion on var-
ious risk measures and performance evaluation issues. The variables chosen
as inputs to the DEA model and the regression model are then discussed in
the context of prior research, and the data are described. The variable descrip-
CTA Performance Evaluation with Data Envelopment Analysis 81
2
We consider managers with short track records to be emerging CTAs. This cate-
gory is distinctly different from managers who invest in emerging markets.
c05_gregoriou.qxd 7/27/04 11:07 AM Page 81
tion is followed by an explanation of the DEA methodology and Tobit regres-
sions used to explore determinants of the efficiency scores obtained from the
DEA model. Results are presented and the final section concludes.
RISK MEASURES AND PERFORMANCE EVALUATION
A multitude of investment fund performance models and metrics exist in part
because some measures are more appropriate for certain purposes than others.
For example, the Sharpe ratio is arguably more appropriate when analyzing
an entire portfolio, while the Treynor ratio is appropriate when evaluating a
security or investment that is part of a larger portfolio.
3
The multitude of per-
formance measures and approaches also suggests that more than one meas-
ure of risk may be needed to accurately assess performance. Conversely, some
measures can be redundant. For example, Daglioglu and Gupta (2003b) find
that returns of hedge fund portfolios constructed on the basis of some risk
measures are often highly correlated, and sometimes perfectly correlated,
with returns of portfolios constructed on the basis of others. Burghart, Dun-
can, and Liu (2003) illustrate that the theoretical distribution of drawdowns
can be replicated with a high degree of accuracy given only a manager’s aver-
age return, standard deviation of returns, and length of track record.
In this section we begin by briefly reviewing some of the traditional
portfolio performance measures and analysis techniques. We review single
parameter risk measures based on modern portfolio theory, we discuss
expanded performance models that account for time-varying risk, discuss
concerns over assuming mean-variance sufficiency, and consider multifactor
models of style and performance attribution. This short review exposes a
plethora of performance measures. The question of appropriateness and
redundancy is revisited in the section that describes the data used in this
study. The current section also discusses the seemingly paradoxical issue of
using benchmarks to evaluate absolute return strategies
4
and concludes
with a discussion of potential determinants of performance.
Alpha and Benchmarks
Traditional asset managers seek to outperform a benchmark, and their per-
formance is measured relative to that benchmark in terms of an alpha.
82 PERFORMANCE
3
The Sharpe measure is appropriate when analyzing an entire portfolio, because the
standard deviation, or total risk, is in the denominator whereas beta is the denomi-
nator of the Treynor measure, and beta measures the systematic risk that will con-
tribute to the risk of a well-diversified portfolio.
4
Absolute return strategies seek to make positive returns in all market conditions.
In contrast, relative return strategies seek only to outperform a benchmark.
c05_gregoriou.qxd 7/27/04 11:07 AM Page 82
While CTAs follow absolute return strategies that seek to make positive
returns in all market conditions, benchmarks now exist for CTAs and other
hedge fund strategies. Before considering benchmarks for absolute return
strategies, we first review the concepts in the context of traditional asset
management. Jensen’s (1968) alpha is generally a capital asset pricing model
(CAPM)-based performance measure of an asset’s average return in excess
of that predicted by the CAPM, given its systematic risk (beta)
5
and the
market (benchmark) return. Alphas also may be measured relative to addi-
tional sources of risk in multi-index models.
Whereas various single-index models are based on the CAPM and
assume that security returns are a function of their co-movements
6
with the
market portfolio, multi-index (or multifactor) models assume that returns
are also a function of additional influences.
7
For example, Chen, Roll, and
Ross (1986) develop a model where returns are a function of factors related
to cash flows and discount rates such a gross national product and infla-
tion. The purposes of multi-index models are varied and, in addition to
performance attribution, include forming expectations about returns and
identifying sources of returns.
Sharpe (1992) decomposes stock portfolio returns into several “style”
factors (more narrowly defined asset classes such as growth and income
stocks, value stocks, high-yield bonds) and shows that the portfolio’s mix
accounts for up to 98 percent of portfolio returns. Similarly, Brinson,
Singer, and Beebower (1991) show that rather than selectivity or market
timing abilities, it is the portfolio mix (allocation to stocks, bonds, and
cash) that determines over 90 percent of portfolio returns. However, Brown
and Goetzmann (1995) identify a tendency for fund returns to be correlated
across managers, suggesting performance is due to common strategies that
are not captured in style analysis.
Schneeweis and Spurgin (1998) use various published indexes (Gold-
man Sachs Commodity Index, the Standard & Poor’s 500 stock index, the
CTA Performance Evaluation with Data Envelopment Analysis 83
5
Within the Markowitz (1952) framework, total risk is quantified by the standard
deviation of returns. Tobin (1958) extended the Markowitz efficient frontier by
adding the risk-free asset, resulting in the capital market line (CML) and paving the
way for the development of the capital asset pricing model, developed by Sharpe
(1964), Lintner (1965), and Mossin (1966). The CAPM defines systematic risk,
measured by beta (b), as the relevant portion of total risk since investors can diver-
sify away the remaining portion.
6
Usually CAPM-based performance models describe covariance with the market
portfolio, however, as noted earlier, they can attempt to describe coskewness and
cokurtosis as well.
7
Arbitrage pricing theory (APT) establishes the conditions under which a multi-
index model can be an equilibrium description (Ross, 1976).
c05_gregoriou.qxd 7/27/04 11:07 AM Page 83
Salomon Brothers government bond index, and U.S. dollar trade-weighted
currency index, the MLM Index
8
) with absolute S&P 500 returns and
intramonth S&P return volatility in a multifactor regression analysis to
describe the sources of return to hedge funds, managed futures, and mutual
funds. The index returns employed in the regression analysis are intended
to be risk factors that explain the source of natural returns. The explana-
tory variable, absolute equity returns, captures the source of return that
derives from the ability to go short or long. Returns from the use of options
or intramonth timing strategies are proxies for the intramonth standard
deviation. The MLM Index, an active index designed to mimic trend-
following strategies, is used to capture returns from market inefficiencies in
the form of temporary trends.
Seigel (2003) provides a comprehensive review of benchmarking and
investment management. Despite the fact that CTAs and many hedge fund
managers follow absolute return strategies, various CTA benchmarks now
exist, as described by Seigel (2003).
Addressing Time-Varying Risk
Single-parameter risk measures are problematic if managers are changing
fund betas over time, as they would if they were attempting to time the mar-
ket. For example, when equity prices are rising, the manager might increase
the fund’s beta and vice versa. Although market risk can be measured if the
portfolio weights are known, this information is generally not publicly
available and other techniques must be employed.
9
84 PERFORMANCE
8
Mount Lucas Management Index
TM
is based on a concept conceived in 1988 of an
index methodology that involves changing (commodity) market sides long and short
to measure economic return.
9
Treynor and Mazuy (1966) added a quadratic term to the basic linear regression
model to capture nonlinearities in beta resulting from market timing activities. Kon
and Jen (1978, 1979) use a switching regression technique. Merton (1981) and Hen-
riksson and Merton (1981) develop nonparametric and parametric option-based
methods to test for directional market timing ability. The nonparametric approach
requires knowledge of the managers’ forecasts. The more commonly employed
parametric approach involves adding an extra term to the usual linear regression
model and is CAPM based. Ferson and Schadt (1996) note that fund betas may
change in response to changes in betas of the underlying assets as well as from
changing portfolio weights. They modify the classic CAPM performance evaluation
techniques to account for time variation in risk premiums by using a conditional
CAPM framework. This method removes the perverse negative performance often
found in earlier tests and suggests that including information variables in perform-
ance analysis is important.
c05_gregoriou.qxd 7/27/04 11:07 AM Page 84
Mitev (1998) uses a maximum likelihood factor analysis technique to
classify CTAs according to unobservable factors. Similarly, Fung and Hsieh
(1997b) also use a factor-analytic approach to classify hedge funds. In both
cases, the results identify general investment approaches or trading strate-
gies (e.g., trend-following, spread strategies, or systems approaches) as
sources of returns to these alternative investment classes. Factor analysis
and multifactor regression analysis differ in their approach to identifying
the factors (benchmarks) that serve as proxies for risk. In multifactor
regression analysis, the factors are specified in advance. Factor analysis will
identify funds that have common yet unobservable factors, although the
factors can be inferred from the qualitative descriptions of the funds. While
this may seem redundant, the clustering of funds is done independently of
the qualitative descriptions in a formal data-driven process.
The data envelopment analysis methodology used in this chapter, and
described in more detail in Wilkens and Zhu (2001, 2004), incorporates
multiple criteria and “benchmarks” funds or other securities according to
these criteria. This is distinctly different from multifactor analysis. Here
benchmarks are not risk factors but rather are efficient securities as defined
in n dimensions where each dimension represents risk and return criteria.
Recently Gregoriou (2003) used the DEA method in the context of bench-
marking hedge funds.
Skewness and Kurtosis:
Questioning Mean-Variance Sufficiency
The standard CAPM framework assumes that investors are concerned with
only the mean and variance of returns. Ang and Chau (1979) argue that
skewness in returns distributions should be incorporated into the perform-
ance measurement process. Even if the returns of the risky assets within a
portfolio are normally distributed, dynamic trading strategies may produce
nonnormal distributions in portfolio returns. Both Prakash and Bear (1986)
and Stephens and Proffitt (1991) also develop higher-moment performance
measurements.
Fishburn (1977), Sortino and van der Meer (1991), Marmer and Ng
(1993), Merriken (1994), Sortino and Price (1994), and others also have
developed measures that take into account downside risk (or semivariance)
rather than the standard deviation of returns. Although some differences
exist among these measures, the Sortino ratio captures their essence.
Whereas the Sharpe ratio is defined as excess return
10
divided by standard
CTA Performance Evaluation with Data Envelopment Analysis 85
10
Return minus the risk-free rate.
c05_gregoriou.qxd 7/27/04 11:07 AM Page 85
deviation, the Sortino ratio is defined as return divided by downside devia-
tion. Downside deviation (DD) measures the deviations below some mini-
mal accepted return (MAR). Of course, when the MAR is the average
return and returns are normally distributed, the Sharpe and Sortino ratios
will measure the same thing. Martin and Spurgin (1998) illustrate that even
if individual asset or fund returns are skewed, the skewness tends to be
diversified away at the portfolio level. However, they also illustrate that
managers may choose to follow strategies that produce skewed returns as a
form of signaling their skill. Note that coskewness remains irrelevant if it
can be diversified away, but skewness may have some signaling value. Addi-
tionally, the popularity of the related value at risk (VaR) measure
11
and the
common practice of reporting drawdown
12
information for various alter-
native investments suggest that skewness may be important, whether in
terms of investor utility or skill signaling.
Beta-Squared Coefficient The classic paper by Fama and MacBeth (1973),
and several other early papers (e.g., Carroll and Wei 1988; Shanken 1992)
empirically test a two-pass regression methodology for stock returns.
Assuming a nonlinear relationship between stock returns, the tests include
beta-squared in the second-pass regression. These tests find that the coeffi-
cient for beta-squared is negative and statistically significant, providing evi-
dence of a nonlinearity in stock returns.
Schneeweis and Georgiev (2002, p. 7) provide evidence that CTAs have
nonlinear returns with respect to the equity market: “When S&P 500
returns were ranked from low to high and divided into four thirty-three
month sub-periods, managed futures offered the opportunity of obtaining
positive returns in months in which the S&P 500 provided negative returns
as well as in months in which the S&P 500 reported positive returns.”
We include equity beta-squared in our Tobit regressions where the
dependent variable is not the expected return of the CTA, but is rather
the efficiency score obtained in the DEA models. Although the dependent
variable is not the same as in the earlier stock studies, we might hypothe-
size that CTA efficiency scores are also negatively related to beta-squared.
86 PERFORMANCE
11
See Chung (1999) for a concise review of VaR methodologies.
12
Drawdown information is generally reported as the maximum drawdown over a
period and is defined as the return from a fund’s net asset value peak to trough. The
Calmar ratio is a similar measure that CTA investors are often interested in and is
defined as the average annual return over the past three years divided by the
absolute value of the maximum drawdown during that period.
c05_gregoriou.qxd 7/27/04 11:07 AM Page 86
We infer a direct correspondence between the efficiency score and expected
return. The CTA returns observed by Schneeweis and Georgiev (2002),
therefore, imply a positive coefficient. Finally, we note that the efficiency
scores used in this study minimize variability. This leads to the hypothesis
that the beta-squared coefficient is negatively correlated with the efficiency
score, unless the enhanced return from high (absolute) betas is an offset-
ting factor.
Fund Size In his chapter “The Lure of the Small,” Jaeger (2003) describes
how small firms and small portfolios are desirable features of hedge funds.
Small firms satisfy hedge fund managers’ entrepreneurial spirit, and small
portfolios are often necessary to enable hedge funds to implement their
strategies, especially if they trade in markets that are sometimes illiquid.
Gregoriou and Rouah (2002) find, however, that fund size does not matter
to hedge fund performance. Being a subset class of hedge funds, CTAs are
examined in this chapter to see if fund size or length of manager track
record is related to the DEA efficiency scores.
Determinants of Performance Based on the discussion above, we choose as
bases for performance evaluation in a DEA model monthly returns, kurto-
sis, minimum return, skewness, standard deviation of returns, and percent-
age of negative monthly returns. We then investigate the potential of fund
size, length of track record, strategy, and style to impact performance scores
of funds created by the DEA model.
DATA DESCRIPTION
Monthly CTA return data for 216 CTAs over two periods surrounding
March 2000 are obtained from the Center for International Securities and
Derivatives Markets (CISDM) Alternative Investment Database.
13
The first
period is an up-market period for the equity market (March 31, 1998, to
February 28, 2000) and the second period is a down market environment
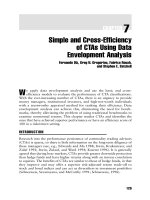
(April 30, 2000, to March 31, 2002). The daily high for the S&P 500
occurred in March 2000, as illustrated in Figure 5.1. The mean monthly
return for the S&P 500 was 1.28 percent and −1.11 percent for the first and
second periods, respectively.
CTA Performance Evaluation with Data Envelopment Analysis 87
13
We selected funds from the database with the most complete information on
investment styles and strategies.
c05_gregoriou.qxd 7/27/04 11:07 AM Page 87
Performance criteria used in the DEA model were calculated from the
CTA returns for each of the two periods. The DEA approach to “estimat-
ing” the efficient frontier is a nonstatistical approach. As a result, all devi-
ations from the efficient frontier are measured as inefficiency (i.e., there is
no allowance for statistical noise). The efficiency measures obtained from
this method are, therefore, very sensitive to the effect of outliers. Hence, for
each performance criterion used in the DEA model, particular effort was
made to detect any outliers. CTAs with outliers in one subperiod were
deleted from both subperiods so as to have the same group of CTAs. Our
final sample consisted of 157 CTAs that were used for analysis in the DEA
model and the subsequent Tobit regression analysis. Table 5.1 provides
descriptive statistics for the DEA model criteria over both periods and for
the full and final sample.
Other information we use from the CISDM Alternative Investment
Database includes the assets under management over time, the dates
the funds were established, and information on the investment style
14
88 PERFORMANCE
750
850
950
1,050
1,150
1,250
1,350
1,450
1,550
Date
11-Mar-98
18-May-98
24-Jul-98
30-Sep-98
7-Dec-98
16-Feb-99
23-Apr-99
30-Jun-99
7-Sep-99
11-Nov-99
20-Jan-00
28-Mar-00
5-Jun-00
10-Aug-00
17-Oct-00
22-Dec-00
5-Mar-01
10-May-01
18-Jul-01
28-Sep-01
5-Dec-01
14-Feb-02
24-Apr-02
1-Jul-02
6-Sep-02
12-Nov-02
Daily Closing Value
FIGURE 5.1 S&P 500 Daily Closing Values, from 1998 to 2002
14
We follow the terminology established by Sharpe (1992) and call the market focus
investment style.
c05_gregoriou.qxd 7/27/04 11:07 AM Page 88
TABLE 5.1 Descriptive Statistics for the DEA Model Criteria
Average
Original Data Standard % Monthly Minimum
Deviation Negative Return Skewness Return Kurtosis
Mean of CTAs 0.055 0.427 0.010 0.460 −0.091 1.637
Standard
All 216 CTAs Deviation 0.034 0.124 0.013 0.929 0.063 2.732
for 1998–2000 Min 0.005 0.042 −0.024 −2.120 −0.530 −1.524
Max 0.193 0.750 0.111 3.694 −0.006 16.370
Mean of CTAs 0.055 0.456 0.006 0.183 −0.103 1.223
Standard
All 216 CTAs Deviation 0.034 0.118 0.011 0.897 0.076 2.365
for 2000–2002 Min 0.004 0.125 −0.032 −4.442 −0.483 −1.328
Max 0.245 0.750 0.073 1.981 −0.003 20.812
Mean of CTAs 0.056 0.453 0.016 0.420 −0.093 1.040
Standard
157 CTAs Deviation 0.026 0.092 0.026 0.705 0.049 1.644
for 1998–2000 Min 0.022 0.292 −0.018 −1.516 −0.247 −1.498
Max 0.155 0.750 0.115 2.224 −0.012 6.249
Mean of CTAs 0.058 0.481 0.005 0.247 −0.109 0.635
Standard
157 CTAs Deviation 0.031 0.094 0.009 0.596 0.067 1.160
for 2000–2002 Min 0.013 0.208 −0.032 −1.570 −0.385 −1.328
Max 0.191 0.750 0.027 1.471 −0.018 4.748
89
c05_gregoriou.qxd 7/27/04 11:07 AM Page 89
(agriculture, currencies, diversified, financial, and stocks) and strategy
(discretionary, systematic, and trend-based
15
) of the fund. The diversified
investment style is most common, accounting for 59 percent of the CTAs
in our final sample, as illustrated in Table 5.2. Comprising 66 percent of
our final sample, the systematic investment strategy is the most common,
as indicated in Table 5.3. Table 5.4 describes the distribution of the
length of the managers’ track record (maturity) in years, and Table 5.5 pre-
sents the distribution of the average funds under management for the
two periods.
Table 5.6 presents correlation coefficients for the DEA model criteria.
We see that in both periods, minimum return and standard deviation are
highly (negatively) correlated, as one might expect. Kurtosis and skewness
are also highly (positively) correlated, but only in the first period. We note
that we are therefore potentially including redundant information in the
model. That is, by maximizing the minimum return, we may not necessar-
ily need to minimize correlated measures such as the standard deviation.
Following Daglioglu and Gupta (2003b), however, we sort the portfolios by
the various performance criteria and find that the returns to the sorted port-
90 PERFORMANCE
TABLE 5.2 Number of CTAs, by Investment Style
# of % of
Investment Style CTAs CTAs
Agriculture 6 4
Currency 20 13
Diversification 93 59
Financial 33 21
Stocks 5 3
Overall 157 100
15
We follow Fung and Hsieh (1997a) and refer to the type of active management
followed as the strategy, and we use the classification scheme available in the
CISDM database.
c05_gregoriou.qxd 7/27/04 11:07 AM Page 90
CTA Performance Evaluation with Data Envelopment Analysis 91
TABLE 5.3 Number of CTAs, by Investment Strategy
# of % of
Strategy CTAs CTAs
Discretionary 12 8
Systematic 103 66
Trend Based 42 27
Overall 157 100
TABLE 5.4 Length of Managers’ Track Record (Maturity) in Years
Length of Manager # of % of
Track Record CTAs CTAs
<6 8 5
6 – <7 19 12
7 – <8 15 10
8 – <9 28 18
9 – <10 10 6
10 – <11 9 6
11 – <12 13 8
12 – <13 17 11
13 – <14 5 3
14 – <15 2 1
15 – <16 9 6
16+ 22 14
Overall 157 100
folios are not as highly correlated as the variables themselves are. Table 5.7
presents these results.
After computing efficiency scores with the DEA methodology described
in the following section, determinants of the scores are explored by regress-
ing them against four additional variables: beta, beta-squared, average
funds managed, and length of manager track record. Table 5.8 presents the
summary statistics for these variables.
c05_gregoriou.qxd 7/27/04 11:07 AM Page 91
92 PERFORMANCE
TABLE 5.6 Correlation Coefficients for the DEA Model Criteria
1998–2000 Std. Dev. Per Neg Return Skewness Min Return Kurtosis
Standard Deviation 1.000
Percent Negative 0.320 1.000
Return 0.354 −0.478 1.000
Skewness 0.243 0.422 0.002 1.000
Minimum Return −0.838 −0.245 −0.133 0.124 1.000
Kurtosis 0.210 0.181 −0.065 0.648 −0.088 1.000
2000–2002 Std. Dev. PerNeg Return Skewness Min Return Kurtosis
Standard Deviation 1.000
Percent Negative 0.217 1.000
Return 0.271 −0.440 1.000
Skewness 0.124 0.308 0.235 1.000
Minimum Return −0.846 −0.167 0.037 0.287 1.000
Kurtosis 0.057 −0.133 −0.161 −0.417 −0.326 1.000
TABLE 5.5 Distribution of the Average Funds under Management
1998–2000 2000–2002
Average Average
Fund Fund
Managed # of % of Managed # of % of
(000,000) CTAs CTAs (millions) CTAs CTAs
<2.5 19 12 <2.5 23 15
2.5 – <5 14 9 2.5 – <5 17 11
5 – <10 13 8 5 – <10 17 11
10 – <20 25 16 10 – <20 15 10
20 – <30 8 5 20 – <30 17 11
30 – <40 14 9 30 – <40 11 7
40 – <50 6 4 40 – <50 9 6
50 – <100 27 17 50 – <100 14 9
100 – <150 7 4 100 – <150 8 5
150 – <200 2 1 150 – <200 5 3
200 – <400 14 9 200 – <400 15 10
400+ 8 5 400+ 64
Overall 157 100 Overall 157 100
c05_gregoriou.qxd 7/27/04 11:07 AM Page 92
TABLE 5.7 Top and Bottom Correlation Matrix for the DEA Model Criteria, by Portfolio
1998– Top Bottom Top Bottom Top Bottom Top Bottom Top Bottom Top Bottom Top Bottom
2000 Std.Dev. Std.Dev. PerNeg PerNeg COR COR Return Return Skew Skew MinRet MinRet Kurt Kurt
Top Std. Dev. 1
Bottom
Std. Dev. 0.125 1
Top
PerNeg −0.102 0.041 1
Bottom
PerNeg −0.094 0.054 −0.085 1
Top COR −0.109 0.138 0.004 0.111 1
Bottom
COR −0.027 0.082 0.015 −0.067 −0.075 1
Top
Return 0.147 −0.021 0.039 −0.042 −0.110 −0.003 1
Bottom
Return 0.041 −0.066 0.048 −0.122 −0.073 0.080 0.100 1
Top Skew 0.185 0.008 −0.065 0.138 0.047 0.045 −0.076 −0.041 1
Bottom
Skew −0.067 −0.087 −0.008 0.111 0.034 0.098 0.050 −0.029 0.025 1
Top
MinRet 0.023 −0.126 −0.206 0.089 −0.031 −0.002 −0.040 −0.089 0.050 1
Bottom
MinRet −0.061 −0.025 0.038 0.035 0.016 0.122 0.064 −0.097 −0.099 0.099 0.164 1
Top Kurt −0.006 0.076 0.083 0.013 −0.154 0.168 −0.006 −0.050 0.042 −0.018 0.086 0.057 1
Bottom
Kurt −0.006 0.276 0.059 0.040 −0.001 0.044 −0.010 0.025 0.066 −0.111 −0.178 −0.023 0.218 1
93
c05_gregoriou.qxd 7/27/04 11:07 AM Page 93
TABLE 5.7 (continued)
2000– Top Bottom Top Bottom Top Bottom Top Bottom Top Bottom Top Bottom Top Bottom
2002 Std.Dev. Std. Dev. PerNeg PerNeg COR COR Return Return Skew Skew MinRet MinRet Kurt Kurt
Top Std. Dev. 1
Bottom
Std. Dev. −0.051 1
Top
PerNeg −0.057 −0.009 1
Bottom
PerNeg −0.076 0.158 −0.027 1
Top COR 0.152 0.126 −0.061 −0.001 1
Bottom
COR −0.137 0.038 0.044 −0.044 −0.142 1
Top
Return −0.135 0.101 −0.078 −0.189 0.076 0.238 1
Bottom
Return 0.088 0.258 0.122 –0.082 0.089 −0.098 0.063 1
Top Skew −0.060 −0.163 −0.102 −0.138 0.146 −0.055 −0.052 0.070 1
Bottom
Skew 0.009 −0.002 −0.138 0.181 0.039 0.179 0.183 −0.028 1
Top
MinRet 0.052 −0.094 −0.201 0.106 −0.021 −0.014 −0.127 0.220 −0.012 −0.001 1
Bottom
MinRet 0.149 0.119 −0.041 −0.064 0.067 −0.037 −0.171 0.206 0.021 0.116 0.003 1
Top Kurt −0.112 0.131 −0.069 0.004 −0.009 0.071 0.032 0.076 −0.094 0.001 0.186 0.049 1
Bottom
Kurt 0.091 0.003 −0.139 0.114 0.146 0.088 0.003 −0.080 0.092 0.168 0.057 −0.035 −0.182 1
94
c05_gregoriou.qxd 7/27/04 11:07 AM Page 94
METHODOLOGY
Brief Background of Data Envelopment Analysis
Data envelopment analysis, a mathematical programming approach, was
first developed by Charnes, Cooper, and Rhodes (1978) to measure the effi-
ciency or performance of individual decision-making units (DMUs) in pro-
ducing multiple outputs from multiple inputs. Unlike a parametric
approach (like regression-based methods), which requires the researcher to
make sometimes arbitrary assumptions about the functional relationship
between inputs and outputs, the DEA approach does not require such
assumptions. It allows us to create an efficient frontier based on the input-
output combinations of the observed DMUs, without any apriori assump-
tions regarding the functional form of the relationship between them.
Consider an industry producing a vector of m outputs y = (y
1
,
y
2
, , y
m
) from a vector of n inputs, x = (x
1
, x
2
, , x
n
). Let the vectors
x
j
and y
j
represent, respectively, the input and output bundles of the j-th
decision-making unit. Suppose that input-output data are observed for N
DMUs. Then the technology set can be completely characterized by the pro-
duction possibility set T = {(x, y) : y can be produced from x} based on a
few regularity assumptions, which in case of variable returns to scale are:
CTA Performance Evaluation with Data Envelopment Analysis 95
TABLE 5. 8 Summary Statistics for Variables Used in Regression Analysis
Variables Mean Std. Dev. Min Max
Beta −0.068 0.205 −0.782 0.470
Beta Squared 0.046 0.096 0.000 0.612
Average Fund
Managed $90,659,049 $175,566,905 $86,542 $1,172,390,042
Length of
Manager
Track Record 11.055 4.362 5.667 22.167
Variables Mean Std. Dev. Min Max
Beta −0.063 0.294 −0.870 0.868
Beta Squared 0.090 0.159 0.000 0.756
Average Fund
Managed $92,303,454 $222,082,600 $92,542 $2,078,385,875
Length of
Manager
Track Record 11.055 4.362 5.667 22.167
c05_gregoriou.qxd 7/27/04 11:07 AM Page 95
1. All observed input-output combinations are feasible.
(x
j
, y
j
) ΠT; (j = 1,2, N)
2. T exhibits free disposability with respect to inputs.
(x
0
, y
0
) ΠT and x
1
≥ x
0
⇒ (x
1
, y
0
) ΠT
3. T exhibits free disposability with respect to outputs.
(x
0
, y
0
) ΠT and y
1
≤ y
0
⇒(x
0
, y
1
) ΠT
4. T is convex.
(x
0
, y
0
) ŒT and (x
1
, y
1
) ΠT
⇒ (lx
0
+ (1 − l)x
1
, ly
0
+ (1 − l)y
1
) ŒT; 0 ≤ l ≤ 1
Within the DEA approach, efficiency
16
can be measured based on either
of two orientations. The first yields an output-oriented measure of efficiency
that describes the maximum proportional increase in outputs that can be
achieved for the given level of inputs from the DMU. The second orientation
yields an input-oriented measure for the maximum proportional reduction
in inputs that can be achieved for the given level of outputs of the DMU.
Following Banker, Charnes, and Cooper (BCC) (1984) we can measure
the output-oriented efficiency of the i
th
DMU by solving this linear pro-
gramming problem:
17
Max f
i
Subject to
For an efficient DMU f
i
= 1, whereas for an inefficient DMU f
i
> 1.
On the other hand, an input-oriented measure of efficiency can be
obtained for the i
th
DMU by solving the linear programming problem:
λφ
λ
λ
λ
j
j
N
rj i ri
j
j
N
sj si
j
j
N
j
yyr m
xx s n
jN
=
=
=
∑
∑
∑
≥=
≤=
=
≥=
1
1
1
12
12
51
1
012
, , ,
, , ,
(.)
, , ,
96 PERFORMANCE
16
The concept of efficiency used here is that of technical efficiency. It is used in the
context of an expanded efficient frontier with n variables across n dimensions,
rather than just the two familiar mean and variance dimensions.
17
While the Charnes, Cooper, and Rhodes, (1978) model assumes constant returns
to scale, the model proposed by Banker, Charnes, and Cooper (1984) allows for
variable returns to scale.
c05_gregoriou.qxd 7/27/04 11:07 AM Page 96
Min q
i
Subject to
In this case an efficient DMU will have q
i
= 1, whereas an inefficient
DMU will have q
i
< 1.
One requirement of these two models is that the inputs and outputs
must not be negative. However, the BCC output-oriented model (5.1) is
invariant to input translations, and the BCC input-oriented model (5.2) is
invariant to output translations (see Ali and Seiford 1990). By choosing the
appropriate model, we are able to handle the case of negative outputs or
negative inputs by translation.
Application of DEA to the Study of CTA Performance
In this study our objective is to obtain a multicriteria measure of efficiency
for each individual CTA in our sample. Wilkens and Zhu (2001) provide a
motivation for applying DEA to measure the efficiency of an individual
CTA based on multicriteria. They also provide a detailed illustration of how
DEA can be used for the evaluation of CTA efficiency. Following a similar
approach, we measure the efficiency of each CTA by treating the standard
deviation of returns and proportion of negative returns as “inputs” in the
DEA model; we treat return (average monthly return), minimum return,
skewness, and kurtosis “outputs” in the DEA model.
18
Since many of our outputs were negative for several CTAs, we had to
translate them to obtain positive values.
19
(Table 5.1 shows the summary
λ
λ
θ
λ
λ
j
j
N
rj ri
j
j
N
sj i
si
j
j
N
j
yy r m
xx s n
jN
=
=
=
∑
∑
∑
≥=
≤=
=
≥=
1
1
1
12
12
52
1
012
, , ,
, , ,
(.)
, , ,
CTA Performance Evaluation with Data Envelopment Analysis 97
18
Our model differs from that of Wilkens and Zhu (2001) because we use kurtosis
as an additional “output” in our model.
19
These translations were used to make each of our outputs positive: (1) return: We
added 0.04 (i.e., 4 percent) to the return of each CTA; (2) minimum return: We added
1 to the minimum return of each CTA; (3) skewness: We added 5 to the skewness
of each CTA; (4) kurtosis: We added 3 to our original measure of excess kurtosis for
each CTA (thus obtaining measures of kurtosis rather than excess kurtosis).
c05_gregoriou.qxd 7/27/04 11:07 AM Page 97
statistics for the original data; Table 5.9 shows the summary statistics for
our translated data.) As a result of this translation, we chose the input-ori-
ented BCC model to measure the efficiency of each individual CTA since it
is invariant to output translations.
20
We follow Wilkens and Zhu (2001), but also add kurtosis to the model.
Although extreme value theory generally views kurtosis as indicative of more
risk, we take a more neutral approach by controlling for skewness, kurtosis,
and return outputs while minimizing standard deviation and the percent of
negative returns. One reason that we treat kurtosis as an output rather than
as an input to the DEA model is the fact that our input-oriented DEA model
only has limited ability to translate negative inputs. Another more compelling
reason is that in our sample of CTA returns, the mean skewness is positive,
indicating that extreme values are more often positive than negative.
Tobit Regressions: Explaining the Differences
in Efficiency of CTAs
Once we measure the input-oriented efficiency scores for the individual
CTAs in our sample, we address the question of what leads to the differ-
ences in efficiencies. We explore the potential for the size of the fund, the
length of the fund’s track record, its investment style, and investment strat-
egy to explain the degree of efficiency in terms of the DEA criteria (maxi-
mizing monthly returns, minimum returns, skewness, and kurtosis and
minimizing standard deviation of returns and percentage of negative
monthly returns). However, we cannot carry out standard ordinary least
squares (OLS) regression of efficiency scores (q
i
≤ 1) on the explanatory
variables because the efficiencies scores of a number of CTAs in our sample
are clustered at the upper limit of 1. Because the dependent variable, which
is the efficiency score, is censored, the appropriate model to use in this con-
text is a Tobit regression model, which is a limited-dependent-variable
model. (See Greene 2000.) In this study, therefore, we use Tobit regression
models to explain the differences in efficiencies across CTAs.
RESULTS
Table 5.10 presents the frequency distribution for the efficiency scores of all
157 CTAs. Overall, the scores are higher during the first (up-market) time
98 PERFORMANCE
20
We recognize that standard deviation and percentage of negative returns are not
really inputs that are used to produce the outputs (returns, minimum returns, skew-
ness, and kurtosis). Nevertheless, we use the terms “inputs” and “outputs” here
simply to convey clearly how each of these criteria is being used within the construct
of the DEA model.
c05_gregoriou.qxd 7/27/04 11:07 AM Page 98
TABLE 5.9 Summary Statistics for Translated Data Values of the DEA Model Criteria
Average
Original Inputs Standard Percent Monthly Minimum
& Adjusted Outputs Deviation Negative Return Skewness Return Kurtosis
Mean of CTAs 0.055 0.427 0.050 5.460 0.909 4.637
Standard
All 216 CTAs Deviation 0.034 0.124 0.013 0.929 0.063 2.732
for 1998–2000 Min 0.005 0.042 0.016 2.880 0.470 1.476
Max 0.193 0.750 0.151 8.694 0.994 19.370
Mean of CTAs 0.055 0.456 0.046 5.183 0.897 4.223
Standard
All 216 CTAs Deviation 0.034 0.118 0.011 0.897 0.076 2.365
for 2000–2002 Min 0.004 0.125 0.008 0.558 0.517 1.672
Max 0.245 0.750 0.113 6.981 0.997 23.812
Mean of CTAs 0.056 0.453 0.048 5.420 0.907 4.040
Standard
157 CTAs Deviation 0.026 0.092 0.008 0.705 0.049 1.644
for 1998–2000 Min 0.022 0.292 0.016 3.484 0.754 1.502
Max 0.155 0.750 0.072 7.224 0.988 9.249
Mean of CTAs 0.058 0.481 0.045 5.247 0.891 3.635
Standard
157 CTAs Deviation 0.031 0.094 0.009 0.596 0.067 1.160
for 2000–2002 Min 0.013 0.208 0.008 3.430 0.615 1.672
Max 0.191 0.750 0.067 6.471 0.982 7.748
99
c05_gregoriou.qxd 7/27/04 11:07 AM Page 99
period with an average efficiency of 76.5 percent, in contrast to an average
of 68.2 percent during the second (down-market) period.
Table 5.11 breaks the results down by investment style
21
(diversified
versus nondiversified) and shows that the mean and the standard deviation
of the two groups are very close. There is virtually no difference in the effi-
ciency scores between the two investment style groups.
Table 5.12 breaks the results down by investment strategy (systematic,
discretionary, and trend-following). There is weak evidence that the system-
atic strategy outperforms the other strategies on the basis of the performance
criteria used in this study. In both periods, the systematic strategy has the
highest mean efficiency score with a relatively low standard deviation.
Determinants of the efficiency scores (theta) are investigated using
Tobit regressions with efficiency score as the dependent variable. The vari-
ables include beta, beta-squared, average funds under management, length
of manager track record, and dummy variables for the investment styles and
strategies. Table 5.13 presents a correlation matrix for all of these variables.
Tables 5.14 through 5.16 provide the results of three Tobit regressions
and indicate that beta-squared is a significant factor inversely affecting the
efficiency scores during both time periods. Beta and the length of the man-
ager’s track record (maturity) also inversely impact the efficiency scores, but
100 PERFORMANCE
TABLE 5.10 Frequency Distribution for Efficiency Scores
Efficiency Range 1998–2000 2000–2002
<0.4 0 1
0.4 – <0.5 2 12
0.5 – <0.6 29 42
0.6 – <0.7 27 42
0.7 – <0.8 35 26
0.8 – <0.9 26 17
0.9 – <1 13 4
12513
Overall 157 157
Mean 0.765 0.682
Standard Deviation 0.158 0.153
Min 0.412 0.384
Max 1 1
21
Because there are so many diversified CTAs in the database, we group together all
of the CTAs that are not labeled as diversified. This results in only two groups:
diversified and nondiversified.
c05_gregoriou.qxd 7/27/04 11:07 AM Page 100
CTA Performance Evaluation with Data Envelopment Analysis 101
TABLE 5.11 Frequency Distribution of Efficiency Scores, by Investment Style
Diversified Nondiversified
1998– 2000– 1998– 2000–
Efficiency Range 2000 2002 2000 2002
<0.4 0 1 0 0
0.4 – <0.5 1 10 1 2
0.5 – <0.6 23 20 6 22
0.6 – <0.7 16 25 11 17
0.7 – <0.8 21 18 14 8
0.8 – <0.9 11 10 15 7
0.9 – <1 10 2 3 2
1 11 7 14 6
Sum 93 93 64 64
Mean 0.745 0.679 0.793 0.687
Standard Deviation 0.156 0.155 0.157 0.151
Min 0.412 0.384 0.443 0.469
Max 1 1 1 1
TABLE 5.12 Frequency Distribution of Efficiency Scores, by Investment Strategy
Discretionary Systematic Trend Based
Efficiency 1998– 2000– 1998– 2000– 1998– 2000–
Range 2000 2002 2000 2002 2000 2002
<0.4 0 1 0 0 0 0
0.4 – <0.5 1 1 1 6 0 5
0.5 – <0.6 3 5 18 26 8 11
0.6 – <0.7 2 1 14 28 11 13
0.7 – <0.8 0 1 26 18 9 7
0.8 – <0.9 3 0 15 14 8 3
0.9 – <1 0 0 10 3 3 1
13319832
Sum 12 12 103 103 42 42
Mean 0.755 0.671 0.778 0.695 0.736 0.655
Standard
Deviation 0.204 0.222 0.157 0.148 0.145 0.143
Min 0.412 0.384 0.443 0.402 0.508 0.450
Max 1 1 1 1 1 1
c05_gregoriou.qxd 7/27/04 11:07 AM Page 101
TABLE 5.13 Correlation Matrix for Variables Used in the Regression Analysis
AveMg Beta
1998–2000 Theta Beta Funds Maturity Squared
Theta 1
Beta −0.079 1
AveMgFunds −0.004 0.051 1
Maturity −0.186 −0.046 0.298 1
Beta-Squared −0.174 −0.524 −0.073 0.057 1
AveMg Beta
2000–2002 Theta Beta Funds Maturity Squared
Theta 1
Beta 0.028 1
AveMgFunds 0.024 −0.104 1
Maturity −0.088 0.143 0.205 1
Beta-Squared −0.245 −0.144 −0.055 0.093 1
Note: Theta represents the efficiency score from the DEA analysis.
TABLE 5.14 Results of Tobit Regressions
Variables 1998–2000 2000–2002
Intercept 0.7446 0.6276
(0.0544) (0.0502)
Beta −0.1651
***
−0.0336
(0.0595) (0.0362)
AvFunds 0.0008 0.0005
(0.0006) (0.0004)
Maturity −0.0060
**
−0.0024
(0.0025) (0.0024)
I 0.0192 −0.0081
(0.0222) (0.0209)
S2 0.0421 0.0750
*
(0.0442) (0.0433)
S3 0.0212 0.0460
(0.0462) (0.0464)
Beta-squared −0.3477
***
−0.1448
**
(0.1235) (0.0649)
The figures in parentheses are the standard errors.
I, S2, and S3 are dummy variables for non-diversified invest-
ment style, systematic investment strategy, and trend-based
investment strategy, respectively.
***
The coefficient is significant at 1 percent.
***
The coefficient is significant at 5 percent.
***
The coefficient is significant at 10 percent.
c05_gregoriou.qxd 7/27/04 11:07 AM Page 102
CTA Performance Evaluation with Data Envelopment Analysis 103
TABLE 5.16 Results of Tobit Regressions
Variables 1998–2000 2000–2002
Intercept 0.7727 0.6574
(0.0348) (0.0335)
Beta −0.1619
***
−0.0428
(0.0595) (0.0349)
AvFunds 0.0010
*
0.0005
(0.0006) (0.0004)
Maturity −0.0062
**
−0.0021
(0.0025) (0.0024)
S2 0.0217 0.0393
*
(0.0224) (0.0217)
Beta-squared −0.3622
***
−0.1531
**
(0.1221) (0.0625)
The figures in parentheses are the standard errors.
***
The coefficient is significant at 1 percent.
***
The coefficient is significant at 5 percent.
***
The coefficient is significant at 10 percent.
TABLE 5.15 Results of Tobit Regressions
Variables 1998–2000 2000–2002
Intercept 0.7912 0.6916
(0.0292) (0.0280)
Beta −0.1517
***
−0.0305
(0.0588) (0.0346)
AvFunds 0.0010 0.0005
(0.0006) (0.0005)
Maturity −0.0066
***
−0.0026
(0.0025) (0.0024)
Beta-squared −0.3515
***
−0.1692
***
(0.1221) (0.0626)
The figures in parentheses are the standard errors.
***
The coefficient is significant at 1 percent.
***
The coefficient is significant at 5 percent.
***
The coefficient is significant at 10 percent.
Note that Average Funds is significant at the 10.08 percent
level of significance during 1998 to 2000.
c05_gregoriou.qxd 7/27/04 11:07 AM Page 103