Commodity Trading Advisors: Risk, Performance Analysis, and Selection Chapter 4 ppsx
Bạn đang xem bản rút gọn của tài liệu. Xem và tải ngay bản đầy đủ của tài liệu tại đây (450.05 KB, 30 trang )
CHAPTER
4
CTA Performance,
Survivorship Bias,
and Dissolution Frequencies
Daniel Capocci
U
sing a database containing 1,892 funds (including 1,350 dissolved funds),
we investigate CTA performance and performance persistence to deter-
mine if some CTAs consistently and significantly outperform their peers over
various time periods. To test the persistence hypothesis, we use a methodol-
ogy based on Carhart’s (1997) decile classification. We examine performance
across deciles and across CTA strategies to determine if some deciles are
more exposed to certain strategies over time. We also analyze survivorship
bias and its evolution over time. We conclude the study by analyzing the dis-
solution frequencies across deciles and their evolution over time.
INTRODUCTION AND LITERATURE REVIEW
Unlike hedge funds, which appeared in the first academic journal in 1997,
commodity trading advisors (CTAs) have been studied for a longer time.
Many studies were published in the late 1980s and in the early 1990s
(see, e.g., Elton, Gruber, and Rentzler 1987, 1989, 1990; Edwards and Ma
1988). More recently, Billingsley and Chance (1996) and Edwards and Park
(1996) showed that CTA funds can add diversification to stocks and bonds
in a mean-variance framework. According to Schneeweis, Savanayana, and
McCarthy (1991) and Schneeweis (1996), the benefits of CTAs are similar
to those of hedge funds, in that they improve and can offer a superior risk-
adjusted return trade-off to stock and bond indices while acting as diversi-
fiers in investment portfolios.
Fung and Hsieh (1997b) showed that a constructed CTA style factor
persistently has a positive return when the Standard & Poor’s (S&P) has a
49
c04_gregoriou.qxd 7/27/04 11:05 AM Page 49
negative return. According to Schneeweis, Spurgin, and Georgiev (2001),
CTAs are known to short stock markets regularly. Fung and Hsieh (2001a)
analyzed CTAs and concluded that their impact on portfolios is similar to
that of a lookback call and a lookback put.
1
Gregoriou and Rouah (2003a)
examined whether CTA percent changes in net asset values (NAVs) follow
random walks. They found all classifications (except the diversified
subindex) to behave as random walks. The effectiveness of CTAs in enhanc-
ing risk-return characteristics of portfolios could be compromised when
pure random walk behavior is identified. Kat (2002) found that allocating
to managed futures allows investors to achieve a very substantial degree of
overall risk reduction at limited costs. Managed futures appear to be more
effective diversifiers than hedge funds.
Regarding performance, Edwards and Caglayan (2001) concluded that
during bear markets, CTAs provide greater downside protection than hedge
funds and have higher returns along with an inverse correlation with stocks
returns in bear markets. Schneeweis and Georgiev (2002) concluded that
careful inclusion of CTA managers into investment portfolios can enhance
their return characteristics, especially during severe bear markets. Schneeweis,
Spurgin, and McCarthy (1996) observed that performance persistence was
virtually inexistent between 1987 and 1995. There is little information on
the long-term diligence of these funds (Edwards and Ma 1998; Irwin, Kruke-
meyer, and Zulauf 1992; Kazemi 1996). Schwager (1996) reviews the litera-
ture on CTA performance persistence and conducts his own analysis. He
found little evidence that the top-performing funds can be predicted.
According to Worthington (2001), between 1990 and 1998 the correlation
of managed futures to the S&P 500 during its best 30 months was 0.33 and
−0.25 during its worst 30 months. According to Georgiev (2001), one of the
drawbacks of CTAs is that during bull markets, their performance is gener-
ally inferior to those of hedge funds.
Brorsen and Townsend (2002) show that a minimal amount of per-
formance persistence is found in CTAs, and there could exist some advan-
tages in selecting CTAs based on past performance when a long time series
of data is available and accurate methods are used.
This chapter aims to detect performance persistence of CTAs. We want
to determine if some CTAs consistently outperform their peers over time. In
50 PERFORMANCE
1
A lookback call is a normal call option, but the strike depends on the minimum
stock price reached during the life of the option. A lookback put is a normal put
option, but the strike depends on the maximum stock price reached during the life
of the option.
c04_gregoriou.qxd 7/27/04 11:05 AM Page 50
the next section, we describe the database, reporting the descriptive statis-
tics of the funds and analyzing the correlation between the various strate-
gies reported. The following section focuses on survivorship bias. We
analyze the presence of this bias over the whole period studied but also over
different time periods, including a bull and a bear market period. Further,
we report the methodology used to analyze CTA performance and per-
formance persistence before reporting the results of the performance analy-
sis in the next section. The next section reports the results of the persistence
analysis and analyzes the exposure of the deciles constructed on previous
year’s performance to the individual strategies. Then we report the complete
analysis of monthly and yearly dissolution frequencies.
DATABASE
In this section, we present our database and analyze the descriptive statistics
of the data before reporting the correlation between the various strategies.
Descriptive Statistics
There are several CTA data providers. The providers most commonly used
in academic studies are Managed Account Repots, TASS Management, and
the Barclay Trading Group, Ltd. The latter represents one of the most (if
not the most) comprehensive managed future databases.
For our analysis we use the Barclay Trading Group database, which
contains 1,892 individual funds (including 1,350 dissolved funds) over the
January 1985 to December 2002 period. The Barclay Trading Group clas-
sifies these funds in 7 categories that are subdivided in 17 strategies plus the
no-strategy category. We grouped some strategies because they contain too
few funds to give interesting results. As shown in Table 4.1, we obtained a
total of 11 strategies. Note that we combined only those strategies that are
in the same category.
To perform our performance analysis, we will use the whole database
and the classifications reported in Table 4.1. This will allow us to determine
whether results differ across strategies and whether funds in particular
strategies significantly outperform others.
Previous studies often focused on fewer funds. For example, Schneeweis,
Spurgin, and McCarthy (1996) studied 56 CTA funds from 1985 to 1991.
Irwin, Zulauf, and Ward (1994) used a database containing 363 CTAs
from 1979 to 1989. Other studies were larger. For example, Edwards and
Park (1996) found 596 CTAs from 1983 to 1992 by supplementing the
MAR/LaPorte CTA database with private sources. Diz (1996) and Fung and
Hsieh (1997b) had 925 and 901 managed future programs from 1975 to
CTA Performance, Survivorship Bias, and Dissolution Frequencies 51
c04_gregoriou.qxd 7/27/04 11:05 AM Page 51
1995, and from 1986 to 1996 respectively. They were both based on the
Barclay Trading Group database.
Funds in the Barclay Trading Group database can be classified into
more than one strategy. This can lead to a bias when we compare different
strategies since they can contain the same funds. In order to deal with this
issue, we report each fund in one strategy only.
2
Before entering the body of the study, we analyze the composition of
the database. Table 4.2 reports the descriptive statistics of the database.
Funds are classified according to strategy. The last line reports the statistics
for the whole database.
52 PERFORMANCE
TABLE 4.1 Grouping of Barclay Trading Group Strategies
Grouped CTA Barclay Trading
Strategies Group Strategy
Technical Diversified Technical Diversified
Technical Financial/Metals Technical Financial/Metals
Technical Currency Technical Currency
Other Technical Technical Interest Rate
Technical Energy
Technical Agricultural
Fundamental Fundamental Diversified
Fundamental Interest Rate
Fundamental
Financial/Metals
Fundamental Energy
Fundamental Currency
Fundamental
Agricultural
Discretionary Discretionary
Systematic Systematic
Stock Index Stock Index
Arbitrage Arbitrage
Option Strategies Option Strategies
No Category No Category
Note: The left-hand side of the table reports the strategy classifica-
tion used throughout the study; the right-hand side contains the
original classification of the Barclay Trading Group.
2
Any fund that is reported in two strategies is classified into the one that contains
the most funds.
c04_gregoriou.qxd 7/27/04 11:05 AM Page 52
TABLE 4.2 Descriptive Statistics
CTA January 1985–December 2002
Strategies (216 months)
No. of % of Living Dead Mean t(mean) Std. Sharpe
Funds the Total Funds Funds Return = 0 Dev. Median Min Max Skewness Kurtosis Ratio
Technical
Diversified 264 14% 44 220 1.72 5.38 4.70 0.83 −6.9 31.6 3.02 14.68 0.28
Technical
Financial/
Metals 86 5% 11 75 1.78 6.33 4.12 0.95 −5.2 29.8 2.95 14.11 0.33
Technical
Currency 58 3% 18 40 1.58 6.49 3.58 1.07 −14.5 15.6 0.64 3.73 0.33
Other technical 8 0% 0 8 3.18 5.35 7.25 1.92 −18.7 47.5 2.00 9.58 0.38
Total technical 416 22% 73 343 1.75 6.33 4.06 0.72 −5.2 25.3 2.92 13.27 0.33
Fundamental 19 1% 2 17 1.83 3.55 7.60 1.17 −20.4 57.4 2.48 16.14 0.19
Discretionary 299 16% 67 232 2.03 9.93 3.01 1.31 −3.9 18.8 2.42 9.24 0.54
Systematic 897 47% 350 547 1.70 4.73 5.27 0.83 −8.3 26.4 1.86 6.35 0.24
Stock Index 52 3% 16 36 1.89 4.39 6.33 1.14 −18.4 38.4 2.05 10.46 0.23
Arbitrage 27 1% 2 25 1.25 5.76 3.19 1.07 −14.8 12.0 −0.36 4.28 0.26
Option strategy 9 0% 0 9 2.62 4.66 8.24 2.57 −23.3 36.5 0.53 2.51 0.27
No Category 180 9% 28 152 1.62 6.20 3.84 0.95 −4.9 28.5 3.14 15.07 0.31
Total 1,899 100% 611 1,288 1.75 6.51 3.95 0.98 −5.2 21.9 2.37 9.06 0.34
t(mean) = 0 reports the t-statistic for the hypothesis that the mean monthly returns equal zero. Std. Dev. = standard deviation;
Min = minimum; Max = maximum. The Sharpe ratio is calculated with a 5 percent risk-free rate.
Note: The other technical strategy funds exist only for the August 1985–May 1995 period and for the October 1998–April 2001
period. Option strategy funds exist since September 1990.
53
c04_gregoriou.qxd 7/27/04 11:05 AM Page 53
Table 4.2 indicates that the systematic strategy is the most represented
strategy (with 897 funds) followed by total technical funds (416 funds) and
discretionary funds (299 funds). Other technical funds, option strategy
funds, and fundamental funds count only 8, 9, and 19 funds respectively.
The database contains 611 dissolved funds as a whole, 350 of which follow
the systematic strategy. Note that all the other technical funds and option
strategy funds are dissolved over the period studied. The median returns
indicate the same patterns.
Regarding the statistics, the highest mean monthly return is achieved
by the other technical funds (with 3.18 percent per month) followed by
the option strategy funds and discretionary funds (with 2.62 percent and
2.03 percent per month). Many strategies offer a monthly return of between
1.6 percent and 1.9 percent per month. The lowest returns are those of the
arbitrage funds (with 1.25 percent) followed by the technical currency
funds (with a monthly return of 1.58 percent). All the monthly returns are
significantly different from zero over the period studied.
The fundamental funds and the other technical funds are the more
volatile funds with a standard deviation of 7.60 and 7.25 percent. Because
there are few funds applying these strategies, there is no diversification
effect, which can explain why the returns of these strategies are so volatile.
The strategies that offer the most stable returns are the discretionary funds
(with a standard deviation of 3.01 percent) and the arbitrage funds (with a
standard deviation of 3.19 percent).
As one could expect, the strategies that are the most volatile also have
the lowest minimum return and the highest maximum return. The monthly
minimum returns can reach −20.4 percent for the fundamental strategy
whereas the maximum of this strategy is 57.4 percent. The returns are
usually positively skewed (the only exception is the arbitrage strategy)
and their distributions tend to have fat tails, as evidenced by the large values
for kurtosis.
When risk and returns are considered together through the Sharpe
ratio,
3
the discretionary funds emerge with the highest Sharpe ratio (0.54)
followed by other technical funds (with 0.38). Fundamental funds offer a
Sharpe ratio of only 0.19.
Correlation Analysis
Table 4.3 reports the correlation coefficients between the various strategies
for the January 1985 to December 2002 period. It indicates that the CTA
54 PERFORMANCE
3
The Sharpe ratio is the ratio of the excess return over the standard deviation. We
use a risk-free rate of 5 percent for this calculation.
c04_gregoriou.qxd 7/27/04 11:05 AM Page 54
55
TABLE 4.3 Correlation between the CTA Strategies, January 1985 to December 2002
Allcta Arb Discret Funda Option Stock System Teccur Tecdiv Tecfin Tecoth Nocat
AllCTA 1.00 −0.18 0.41 0.25 0.12 0.26 0.98 0.68 0.93 0.73 0.14 0.81
Arb −0.18 1.00 0.20 −0.02 0.08 0.05 −0.21 −0.18 −0.13 −0.05 0.24 −0.01
Discret 0.41 0.20 1.00 0.14 0.13 0.18 0.27 0.16 0.42 0.27 0.00 0.32
Funda 0.25 −0.02 0.14 1.00 0.01 0.08 0.22 0.17 0.22 0.20 −0.02 0.12
Option 0.12 0.08 0.13 0.01 1.00 0.62 0.12 −0.01 0.03 0.11 0.02 0.12
Stock 0.26 0.05 0.18 0.08 0.62 1.00 0.25 0.09 0.14 0.13 0.01 0.29
System 0.98 −0.21 0.27 0.22 0.12 0.25 1.00 0.70 0.89 0.71 0.18 0.79
Teccur 0.68 −0.18 0.16 0.17 −0.01 0.09 0.70 1.00 0.56 0.56 0.12 0.56
Tecdiv 0.93 −0.13 0.42 0.22 0.03 0.14 0.89 0.56 1.00 0.66 0.05 0.73
Tecfin 0.73 −0.05 0.27 0.20 0.11 0.13 0.71 0.56 0.66 1.00 0.10 0.50
Tecoth 0.14 0.24 0.00 −0.02 0.02 0.01 0.18 0.12 0.05 0.10 1.00 0.9
Nocat 0.81 −0.01 0.32 0.12 0.12 0.29 0.79 0.56 0.73 0.50 0.09 1.00
AllCTA = CTA Global Index; Arb = arbitrage; Discret = discretionary; Funda = fundamental; Stock = stock index; System =
systematic funds; Teccur = technical currency; Tecdiv = technical diversified; Tecfin = technical financial/metals; Tecoth = other
technical; Nocat = no category.
c04_gregoriou.qxd 7/27/04 11:05 AM Page 55
56 PERFORMANCE
global index is almost exactly correlated with the systematic funds. This can
be partly explained by the fact that this strategy contains the greatest num-
ber of funds. Forty-four coefficients out of sixty-six (66 percent of the co-
efficients) are under 0.5, indicating that most of the strategies are not
correlated. The lowest coefficient is the one between arbitrage and system-
atic funds at −0.21. There are nine negative coefficients in total represent-
ing 14 percent of the coefficients.
SURVIVORSHIP BIAS
Performance figures are subject to various biases. One of the most impor-
tant is the survivorship bias that appears when only surviving funds are
taken into account in a performance analysis study. The common practice
among suppliers of CTA databases is to provide data on investable funds
that are currently in operation. When only living funds
4
are considered, the
data suffer from survivorship bias because dissolved funds tend to have
worse performance than surviving funds.
Survivorship bias has already been studied. Fung and Hsieh (1997b)
precisely analyzed this bias and estimated it at 3.4 percent per year. They
also concluded that survivorship bias had little impact on the investment
styles of CTA funds. Returns of both surviving and dissolved CTA funds
have low correlation to the standard asset classes.
Survivorship Bias over Various Time Periods
Here we analyze the presence of survivorship bias in CTAs returns over var-
ious long-term time periods. We first study the whole period covered before
dividing it into subperiods.
Table 4.4 reports the survivorship bias obtained from our database.
Survivorship bias is calculated as the performance difference between sur-
viving funds and all funds. All returns are monthly and net of all fees. The
first part of the table indicates a survivorship bias of 5.4 percent per year
for the entire period. This figure is higher than the one obtained in previous
studies. Table 4.4 shows the bias was higher during the 1990 to 1994
period (7.3 percent) and during the 1995 to 1999 period (6.2 percent) but
lower during the 2000 to 2003 period (4.4 percent).
4
By “living funds” we mean funds still in operation at the moment of the analysis.
c04_gregoriou.qxd 7/27/04 11:05 AM Page 56
CTA Performance, Survivorship Bias, and Dissolution Frequencies 57
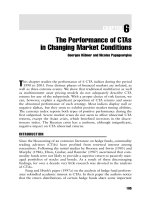
Survivorship Bias over Time
Figure 4.1 reports the evolution of the survivorship bias calculated on a
three-year rolling period starting January 1985 to December 1987 and end-
ing January 2000 to December 2002. It allows us to analyze more precisely
how the survivorship evolves over time.
0.00
0.10
0.20
0.30
0.40
0.50
0.60
0.70
0.80
0.90
1.00
88 88 89 89 90 90 91 91 92 92 93 93 94 94 95 95 96 96 97 97 98 98 99 99 00 00 01 01 02 02
FIGURE 4.1 Evolution of the Survivorship Bias (3-year Rolling Period)
Our database contains 1,899 CTAs (611 survived funds and 1,288 dissolved funds
as of December 2002). Numbers on the vertical axis are monthly percentages.
TABLE 4.4 Survivorship Bias Analysis over Different Periods
Bias 1985–2003 0.5 per Month
5.4 per Year
Bias 1985–1989 0.5 per Month
5.5 per Year
Bias 1990–1994 0.6 per Month
7.3 per Year
Bias 1995–1999 0.5 per Month
6.2 per Year
Bias 2000–2003 0.4 per Month
4.4 per Year
Our database contains 1,899 CTAs (611 survived funds and
1,288 dissolved funds as of December 2002).
c04_gregoriou.qxd 7/27/04 11:05 AM Page 57
58 PERFORMANCE
5
We take a month as a positive month if the whole database has a positive per-
formance. We consider a month as negative if the whole database does not reach
positive returns.
The figure indicates that the monthly bias ending January 1985
increases from around 0.7 percent at the beginning of the year to 0.85 per-
cent after summer before reaching the bottom of 0.9 percent at the begin-
ning of 1989. Afterward, it increases until January 1993 (0.9 percent) and
then decreases to a mean around 0.55 percent for the periods ending between
January 1994 and January 2000. Because the three-year periods end Janu-
ary 2000, the monthly survivorship bias decreases almost constantly
to 0.12 percent in December 2002.
We analyze these results to determine how such variations are possible.
On one hand, the sharp decrease in the January 1989 results (and the slow
increase that follows) can be explained by the fact that the surviving funds
underperformed the whole database in 1988 and 1989. The first underper-
formance was in December 1988 (1.87 percent for the surviving funds
against 2.94 percent for the whole database). Moreover, this was the first
major underperformance, which has been followed by others during the
negative months in 1989 (e.g., −3.9 percent against −1.85 percent in March,
−2.54 percent against −0.91 percent in April). On the other hand, the sharp
increase in survivorship bias over the period ending November and Decem-
ber 1992 can be explained mainly by high overperformance in June, July,
and August 1992 with an average of 3 percent monthly outperformance. To
summarize, this figure identifies epochs during which surviving funds out-
performed the whole database, and during which the difference between
surviving funds and dissolved funds was less important.
We also analyze the survivorship bias calculated over the positive
and negative months
5
for the whole database. Interestingly, Table 4.5 indi-
cates that the mean survivorship bias is the same over the three periods
studied at 0.48 percent. The standard deviation and the median of the
survivorship are also almost equal. The only significant difference is in
the minimum three-year rolling period, which is much higher for the nega-
tive months at 0.13 percent versus 0.06 percent for the whole period
and the positive months. The maximum is also almost equal between 0.87
percent and 0.90 percent.
METHODOLOGY
The aim of this study is to determine if some CTAs consistently and per-
sistently outperform their peers. To achieve this objective, we construct a
CTA Global Index that contains all the funds present in our database and
c04_gregoriou.qxd 7/27/04 11:05 AM Page 58
one index per CTA strategy. To test if some funds significantly outperform
the indices, we use the following regression.
R
pt
= a
P
+ b
p1
R
It
+ e
pt
(4.1)
p = 1 to 1,899 and t = 1 to 216
where R
Pt
= return of CTA p at period t
R
It
= return of the index considered at period t
We run this analysis for each fund compared to the whole CTA data-
base index but also for each fund compared to its strategy index. Once we
obtain results, we want to determine if momentum is present in CTA
returns. Active CTA selection strategies could increase the expected return
on a portfolio if CTA performance is really predictable. We define the
hypothesis that a CTA with an above-average return in this period also will
have an above-average return in the next period as the hypothesis of per-
sistence in performance. Sirri and Tufano (1998) and Zheng (1999) stressed
the importance of persistence analysis in mutual funds. They document
large inflows of money into last year’s best performers and withdrawals
from last year’s losers. Capocci and Hübner (2004) have stressed this for
hedge funds. They find that newly invested money in these best-performing
mutual funds is a predictor of future fund performance.
We apply the methodology of Carhart (1997) to our simple model. All
funds are ranked based on their previous year’s return. Every January we
place all funds into 10 equally weighted portfolios, ranked from highest to
lowest past returns. Portfolios 1 (High) and 10 (Low) are then further
subdivided on the same measure. The portfolios are held until the following
January and then rebalanced. This yields a time series of monthly returns on
each decile portfolio from January 1985 to December 2002. Funds that dis-
appear during the course of the year are included in the equal-weighted aver-
age until they disappear, then portfolio weights are readjusted appropriately.
CTA Performance, Survivorship Bias, and Dissolution Frequencies 59
TABLE 4.5 Descriptive Statistics of the 3-Year Rolling-Period Survivorship Bias
Mean Std. Dev. Median Min Max
Whole period 0.48 0.18 0.51 0.06 0.90
Positive months 0.48 0.18 0.51 0.06 0.90
Negative months 0.48 0.18 0.52 0.13 0.87
Std. dev. = standard deviation; Min = minimum; and Max = maximum of the 3-year
rolling-period survivorship bias calculated over the whole period studied (January
1985–December 2002).
c04_gregoriou.qxd 7/27/04 11:05 AM Page 59
Finally, in the last part of the study we want to determine empirically if
some strategies are consistently better than others. To achieve this objective
we use the next regression.
(4.2)
P = 1 to 10 and t = 1 to 216
where R
Dt
= return of decile P at period t
R
It
= return of the 12 indexes (CTA Global Index, technically
currency, technically diversified, technically financial/metals,
technically others, stock index, options, systematic, arbitrage,
discretionary, fundamental, no category) at period t
We regress each decile against the CTA Global Index and each strategy
index. Doing so, we determine if some deciles are exposed to some strate-
gies, which indicates that that strategy is particularly present in the corre-
sponding decile.
PERFORMANCE ANALYSIS
Here we apply the model just discussed to our database to determine if
some strategies significantly outperform the CTA Global Index over differ-
ent time periods. In the next section we investigate whether momentum
exists in CTA performance.
Table 4.6 indicates some interesting results. First, we see that results are
different across strategies, indicating that the classification in substrategies
seems to be relevant. Second, the first column of the table reports the alpha
of the different strategies once the performance of the CTA database con-
sidered as a whole is taken into account through the CTA Global Index.
This is the performance not explained by the global CTA index. Seven out
of the 11 strategies are significantly positive at the 5 or 1 percent signifi-
cance level (technically financial/metals, technically currency, technically
other, discretionary, stock index, arbitrage, and option strategies); two are
not significantly different from zero (fundamental and no category); and
two are significantly negative (technically diversified and systematic). These
results indicate that all but two strategies produce returns significantly dif-
ferent from zero, which means that the individual strategies produce returns
significantly different from their aggregation.
6
RR
Dt P P
i
It Pt
=+ +
=
∑
αβ ε
1
1
12
60 PERFORMANCE
6
The CTA Global Index is composed of all the individual funds classified in the var-
ious strategies. It is the same funds classified differently.
c04_gregoriou.qxd 7/27/04 11:05 AM Page 60
The positive alphas range from a monthly percentage difference of 0.65
percent for technically financial/metals to 2.03 percent for option strategies;
the negative alphas are −0.28 percent for technically diversified funds and
−0.58 percent for systematic funds.
Third, most betas are significantly positive at the 1 percent significance
level. For four strategies (fundamental, stock index, arbitrage, and option)
the beta is either significant at the 10 percent level or not significant. These
strategies all contain 52 funds or less, which means that they represent only
a small part of the index. This fact partly explains their limited exposure to
the CTA Global Index.
Finally, the R
2
column reports very different numbers. The R
2
ranges
from 0.00 for stock funds to 0.95 for systematic funds. As we could have
expected, the highest R
2
are obtained when the alphas are the lower and
particularly low when the beta is not significant.
Table 4.7 reports the same results over different subperiods. We divide
the analysis in three six-year periods (January 1985 to December 1990, Jan-
CTA Performance, Survivorship Bias, and Dissolution Frequencies 61
TABLE 4.6 Relative Performance Analysis of Strategy Indices
Alpha CTA Index R
2
Technically diversified −0.28
***
1.14
***
0.92
Technically financial and metals 0.65
**
0.64
***
0.38
Technically currency 0.92
***
0.38
***
0.18
Technically other 2.56
***
0.33
**
0.04
Fundamental 0.52 0.56
*
0.08
Discretionary 1.23
***
0.39
***
0.29
Systematic −0.58
***
1.30
***
0.95
Stock 1.86
***
−0.07 0.00
Arbitrage 1.01
***
0.12
*
0.02
Option 2.03
***
0.53 0.03
No category 0.16 0.83
***
0.74
This table reports the results of the regression from the strategy subindices to the
whole database for the January 1985 to December 2002 period except for techni-
cally others (August 1985 to May 1995 and October 1998 to April 2001) and for
option strategies (September 1990–December 2002).
t-stat are heteroskedasticity consistent.
***Significant at the 1 percent level.
**Significant at the 5 percent level.
*Significant at the 10 percent level.
Numbers in the table are monthly percentages.
c04_gregoriou.qxd 7/27/04 11:05 AM Page 61
TABLE 4.7 Subperiod Performance Analysis of the Various CTA Strategies
Panel 1: Subperiod analysis
Jan 1985–Dec 1990 Alpha CTA Index R
2
Jan 1991–Dec 1996 Alpha CTA Index R
2
Tech divers. −0.52
**
1.20
***
0.94 Tech divers. −0.08 1.04
***
0.89
Tech fin/met 1.55
**
0.58
***
0.30 Tech fin/met 0.44
**
0.74
***
0.62
Tech currency 1.73
***
0.24
**
0.08 Tech currency 0.30 0.85
***
0.48
Tech other 3.82
***
0.25
*
0.03 Tech other 1.18 0.60 0.07
Fundamental 1.46 0.53 0.08 Fundamental 0.69 0.52
**
0.07
Discretionary 2.53
***
0.36
***
0.26 Discretionary 0.93
***
0.29
***
0.22
Systematic −1.25
***
1.30
***
0.96 Systematic −0.50
***
1.48
***
0.97
Stock 3.66
***
−0.28 0.03 Stock 0.54
*
0.44
**
0.17
Arbitrage 2.49
***
0.15
**
0.10 Arbitrage 0.54
***
0.08 0.01
Option NA NA NA Option 1.29 0.79 0.04
No category 0.50
*
0.90
***
0.78 No category 0.04 0.62
***
0.78
Panel 1 (cont.): Subperiod analysis Panel 2: Bull market analysis
Jan 1997–Dec 2002 Alpha CTA Index R
2
Jan 1998–Mar 2000 Alpha CTA Index R
2
Tech divers. −0.09 0.92
***
0.85 Tech divers. −0.46
**
1.11
***
0.89
Tech fin/met 0.10 0.58
***
0.44 Tech fin/met 0.56
**
0.46
***
0.43
Tech currency 0.49
***
0.49
***
0.33 Tech currency 0.86
**
0.37
**
0.17
Tech other 2.64
*
−0.29 0.01 Tech other NA NA NA
Fundamental −0.35 0.47 0.03 Fundamental 0.72 0.07 0.00
Discretionary 0.62
***
0.24
***
0.13 Discretionary 0.81
**
0.37
**
0.15
Systematic −0.26
***
1.37
***
0.98 Systematic −0.37
***
1.4
***
0.98
Stock 1.21
***
0.20 0.03 Stock 2.67
***
−0.20 0.02
62
c04_gregoriou.qxd 7/27/04 11:05 AM Page 62
TABLE 4.7 (continued)
Jan 1997–Dec 2002 Alpha CTA Index R
2
Jan 1998–Mar 2002 Alpha CTA Index R
2
Arbitrage 0.73
*
−0.75
***
0.20 Arbitrage 0.51 −0.86
***
0.27
Option 2.58
***
0.25 0.01 Option 3.73
***
−0.64 0.05
No category 0.34
***
0.44
***
0.39 No category 0.36
**
0.23 0.19
Panel 2 (cont.): Bear market analysis Panel 3: 10-year analysis
April 2000–Dec 2002 Alpha CTA Index R
2
Jan 1993–Dec 2002 Alpha CTA Index R
2
Tech divers. 0.08 0.84
***
0.87 Tech divers. −0.10 1.00
***
0.85
Tech fin/met 0.15 0.49
***
0.40 Tech fin/met 0.14 0.71
***
0.51
Tech currency 0.22 0.51
***
0.39 Tech currency 0.36
***
0.58
***
0.33
Tech other 3.43
*
−0.50 0.04 Tech other 1.72
*
−0.23 0.01
Fundamental −1.81
*
0.93
*
0.11 Fundamental 0.62 0.34 0.02
Discretionary 0.56
***
0.17
**
0.11 Discretionary 0.70
***
0.32
***
0.20
Systematic −0.21
***
1.35
***
0.98 Systematic −0.33
***
1.36
***
0.97
Stock 0.42 0.24 0.05 Stock 0.99
***
0.21
*
0.03
Arbitrage 1.33
**
−0.90
**
0.24 Arbitrage 0.72
***
−0.43
**
0.09
Option 1.59
**
0.26 0.02 Option 2.20
***
0.18 0.00
No category 0.28 0.54
***
0.45 No category 0.33
***
0.48
***
0.49
t-stat are heteroskedasticity consistent.
Tech. divers. = technical diversified; tech. fin/met = technical financial/metals; tech. cur = technical currency; tech. other = other
technical; stock = stock index.
***Significant at the 1 percent level.
**Significant at the 5 percent level.
*Significant at the 10 percent level.
Numbers in the table are monthly percentages.
63
c04_gregoriou.qxd 7/27/04 11:05 AM Page 63
uary 1991 to December 1996, January 1997 to December 2002) in Panel 1
before isolating bull and bear market periods in the last subperiod in Panel
2. These periods are January 1998 to March 2000 for the bull market and
April 2000 to December 2002 for the bear market. This last analysis is par-
ticularly interesting because we can determine how the strategies perform
compared to their peers during a bull and a bear market. For information
purposes we also include a 10-year analysis in Panel 3.
Results reported in Panel 1 indicate that few alphas change sign over the
subperiods, and no alpha that was significantly positive or negative for the
whole period becomes significantly negative or positive over the subperiods.
The first line indicates that technically diversified funds underperform
the CTA Global Index over each subperiod, but this underperformance is
significant only over the first and last subperiods. Panel 2 indicates that this
strategy underperforms during the bull market and that it slightly outper-
forms (but not significantly) during the bear market. Over a 10-year period,
this strategy slightly underperformed. The adjusted R
2
is high over each of
the subperiods analyzed.
Panel 1 indicates that technically financial/metals, technically currency,
technically other, stock funds, arbitrage, option, and no category funds out-
perform over some subperiods and are in line with the CTA Global Index
over other. Discretionary and systematic funds always outperform their
peers. Fundamental funds never significantly add to the performance of the
CTA Global Index.
Panel 2 is interesting because it indicates when specific strategies per-
form better than their peers. Technically financial/metals and technically
currency, stock funds, and the no-category funds perform better than their
peers during bull markets, while arbitrage funds perform better during bear
markets. Technically diversified funds significantly underperform in bull
markets without deviating significantly from their peers in bear markets.
Discretionary, systematic, and option funds always perform better than
their peers whereas systematic funds always perform worse. Finally, funda-
mental funds perform in line with the CTA Global Index.
Let us now compare the subperiods one by one instead of analyzing
how a strategy performed over each subperiod. In Panel 1, we see that few
alphas are significant over the January 1991 to December 1996 period. This
indicates that most of the strategies are in line with the CTA Global Index.
We see this pattern also in Panel 2, where most strategies out- or underper-
form significantly during the bull market while few do so during the bear
market. Finally, over the 10-year period, many strategies significantly out-
perform the CTA Global Index. Astonishingly, technically diversified and
technically financial/metals that respectively significantly under- and out-
64 PERFORMANCE
c04_gregoriou.qxd 7/27/04 11:05 AM Page 64
perform during the whole January 1985 to December 2002 period do not
significantly deviate from the index over the last 10 years.
7
Regarding the exposure to the index, some strategies (technically diver-
sified, technically financial/metals, technically currency, discretionary, sys-
tematic) are always significantly exposed whereas others (technically other
and arbitrage funds) are exposed over some subperiods without always
being exposed. Fundamental, stock, and options funds are never or almost
never exposed to the index.
The adjusted R
2
does not change heavily over the subperiods analyzed.
The biggest variations in this coefficient occur for technically financial/metals
from 0.30 for the January 1985 to December 1990 period to 0.62 for the
January 1991 to December 1996 period, for technically currency funds
from 0.08 over the January 1985 to December 1990 period to 0.48 for the
January 1991 to December 1996 period and for the no-category funds from
0.78 for the January 1991 to December 1996 period to 0.39 over the
December 1997 to December 2002 period.
Individual Fund Results
In this subsection we determine if the results obtained for the whole data-
base are confirmed for individual funds. We will not report the results
obtained for all the funds, but we will summarize. The first step in this analy-
sis is to apply a filter on the database. To be included in the database, each
fund must have at least 24 months of data. We delete 385 funds to reach a
total of 1,508 funds. Then we apply the model to each individual fund
regressed over the CTA Global Index. Results are summarized in Table 4.8.
The table indicates that 13.7 percent of the funds significantly outper-
form the index at the 1 percent significance level over the period studied.
Another 8.0 percent of the funds outperform at the 5 percent level. However,
11.7 percent of the funds significantly underperform at the 1 percent
significance level, and 5.7 percent do so at the 5 percent significance level.
The right side of Table 4.8 indicates that 49.9 percent of the funds are
positively significantly exposed to the CTA Global Index at the 1 percent
significance level. Another 10.3 percent of the funds are significantly posi-
tively exposed to the index at the 5 percent significance level. Few funds
are significantly negatively exposed to the CTA Global Index. 1.0 percent
CTA Performance, Survivorship Bias, and Dissolution Frequencies 65
7
Logically, however, they respectively under- and outperformed during the first sub-
period reported in Panel 1.
c04_gregoriou.qxd 7/27/04 11:05 AM Page 65
66 PERFORMANCE
TABLE 4.8 Summary of the Individual Results of the Performance Analysis,
January 1985 to December 2002
Positive CTA Global
Positive Alphas Index Exposition
Significance level 1% 5% 10% 1% 5% 10%
Number of funds 207 120 88 753 156 88
Percentage 13.7% 8.0% 5.8% 49.9% 10.3% 5.8%
Negative CTA Global
Negative Alphas Index Exposition
Significance level 1% 5% 10% 1% 5% 10%
Number of funds 176 86 84 15 24 20
Percentage 11.7% 5.7% 5.6% 1.0% 1.6% 1.3%
t-stat are heteroskedasticity consistent.
Numbers in the table are monthly percentages.
are exposed at the 1 percent significance level and 1.6 percent are exposed
at the 5 percent significance level.
These results are interesting because they indicate that, as a whole, 21.7
percent of the funds significantly outperform the CTA Global Index while
15.4 percent significantly underperform. Outperformance is one thing; per-
sistence is another. It will be interesting to determine if this outperformance
is persistent and predictable or not. It is not surprising that most funds are
significantly exposed to the index. However, there are some funds that
are significantly negatively exposed to the index.
Table 4.9 reports descriptive statistics on the estimated coefficients. The
average alpha is 0.14 percent (median 0.107 percent) with a standard devi-
TABLE 4.9 Descriptive Statistics of the Individual Performance Estimation,
January 1985 to December 2002
Mean Std. Dev. Median Min Max
Alpha 0.14% 1.84 0.11% −8.06% 22.09%
CTA Global Index 0.89% 1.07 0.69% −6.24% 5.45%
R
2
0.18 0.21 0.09 −0.04 0.87
Min = minimum; Max = maximum.
Std. Dev. = standard deviation; t-stat are heteroskedasticity consistent.
Numbers in the table are monthly percentages.
c04_gregoriou.qxd 7/27/04 11:05 AM Page 66
ation of 1.84 percent. The average beta (in our case the beta is measured
relative to our CTA Global Index) is 0.89. This means that the average CTA
is not completely exposed to the market. This number can be compared to
the beta of a portfolio with an equity index like the S&P 500. The only dif-
ference is the reference index.
The average R
2
is 0.18 percent with a standard deviation of 0.21 per-
cent. These figures may seem to be low, but R
2
is always lower for individual
funds than it is for indexes. The minimum and maximum are respectively
−0.04 and 0.87 indicating that the index explains almost 90 percent of the
fund’s performance.
PERSISTENCE IN PERFORMANCE
Now we want to determine if there is persistence in CTA performance. To
achieve this objective, we rank the funds in deciles D1 through D10 each
year based on previous performance. Decile 1 contains the worst-performing
funds, while decile 10 contains the best-performing funds. We also divide the
two extreme deciles (D1 and D10) into three subdeciles.
Global Results
Table 4.10 reports the descriptive statistics of each decile. It shows some
interesting features. The mean returns are more or less stable between decile
D1 and D7. The only exception is D6, which is slightly higher. Then, be-
tween D8 and D10, the increase is more pronounced. The last three deciles
offer a higher performance. The median returns show the same pattern with
lower figures. The standard deviation indicates that top-performing decile
funds have returns that are much more variable. This effect is more impor-
tant in the subdeciles, where the monthly standard deviation can reach al-
most 20 percent. There is no significant difference around the minima except
for subdeciles where the minima are lower (particularly from top-decile funds).
The maximum increases with the performance of the funds. The monthly
maximum returns can reach 140 percent for top-performing funds.
The kurtosis is large and the skewness is positive for all deciles. More-
over, they both increase with the performance. This means that good-
performing funds have positively skewed performance distribution with
fat tails. This is in accordance with the minimum and maximum results.
Finally, the Sharpe ratios calculated with a 5 percent risk-free rate are small
in magnitude. The highest ratios are those of poorly performing funds. This is
explained by the fact that the standard deviation is higher among the well-
performing funds.
CTA Performance, Survivorship Bias, and Dissolution Frequencies 67
c04_gregoriou.qxd 7/27/04 11:05 AM Page 67
Table 4.11 contains the results of the persistence analysis. The alpha
indicates that all deciles but decile 10 underperform relatively to the index.
Underperformance is significant only for D2, D4, D5, D6, D7, and D9.
These results indicate that when the performance of the index is taken into
account, most funds do not add value (they destroy value) over the January
1985 to December 2002 period. Interestingly, D10 (containing previous
year’s best-performing fund) has a positive but not significant alpha. All
deciles are positively exposed to the CTA Global Index, although D1, D6,
D8, and D9 are the only ones that are significantly exposed. The adjusted
R
2
obtained is quite high for each decile. However, for subdeciles (especially
those for D1), the R
2
is relatively low.
8
68 PERFORMANCE
TABLE 4.10 Decile Descriptive Statistics Based on Previous Year’s Performance
Mean Std. Sharpe
Return Dev. Median Min Max Skewness Kurtosis Ratio
D1 1.24 4.71 0.39 −8.37 30.38 1.69 7.07 0.17
D2 1.02 3.34 0.51 −5.70 20.67 1.74 6.39 0.25
D3 1.07 3.00 0.51 −4.34 15.21 1.66 4.79 0.27
D4 1.10 3.22 0.61 −6.97 19.86 1.97 7.84 0.25
D5 1.05 3.22 0.56 −6.07 24.42 2.59 14.65 0.26
D6 1.35 3.79 0.82 −7.11 19.91 1.86 6.11 0.22
D7 1.21 4.08 0.59 −7.14 27.55 2.37 12.14 0.20
D8 1.67 4.56 1.10 −6.16 35.00 2.81 15.72 0.18
D9 1.87 5.66 0.85 −7.93 46.75 3.97 25.34 0.14
D10 2.67 6.18 1.68 −6.63 45.38 3.56 20.28 0.13
D1a 1.30 5.49 1.08 −12.86 58.46 5.70 57.77 0.15
D1b 1.33 5.09 0.76 −11.09 28.83 1.82 6.83 0.16
D1c 1.96 5.99 1.18 −12.74 50.10 3.58 24.20 0.14
D10a 3.17 19.99 0.85 −46.29 140.91 2.45 13.69 0.04
D10b 1.90 14.77 0.87 −29.39 100.95 1.93 10.16 0.06
D10c 1.31 7.72 0.77 −24.47 34.74 0.56 3.04 0.11
Std. Dev. = standard deviation; Min = minimum; Max = maximum. The Sharpe
ratio is calculated with a 5 percent risk-free rate.
Numbers in the table are monthly percentages.
8
We have analyzed the data to understand this point, and we have concluded that
many funds in the worst-performing decile are dissolved each year. This means that
these subdeciles do not contain a lot of funds, which leads to less stable returns com-
pared to whole deciles.
c04_gregoriou.qxd 7/27/04 11:05 AM Page 68
Subperiod Analysis
Table 4.12 contains the persistence analysis over various subperiods. We
report a bull market period (January 1998 to March 2000), a bear market
period (April 2000 to December 2002), and the 10-year period ending
December 2002. This analysis aims at determining if the previous results
remain stable over different market environments. The left-hand side of the
table indicates that worst-performing funds significantly underperform
their peers over the bull market period. D1 to D4 and D6 have significantly
negative intercept over the January 1998 to March 2003 period. D9 and
D10 have positive alphas. Moreover, the alpha of D10 is significantly
positive. These interesting results indicate that the previous year’s best-
performing funds (around 10 percent of the whole database) significantly
outperform their peers over the bull market period. The results of subdecile
CTA Performance, Survivorship Bias, and Dissolution Frequencies 69
TABLE 4.11 CTA Persistence in Performance, January 1986 to December 2002
Mean Std. Dev. Alpha CTA Index R
2
adj
D1 1.24 4.71 −0.33 0.97
***
0.57
D2 1.02 3.34 −0.20
**
0.76
***
0.70
D3 1.07 3.00 −0.09 0.71
***
0.77
D4 1.10 3.22 −0.19
**
0.80
***
0.84
D5 1.05 3.22 −0.25
***
0.80
***
0.85
D6 1.35 3.79 −0.18
**
0.94
***
0.84
D7 1.21 4.08 −0.47
***
1.04
***
0.89
D8 1.67 4.56 −0.19
*
1.15
***
0.87
D9 1.87 5.66 −0.40
***
1.40
***
0.84
D10 2.67 6.18 0.20 1.52
***
0.82
D1a 1.30 5.49 1.82 0.82
***
0.02
D1b 1.33 5.09 −0.09 1.23
***
0.09
D1c 1.96 5.99 0.16 0.71
***
0.11
D10a 3.17 19.99 −0.39 1.04
***
0.49
D10b 1.90 14.77 −0.27 0.99
***
0.51
D10c 1.31 7.72 0.07 1.17
***
0.52
This table reports the performance analysis of the performance decile regressed
against the CTA Global Index.
t-stat are heteroskedasticity consistent.
***Significant at the 1 percent level.
**Significant at the 5 percent level.
*Significant at the 10 percent level.
Numbers in the table are monthly percentages.
c04_gregoriou.qxd 7/27/04 11:05 AM Page 69
TABLE 4.12 Persistence in Performance Subperiod Analysis
Jan 1998– Bull Market Period Apr 2000– BearMarket Period Jan 1993– Ten-Year Period
Mar 2000 Alpha Index R
2
adj
Dec 2002 Alpha Index R
2
adj
Dec 2002 Alpha Index R
2
adj
D1 −1.05
**
0.91
**
0.20 D1 −0.45 1.22
***
0.55 D1 −0.47
**
1.12
***
0.47
D2 −0.40
**
1.01
***
0.78 D2 −0.08 0.83
***
0.61 D2 −0.28
***
0.97
***
0.68
D3 −0.21
**
0.83
***
0.84 D3 −0.19
*
0.83
***
0.87 D3 −0.13
*
0.85
***
0.82
D4 −0.31
**
0.98
***
0.86 D4 −0.01 0.90
***
0.91 D4 −0.05 0.81
***
0.85
D5 0.00 0.91
***
0.89 D5 −0.17
**
0.87
***
0.95 D5 −0.12
***
0.79
***
0.89
D6 −0.26
***
1.05
***
0.94 D6 0.08 1.03
***
0.91 D6 −0.10
*
0.90
***
0.88
D7 −0.15 0.80
***
0.87 D7 −0.15 1.07
***
0.92 D7 −0.26
***
0.98
***
0.89
D8 −0.21
**
1.18
***
0.87 D8 −0.12 1.11
***
0.91 D8 −0.15
***
1.13
***
0.89
D9 0.02 1.19
***
0.84 D9 −0.09 1.22
***
0.85 D9 −0.25
***
1.29
***
0.86
D10 0.79
**
1.34
***
0.64 D10 −0.06 1.07
***
0.75 D10 0.38
**
1.21
***
0.71
D1a −0.02 2.13
*
−0.02 D1a −0.28 2.27
**
0.18 D1a −0.21 0.99
***
0.44
D1b 2.17 0.02 −0.04 D1b −1.73 0.88
**
0.00 D1b 0.04 0.44
***
0.20
D1c −0.78 0.94
**
0.03 D1c 1.15 0.32 -0.03 D1c 0.74
**
0.70
***
0.18
D10b 0.41 0.64
***
0.15 D10a −0.13 1.04
***
0.68 D10a 2.57 1.00 0.00
D10c −0.61
**
0.64
***
0.35 D10b −0.07 0.54
***
0.44 D10b 0.67 1.21
**
0.02
D10c 0.29 0.43
***
0.01 D10c 0.50 0.74
***
0.46 D10c 0.64 0.28 0.00
This table reports the persistence in performance analysis of the performance decile regressed against the CTA Global Index over
the January 1993–December 2002 period.
t-stat are heteroskedasticity consistent.
***Significant at the 1 percent level.
**Significant at the 5 percent level.
*Significant at the 10 percent level.
Numbers in the table are monthly percentages.
70
c04_gregoriou.qxd 7/27/04 11:05 AM Page 70
CTA Performance, Survivorship Bias, and Dissolution Frequencies 71
analyses are less significant.
9
The table also indicates that each decile is sig-
nificantly exposed to the CTA Global Index. The R
2
is particularly high,
especially for the upper deciles, but is generally low for the subdeciles.
The central part of Table 4.12 reports the decile analysis over the April
2000 to December 2002 period. This period corresponds to a bear market
since the technology bubble exploded in March 2000. It indicates that all
the deciles but D6 have negative alphas. The only one significantly negative
is D5. This result indicates that no group of funds offers persistent returns
during the bear market that began in the first half of 2000. As expected, the
top-performing subdecile (D10c) yields a positive (but not significant)
alpha. Nevertheless, each decile is significantly positively exposed to the
CTA Global Index.
The right-hand part of Table 4.12 reports the analysis for the 10-year
period ending December 2002. In this last case, all deciles but D10 are neg-
ative, and most of them significantly destroy value (D1, D2, D5, D7, D8,
and D9 have all significantly negative alphas). As in the bull period ana-
lyzed before, D10 has a significantly positive alpha. This indicates that the
funds in this particular decile persistently create value compared to their
peers. The exposure to the market is significantly positive for all deciles,
and as in all the other cases, R
2
is high for each decile.
Strategies Analysis
Once these results are obtained, we regress the same data over the various
strategies returns
10
to determine if some strategies are statistically more rep-
resented in some deciles. Results are reported in Table 4.13.
The first column contains the alphas. These increase monastically across
D1 to D8. Alphas for D9 and D10 are negative. Few of them are significant.
D2, D3, and D4 are weakly negatively significant, and D8 is significantly
positive at the 10 percent significance level. Interestingly, subdeciles D10a
9
Subdeciles sometimes contain few funds when many of the funds were dissolved in
the year after their classification in the top- or worst-performing decile. As we noted
in analyzing the survivorship bias, this bias is important in CTA data and we have
to take this factor into account.
10
We have analyzed the relationship between the various strategies in the correla-
tion analysis. We do not find high correlation between the strategies. The only cor-
relations that could lead to problems in estimation are the high coefficients between
the CTA Global Index and some strategies. To deal with this issue, we ran two esti-
mations, with and without the CTA Global Index. The results obtained are qualita-
tively the same. We report only the results without the index.
c04_gregoriou.qxd 7/27/04 11:05 AM Page 71
TABLE 4.13 Decile Performance Analysis, January 1986 to December 2002
Alpha Arb Discret Fund Option Stocks System Techcur Techdiv Techfin Techoth Nocat R
2
adj
D1 −0.58 −0.10 0.85
**
−0.02 0.08
**
0.03 0.50
**
0.02 −0.03 0.21 0.00 0.38 0.56
D2 −0.49
*
0.00 −0.09 0.05 0.00 0.08 0.37 0.28
***
0.38
**
−0.02 0.05
**
0.34 0.74
D3 −0.27
**
0.03 0.03 0.03 0.00 0.07 0.58
***
0.13
**
0.10 0.08 −0.01 −0.01 0.84
D4 0.22
*
−0.03 0.10
***
0.00 0.00 −0.06
*
0.71
***
−0.03 −0.05 −0.04 0.00 −0.05 0.87
D5 0.17 −0.06
**
0.11
**
−0.01 0.03
**
−0.03 0.49
***
−0.03 0.13
*
−0.07 0.02
*
−0.02 0.83
D6 0.05 −0.04
*
0.04 0.00 −0.03 0.07 0.56
***
−0.03 0.16
**
−0.14
**
0.01 0.06 0.84
D7 0.00 0.03 0.10
*
−0.01 −0.01 0.03 0.75
***
0.00 −0.03 −0.12
**
0.00 0.01 0.88
D8 0.21
*
0.02 0.14
**
0.00 −0.01 −0.02 0.80
***
−0.13
*
0.08 −0.03 0.00 −0.05 0.87
D9 −0.14 0.05 0.17
*
0.01 0.01 0.01 0.66
***
−0.06 0.16 0.16 0.00 −0.11 0.76
D10 −0.27 −0.02 0.31
**
0.03 −0.01 0.29 0.16 0.06 0.17 0.26
**
0.01 0.31
**
0.59
D10a −0.74
*
0.05 0.21 0.11
**
0.00 −0.03 0.56
**
−0.08 0.21 −0.08 0.04 0.56
*
0.34
D10b −0.03 −0.02 −0.21 0.01 0.01 0.05 0.30
*
−0.05 0.08 0.01 −0.05
*
0.26 0.19
D10c −1.01
**
−0.05 −0.36
**
−0.05 −0.08 0.07 −0.57 −0.02 0.95
**
0.78
***
−0.02 0.46 0.28
D1a 1.66 −1.64 1.41 0.05 −0.34 0.75 −3.69 0.01 0.09 1.89 −0.09 3.77
*
−0.16
D1b −2.17 −0.39 4.06 −0.49 −0.11 −0.23 −0.54 −0.01 0.17 1.06 −0.17 2.5
*
0.11
D1c 0.95 −0.43 1.02
**
0.00 −0.09 0.09 −0.03 0.25 −0.50 −0.22 0.09 0.88 −0.09
This table reports the persistence in performance analysis of the performance decile regressed against the CTA Global Index and the
CTA substrategy indices.
t-stat are heteroskedasticity consistent.
***Significant at the 1 percent level.
**Significant at the 5 percent level.
*Significant at the 10 percent level.
Numbers in the table are monthly percentages. Arb = arbitrage; Discret = discretionary; Fund = fundamental; Option = option strat-
egy; Techdiv. = technical diversified; Techfin = technical financial/metals; Techcur = technical currency; Techoth = other technical;
System = systematic; Stock = stock index; Nocat = no category.
72
c04_gregoriou.qxd 7/27/04 11:05 AM Page 72
CTA Performance, Survivorship Bias, and Dissolution Frequencies 73
and D10c are significantly negative. All these figures are different from the
ones obtained in the performance or performance persistence analysis.
The other columns report the exposition of each decile to the strategies
defined earlier. We analyze the table horizontally, then vertically, but first we
want to underline the fact that negative significant exposure of a decile to a
strategy means that the decile negatively contributes to the creation of alpha.
Decile D1 (the worst-performing funds) is significantly positively exposed to
discretionary and systematic funds and significantly negatively exposed
to option funds. The mean return for decile D1 is 1.24 percent (see Table
4.11). Once we take the strategy performance into account, the alpha is
−0.58 (See Table 4.13). The difference between these two numbers comes
mainly from the exposure to fundamental and systematic funds.
11
D2 is sig-
nificantly positively exposed to technical currency, technical diversified, and
technically other funds. Interestingly, this decile is not significantly exposed
to systematic funds. D3 is significantly positively exposed to systematic
funds and to technical currency funds. D4 is positively exposed to discre-
tionary funds and to systematic funds. D5 is significantly negatively
exposed to arbitrage funds and significantly positively exposed to discre-
tionary, option strategies, and systematic funds.
D6 is significantly positively exposed to systematic funds and techni-
cally diversified funds and negatively exposed to technical financial/metal
funds. D7 is significantly positively exposed to systematic funds and nega-
tively exposed to technical financial/metals, whereas D8 is positively ex-
posed to discretionary funds and systematic funds. In this particular case,
the strategies reported cannot completely explain the alpha (since it is still
weakly significantly positive). D9 is significantly positively exposed to dis-
cretionary funds and systematic funds. Finally D10 is significantly positively
exposed to discretionary funds, technical financial/metals, and to the no cat-
egory. Note that it is the only decile exposed to the no-category strategy.
If we analyze the results in Table 4.13 by columns rather than by rows
to detect the presence of certain strategies in particular deciles (top, middle,
or bottom deciles), we find some interesting features. First of all, each strat-
egy has at least one significant coefficient across the deciles (some of them
have only weak coefficients). Interestingly, for most, significance appears
only once out of the 10 deciles (arbitrage, fundamental, option, stocks, no
category). Note, however, that most of these strategies contain only a few
11
Recall that the systematic strategy is 0.98 correlated with the CTA Global Index
(see Table 4.3). This means that the systematic strategy can be seen as the index in
this particular case.
c04_gregoriou.qxd 7/27/04 11:05 AM Page 73