PROFIT WITH OPTIONS CHAPTER 4 ppt
Bạn đang xem bản rút gọn của tài liệu. Xem và tải ngay bản đầy đủ của tài liệu tại đây (252.89 KB, 39 trang )
123
4
SYSTEM TRADING
L
EARNING
O
BJECTIVES
The material in this chapter helps you to:
• Choose the trading system that is right for you.
• Realize the importance of following your system’s rules—
always.
• Determine the amount of money you need to start short-
term trading.
• Understand what makes the market move.
• See and react to index arbitrage at work near or on index
option expiration day.
• Compute index fair value.
Much has been written in recent years about day traders. In
fact, day trading has been around for ages, but the most common
practice has been to day-trade futures because they have large
leverage. In addition, some futures contracts are volatile enough
that their daily trading range is wide, so that a day trader has a
reasonable chance to make (or lose) some money. The kind of day
124 SYSTEM TRADING
trading that the media fell in love with was day trading of
stocks—a realm that used to be reserved strictly for professional
traders who paid no commissions. However, with the advent of
Internet stocks’ volatility, it appears to many novice traders that
they can make money day-trading these stocks. History will al-
most certainly prove that to be false for the vast majority of
these day traders.
In any case, if you are going to day trade, you need a system—
you can’t just say, “I think I’m going to buy Microsoft today.”
That is almost certainly the road to ruin. A trading system is a
methodology that has well-defined rules for entry and exit, plus
perhaps some rules for taking partial profits. There are hun-
dreds, perhaps thousands, of systems that are profitable. If you
are going to trade any of them, you need to pick ones that are
compatible with your trading style. The discussion in this chap-
ter will show you how to pick the system that’s best for you and
use it profitably.
CHOOSING A SYSTEM
In selecting a trading system, you should ask these (and per-
haps even more) questions: Does it work in the markets you like
to trade? Some systems work much better in certain markets
than others (for example, it might work well in bonds, but not in
currencies or the S&Ps). Does it require more time than you can
give? That is, does it require you to be glued to a screen all day
to watch short-term, real-time price movements? Does it have a
larger risk than you really want to take? Just because a system
has a good track record does not mean that it will make money
for you, so you must analyze how much you are placing at risk in
case the first few trades all turn out poorly. Are the system’s
drawdowns too large for the capital you are going to risk? That
is, are you risking ruin on a short, unprofitable run of trades by
CHOOSING A SYSTEM 125
your system? If so, you must either trade with more capital or
find a system with a smaller drawdown.
While we are on the subject, let us discuss drawdown be-
cause it is a term that is not familiar to everyone—although its
concept certainly is. I facetiously define drawdown as what hap-
pens to your account the minute you begin trading a profitable
system. Drawdown is the worst losing period that a system has
faced. Even wildly profitable systems have drawdowns—they
are inevitable; not every trade can be a winner. You should
allow enough trading capital to margin the trades plus allow for
the maximum drawdown. In that way, a trader will not be wiped
out prematurely, that is, before the system has a chance to be-
come profitable.
Follow the Rules
A system by its very nature has a rigid set of rules. The hard-
est thing about system trading is following the rules. Your emo-
tions will get in your way. You may decide not to take a certain
trade because there have been several losing ones in a row, and
you figure the system isn’t working. That’s just when a system
will crank out a big profitable trade. Even worse, if the system
is working really well, and you have a series of winners, you
may be tempted to skip a trade because you figure that it’s due
to be a loser. Again, you could easily be missing out on a win-
ning trade, or if a really long winning streak unfolds, you prob-
ably won’t get back into the system once you have “gotten out”
by skipping that trade.
Even if you enter the trade you’re supposed to, you may find
it difficult to adhere strictly to the buy and sell points. If you’re
watching the market in real time, you may be tempted to over-
ride a stop loss point, figuring that the market is certainly due
to rebound. Don’t do that! You’re almost certain to be wrong—
especially in a losing situation—because your emotions are
126 SYSTEM TRADING
over
ruling your system’s hard statistics. One good approach to
system trading is to find a broker who will trade your system for
you. Your broker has no emotional ties, especially if you make it
clear that the only thing that will make you mad is if he or she
overrides the system and misses a trade or an entry/exit point.
There are a number of futures brokers who offer this service.
Advantages of System Trading
There are some definite emotional and psychological advantages
to day trading. One is that you don’t have to work every day. If
you decide to skip a day or go on vacation, there are no posi-
tions—by its definition, day trading means that you close out
your positions at the end of the day. Many day traders really like
the feeling of not having to worry about what happens overnight
and also the feeling of starting out each day with a clean slate.
If that doesn’t appeal to you, then don’t consider being a day
trader—and that’s all right, too. Not everyone can trade every
style. Day trading is a style that historically has been for only a
few. The fact that it recently caught the media’s and public’s at-
tention does not alter that fact—it’s still apropos for only a few.
Those few will succeed; the others will fail and reenter the “nor-
mal” job market.
Another advantage of system/day trading is that you don’t
have to do much work to get back up to speed after time off. If
you’re a fundamental stock analyst, for example, you’d have to
find out what the company is doing and what its industry is
doing, how interest rates are behaving, what the general market
tone is like, and so on. A system trader, however, needs nothing
more than the inputs to the system—which should easily be
available from the newspaper or the trader’s quote machine.
Once the system inputs are in hand, the day trader is ready to
go. No long background research is required to get up to speed.
There is a margin advantage to day trading as well: Most
brokers require a smaller margin for day traders—sometimes as
SYSTEMS EXAMPLES 127
low as 50% of the exchange minimum margin for overnight po-
sitions. Of course, decreased margin (i.e., higher leverage) is
a two-edged sword: losses hurt more, and gains are greater,
percentagewise.
SYSTEMS EXAMPLES
There are two systems relevant to this discussion. One is a very
short-term trading system—Treasury Notes vs. S&Ps—with
holding periods of a day or two. The second system (oscillator
system) is more of an intermediate-term system where holding
periods can run as long as several weeks.
Treasury Notes Opposite S&Ps
A system that is designed to trade the S&Ps (or a similar vehi-
cle) is based on the movement in the 10-Year Treasury Note fu-
tures (base symbol: TY). The theory behind this system is that
the “bond market” shows the “true” direction of the stock mar-
ket, and if there is a large discrepancy between T-Note move-
ments and the movements of the S&P 500 futures, then we
should trade the S&P futures—figuring that they will catch up
to the T-Note futures. Larry Williams, who has designed simi-
lar systems to take advantage of these movements between the
bond market and S&Ps, first introduced this idea to me.
System Entry Rules: Specif ically, we look at how the T-Note
futures have done over the past six days. If they are up, say, and
S&P futures are down over the same six-day period, then we
would buy S&P futures at the opening of the next day’s trading.
Conversely, if T-Notes have been down over the last six days,
while S&P’s have been up, then we would short the S&P futures
at the opening of trading.
This system is based on trading the S&P 500 futures con-
tract. You may use other vehicles to trade this system, such as
128 SYSTEM TRADING
$OEX options, e-mini futures, Dow Jones futures or options,
and so on, but the system requires the buy and sell points to be
computed with the S&P 500 futures prices.
Those entry rules are well-defined. However, there must be
well-defined exit rules as well. You must use stops that are in
line with the volatility of the market, lest you be stopped out on
a small “wiggle” on nearly every trade. Even a very profitable
system will lose money if the stop is too tight. The stop must be
placed at a wide enough level where random market noise won’t
affect the overall workings of the system. The stop points could
be optimized with back-testing software, but as a general rule,
with S&P futures at or above 1000 and with $VIX in the low-to-
mid-20’s, I use a stop of 5.00 points.
Actually the exit rules are composed of three parts:
a. Once the position is initially taken, set a stop at 5.00
points from the market’s opening price (your theoretical
entry price), not from your actual entry price. So if you
bought the S&P futures at 1115.00 on the opening, you
would place a stop with your broker to sell them at
1110.00.
b. If a 5.00-point profit develops, then begin to use a 5.00-
point trailing stop. In this example, then, if the futures
traded up to 1120 (after having bought them at 1115 on
the opening), then a trailing stop of 5.00 points would be
used. The next section describes a trailing stop order in
greater detail.
c. If you are not stopped out by either rule 1 or 2, as the end
of the trading day nears, you should reassess the entry
rules again. If the entry rules are no longer valid (that is,
if today’s movements have placed the T-Notes and the
S&Ps in “agreement” over the past six days), then exit
the trade “market on close.” If not—that is, if T-Notes
and S&Ps are still divergent over the past six days—then
SYSTEMS EXAMPLES 129
hold your position into the next trading day, keeping the
same stop orders in place.
The system is not necessarily a day-trading system, al-
though it often terminates during or after a single day’s
trading. Table 4.1 shows the rules and Table 4.2 shows an ex-
ample of this system. The trade in Table 4.2 is closed out after
one day.
A one-point move in the S&Ps is worth $250 per point. Orig-
inally, a one-point move was $500, but the contract size was
halved with prices and volatility increase in the late 1990s. So,
a stop of 5.00 points means that you are risking $250 × 5 =
$1,250 per trade, plus commissions and slippage.
What’s slippage? That’s the amount of extra money you lose
when you enter or exit the market. Simplistically, let’s say your
system calls for you to buy one S&P at 1312.50, and you place a
stop order above the market to do so. Later, the market moves
higher and hits your stop. At that point, your order becomes a
Table 4.1 T-Bonds Trending Opposite S&Ps—Rules
Using day session closing prices, compare the T-bond front month futures
closing prices with the closing prices six trading days ago. Make the same
comparison for S&P front month futures.
After analyzing the results, if you
see that:
1. T-bonds have risen over the six days, and S&Ps have fallen, then buy
S&Ps at the day session open.
2.
T-bonds have fallen over the six days, and S&Ps have risen, then sell
S&Ps
at the day session open.
Stop yourself out as follows:
a. Use a 5.00-point intraday stop loss initially.
b. If a 5.00-point profit accrues, then chance the stop to be a 5.00-point
trailing stop.
c. At the end of the day, if not stopped out, exit the trade if T-bonds and
S&P’s are in “agreement.” Hold the position if T-bonds are still trend-
ing opposite S&Ps.
130 SYSTEM TRADING
market order. So your floor broker buys one S&P at the market.
Perhaps he has to pay 1312.70 to do so. The extra 20 cents (0.20)
that you paid to enter the trade above the stop price is consid-
ered slippage on the way in. There will also be slippage on the
way out. Twenty cents at $250 per point is slippage of $50. You
can see that slippage can be a big part of things—probably much
more expensive than commissions. When markets are volatile,
the slippage increases. In fact, if you trade right after a major
economic announcement such as a volatile unemployment report,
you could face slippage of monstrous proportions. That’s why it’s
sometimes a good idea to stand aside from any system trading
when government reports are released—that applies to almost
any futures contract.
Types of Stop Orders
The previous paragraph described the way a stop order works.
There are other types of stop orders that can be used. For ex-
ample, there is something called a stop limit order. In that case,
you place a stop limit order to buy the S&P at 1312.50, say.
When they rise up to your stop price, your order becomes a
limit order, not a market order as in the previous paragraph.
This could lead to better or worse results. If the S&Ps stabilize
Table 4.2 T-Bonds Trending Opposite S&Ps—Example
9/18 Close 9/26 Close Change
US 115-15 115-24 +0.09
SP 957.80 953.20 −4.60
⇒ Buy S&P on OPEN of 9/29: 952.95
9/19 Close 9/29 Close Change
US 115-21 115-22 +0.01
SP 960.60 961.10 +0.50
Now the two are in synch, so sell the long S&Ps on close.
SYSTEMS EXAMPLES 131
right after hit
ting your limit, then you will buy them at 1312.50,
and therefore you will have no slippage entering the trade. How-
ever, if they keep right on going higher, you will not be “in” the
trade, and it will be making money for those who used regular
stop orders, while those who used stop limit orders are sitting on
the sidelines, twiddling their thumbs. I use stop limit orders
when slippage becomes too large.
However, upon exit of a trade, you should never use a stop
limit order. The reasoning is simple. The exit stop is there to
keep your losses limited. That is, the system designers have de-
termined that once the market reaches the exit stop level, the
system is not working for this particular trade, and it should be
exited. If you use a stop limit order, there is a possibility that
you will not exit the trade if your limit is not attained. There-
fore, you could wind up losing a vast amount of money—far more
than the 5.00 points that the system is designed for (plus slip-
page). Consider this example: Your entry point was 1312.50 for
the S&Ps when you bought them. Therefore your sell stop would
be placed at 1307.50. Suddenly, bad news arises (Iraq attacks
Kuwait, or Greenspan rases interest rates, or you name it) and
the market crumbles. It slashes right down through your limit
and falls to 1290.00. If you had used a regular stop, you might
have received a fill on your sell order at 1306.50—slippage of a
whole point ($250) but at least you would be out. If you used a
stop limit order, it is unlikely that your order would have been
filled because the market was plunging. Therefore you would
still be long in the futures when they finally settled down at
1290.00, a loss of 22.50 points or $5,625. In a system where the
loss is designed to be $1,250 plus slippage, that’s a huge and pos-
sibly irreversible mistake for you to make. So, do not use stop
limit orders for exiting a system trade.
The previous example contained a subtlety that is important:
No matter at what price you actually enter the system, the stop
must be placed 5.00 below the system entry price. In this exam-
ple, the system called for you to buy at 1312.50. If you paid
132 SYSTEM TRADING
1312.70 because of slippage, that is irrelevant as far as deter-
mining where to place the stop. The stop is placed at 1307.50 be-
cause that’s 5.00 below the system entry price of 1312.50.
Next, we must address the issue of a trailing stop, because
that is what the system calls for. A trailing stop is one that
moves with the futures position when it is making money but re-
mains static if it begins to lose money. Let’s once again use the
same example. Suppose that we bought our futures at 1312.70,
as above, which include the 20 cents for slippage. Also as shown
above, our stop is originally placed at 1307.50, five points below
the opening price. Now suppose that the S&P futures rise by 5.00
points to 1317.50—that is, we have a 5.00-point profit (unreal-
ized). The trailing stop now needs to be used. It would initially be
set at 1312.50—5.00 points below the current prices of 1317.50.
If the market moves higher, the trailing stop would need to be
raised, since it should always be 5.00 points below the best price
your trade has reached so far.
If you are using a broker, you would call him and tell him to
cancel the original stop at 1307.50 and instead to place a new
stop at 1312.50. Later, if the market moves higher, you would
cancel that stop and replace it with a higher stop. Obviously, you
can’t keep calling your broker every time the S&Ps rise another
dime. That would require too much work from you and would
drive your broker crazy. So you must use some judgment here—
perhaps as a practical matter, only calling your broker if you are
raising the price at least a point (1.00) or so. As long as you’re
watching the trading on your quote screen, you can always know
yourself where the trailing stop is (theoretically) even if you
haven’t physically placed the order with your broker. If the S&Ps
trade at the theoretical stop, you can always call your broker and
sell your position at the market, while canceling whatever stop
you had in there at the time.
Just to continue with our example describing trailing stops,
suppose that the S&Ps subsequently trade down to or up to the
following prices. Table 4.3 shows what you would do with your
TEAMFLY
Team-Fly
®
SYSTEMS EXAMPLES 133
trailing stop order. Again, this assumes that you bought S&Ps
at 1312.70 and set your stop initially at 1307.50.
In this example, you are eventually stopped out at 1319.00,
or perhaps something slightly lower if there was slippage. You
originally bought the futures at 1312.70, so your profit is 7.30
points, or $1,825.00, less slippage on the exit, less commissions.
However, you can see that, at one point, with the S&Ps at 1324,
you had a profit of 12.30 points, or $3,075. So you gave back a
lot by waiting for your stop to be hit. Or did you Will, in this
case you did, but what if the S&Ps had gone on to 1335? Then
you would have been glad you stayed with the position instead of
arbitrarily selling it out at 1324. So, stick with the system rules
and don’t try to countermand them.
The system designers should attempt to incorporate these
things into the system—which eventually evolves as the stop
price. Some systems may have targets. This one doesn’t. So you
will have occurrences like the one above, where the eventual
profit seems small in comparison with the best profit you had
at any time during the day. The trailing stop is designed to
lock in a good chunk of that best profit, but obviously it can’t
lock in all of it.
Some traders will compromise a little, by trading several con-
tracts (i.e., buy two or three S&Ps instead of just one), and then
Table 4.3 Trailing Stop Orders
S&Ps Move To Your Stop Becomes
1318.00 1313.00 (as covered above).
1315.00 1313.00 (no change; the stop is never lowered for a long
position).
1320.00 1315.00 (5.00 below the highest price reached so far).
1316.00
(again, no change in the stop when losing money).
1324.00 1319.00 (5.00 below the new highs).
1319.00 You’re stopped out.
134 SYSTEM TRADING
sell one out at the stop distance (after a profit of 5.00 points),
holding the others in accordance with the system design. In this
case, you’d sell one at 1317.50 (the entry stop, 1312.50, plus
5.00) and the other(s) at 1319.00 in accordance with the regular
system. By increasing the number of contracts you trade ini-
tially, you increase your overall dollar risk if the position lost
money and stopped you out immediately.
How Much Money Should I Allot?
In any type of trading, if you are undercapitalized, you will
probably lose all of your money. You can see that you will need
at least the initial margin, plus a dollar amount equal to the
stop, plus commissions and slippage. Even with that, if you lose
on your first two trades, your broker will ask for more margin.
In reality, you should have an idea of the drawdown of the sys-
tem before beginning to trade it. Then you should allot the ini-
tial margin plus the drawdown as your initial capital.
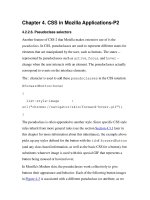
Table 4.4 gives the daily profits or losses for this system from
3/20/96 through 1/26/98. You can see that it only trades a few
days per month. On the other days, the T-Notes and S&Ps are in
“agreement” and there is no trade. This system has a drawdown
of $16,254, as shown in Table 4.4. That drawdown was for the
specific period of time shown in the chart. That figure was for
trading two of the current-size S&P contracts. That is, the fig-
ures in Table 4.4 represent trades with a potential for risk of
$500 per point (two contracts). So, for one contract, the draw-
down would only be $8,127 or so.
In any case, returning to the question of how much money
to start with, we want to allow the initial margin plus the
drawdown. So, if your broker is charging $22,000 for the ini-
tial margin on an S&P contract, and the drawdown is $8,100,
then you need $30,100 in your account to begin trading this
system with just one contract! Many traders start out with far
less capital and wind up losing most or all of it because they
135
3/20/96 553
3/27 −3,600
4/2 −600
4/3 −250
4/18 550
4/24 2,500
4/25 −1,697
4/30 200
5/1 −850
5/2 5,328
5/24 −1,097
6/6 4,453
6/10 1,250
6/11 −97
6/12 853
6/18 −2,150
6/19 600
6/20 −925
6/21 3,300
6/24 828
7/17 2,850
7/18 4,825
7/19 −2,725
7/22 −2,225
7/23 −4,700
7/24 1,253
7/26−30 2,028
7/31 −2,372
8/1 5,578
8/14 −522
8/20 200
8/21 975
8/22 −2,925
8/23 1,500
8/26 2,278
9/9 −4,466
9/24 −547
9/25 478
10/1 1,978
10/15 2,903
10/17 78
10/25 703
10/30 −2,600
10/31 3,425
11/1 −1,597
12/4 403
12/5/96 −247
1/10/97 −3,772
1/13 1,050
1/14 −4,397
1/20 353
1/23 6,278
2/24 −2,572
2/26 5,003
3/10 −2,522
3/11 1,778
3/12 3,678
3/13 6,703
3/24 4,228
3/25 −3,047
3/27 11,928
4/10 928
4/17 −872
4/28 −3,272
5/14 1,753
5/20 −2,522
5/21 1,778
5/22 1,353
5/23 −2,522
5/27 −2,522
5/28 −547
5/29 2,523
5/30 −2,522
6/4 −525
6/5 1,728
6/6 8,228
6/24 7,528
7/2 −2,522
7/3 −5,022
7/15 −2,522
8/4 −1,700
8/5 978
8/6 −2,522
8/7 5,128
8/19 4,978
8/20 6,753
8/26 −2,522
9/9 −2,522
9/16 10,750
9/25 −2,522
9/29 4,353
10/10 −2,522
10/13 1,850
10/14 1,228
10/21 6,453
10/24 −2,522
10/27 −2,522
10/28 −2,522
10/30 −2,522
11/3 6,078
11/5 −2,522
11/11 928
11/12 −2,522
11/14 5,028
11/16 8,628
12/1 −2,522
12/12 −2,522
12/15 2,578
12/16 3,078
12/17 −2,522
12/18 −2,522
12/19 −2,522
12/22 −2,522
12/23 −2,522
12/24 −2,522
12/26 −1,122
12/29 6,378
12/31/97 −1,072
1/2/98 −1,122
1/9 −2,522
1/12 10,478
1/13 6,978
1/14 1,878
1/15 −2,522
1/16 2,178
1/20 −2,522
1/21 2,078
1/22 4,528
1/23 928
1/26 378
84,907
Table 4.4 T-Bonds Trending Opposite S&Ps—Daily Profits
Date Profit/Loss Date Profit/Loss Date Profit/Loss
130 trades.
Average profit: +$653.
Drawdowns: −13,331 (July–August ’97).
−16,254 (December ’97).
136 SYSTEM TRADING
are undercapitalized. Note: you might be able to halve the
margin portion of the requirement if your broker only charges
half for day trades. However, you would then have to be ab-
solutely certain that you never hold a position overnight inad-
vertently. If you did, you would get a margin call, and if you
didn’t have the excess capital to deposit into the account to
meet the margin call, you might find your account restricted.
Trading Vehicles
It was mentioned earlier that this system could be traded with
other broad market instruments—other than the S&P 500 fu-
tures contract. This is not to say that the system applies to corn
or Swiss francs. It does not. There may be similar systems that
do, but it would be up to the reader to discover them, perhaps
with the aid of system-testing software. Rather, since this sys-
tem indicates the short-term movements of the S&P futures
(and hence the broad stock market), then other broad stock mar-
ket vehicles could be traded using this system. These would in-
clude the $OEX options, Dow Jones futures and options, and the
S&P e-mini futures, to name a few.
If you are going to use the system to trade one of these other
instruments, then your stops would become mental stops, in
general. That is, you would put the limits in your quote machine
based on the S&P futures’ trading movements, as usual, but
when the limit was hit, you would pick up the phone and buy or
sell one of these other instruments instead of actually having a
stop order the S&P pit.
For example, suppose you don’t have a futures account and/or
your broker is not registered to do futures business. Then I would
recommend trading $OEX options with this system. To once
again use the above example, you would set up your quote ma-
chine with a limit at 1312.50 (the buy point for the S&P futures).
However, since you are trading the S&P futures themselves,
there would not be a stop order on any exchange floor. Rather,
SYSTEMS EXAMPLES 137
when your limit blinks (or beeps, or whatever it does) on your ma-
chine, then you would call your broker and tell him to buy $OEX
calls. You should probably trade relatively short-term $OEX calls
because that’s where the greatest liquidity is; and you should
probably trade calls that are at least slightly in-the-money in
order to minimize the vagaries of volatility changes on your posi-
tion (time decay really isn’t much of a problem since these will be
day trades). One rather larger problem with $OEX options,
though, is that the bid-asked spread is quite wide in comparison
to that of the S&P futures. Hence slippage can be much larger.
If you do have a futures broker and a futures trading ac-
count, but worry that the risk in the S&P 500 futures is too
large, you may want to consider trading the system with the
S&P 500 e-mini futures. These are very similar to the S&P 500
futures, but the e-mini futures are only worth $50 per point—
one-fifth the size of the “big” S&P futures. The e-mini futures
are traded electronically only. Thus, to enter a trade you must
call your broker to put in the order through an electronic termi-
nal. Stop orders are not really allowed, per se, but most brokers
will enter a not held stop order for you. That is, if you give
your broker an order to buy the futures at 1312.50, stop, the bro-
ker will watch the futures trade, and when they trade at
1312.50, will put a market buy order into the electronic termi-
nal. This might increase your slippage a little, but it might be
worth the price if you really don’t feel comfortable trading the
bigger-sized S&P 500 regular futures.
The Oscillator—An Intermediate-Term System
The final trading system that is included in this section is a
more intermediate-term one. In this system, positions are held
for several days, or perhaps even a few weeks, as opposed to the
day-trading philosophy of the previous two systems. This sys-
tem is based on an exponential moving average of the net ad-
vances minus declines, daily, of the NYSE stocks. It is a simple
138 SYSTEM TRADING
computation (see Table 4.5) and only needs to be made once a
day. To get started, though, you must know the value of the os-
cillator on a certain day because each successive day’s value de-
pends on knowing the previous day’s value. Once you have that,
then you can compute the oscillator value each day after that.
There are a couple of ways to get the oscillator value. One is to
subscribe to our daily service, Daily Volume Alerts. The oscilla-
tor value is published there each day. Failing that, you can
e-mail us at and ask us for the cur-
rent value, which we will be glad to supply to you.
Since this is an intermediate-term system, we recommend
using options to trade it. Many traders have trouble deciding
whether to trade options or the underlying in certain situations.
One general rule of thumb is this: The longer-term the system,
the more one should lean toward trading options. For example,
in a day-trading system, we would not recommend trading op-
tions. There is far less slippage and more accurate use of stops
Table 4.5 A Short- and Intermediate-Term Trading Indicator
Computation
Let M = Current exponential moving average
“New” M = 0.9 * M + 0.1 * (Today’s advances − declines)
Example: M = 100
Advances = 1,200
Declines = 900
Then: New M = 120
Market is overbought when M > 200
Market is oversold when M <−200
Action
1. Sell signal: when M falls below 180 after having been overbought.
2. Buy signal: when M rises above −180 after having been oversold.
3. Stop yourself if signal goes on alert again; for example, if on a sell and
M rises above 200 or if on a buy and M falls below −200.
SYSTEMS EXAMPLES 139
with the underlying in a short-term trading situation such as
day trading. Moreover, you know that your stop is tight and
losses will be small, hopefully.
However, as your systems extend farther out in time, you ac-
quire more risk. For example, in this system, we are risking 2%
of the price of $OEX (or $SPX if you are trading futures). With
futures prices near 1300, a 2% move would be 26 points, or
$6,500 for one contract. Almost certainly, an $OEX at-the-
money option is going to cost far less than 65 points. So, for the
intermediate-term, an option is probably a better choice than is
trading the underlying. The basic reason for this is that an in-
termediate-term system, by nature, is looking to make big gains
and thus it must use relatively large stops in order to avoid get-
ting stopped out too soon before the big gains have a chance to
be made.
The oscillator system is a good one, and it has a fairly long
track record. As you become familiar with it, you may be able to
make some adjustments in your positions as time goes by. For
example, when the oscillator becomes extremely overbought or
oversold—even though it has not given a buy signal or sell sig-
nal by the system’s definition—a sharp, short-term move may
be about to occur in the market. These most often occur on the
downside. There have been several occasions on which the oscil-
lator has dipped below − 400. Those are the types that result in
a short, sharp rally. However, it is quite possible that such a
rally does not bring the oscillator all the way up to a buy signal.
It is a general rule of thumb that the more deeply oversold
the oscillator gets, the better the ensuing intermediate-term
rally will be. This is especially true if the oscillator falls below
−500 before a buy signal is given. The most extreme reading
ever was −967 in September 1998. It took another month before
the intermediate-term buy signal took effect, but then the mar-
ket shot significantly higher, with the broad market rallying
nearly 50% in the next six or seven months.
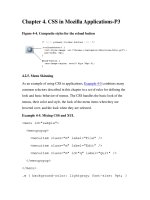
140
Table 4.6 An Intermediate-Term System Using an Oscillator Indicator
1. Initial stop = 2% of OEX.
2. Take partial profits on one-third of your position if OEX moves 2% in
your favor, and at that time begin to use a 2% trailing stop.
3. Take profits on another one-third of your original position if OEX rises
another 2% (4% from the initial price).
Year Signals Profitable Net Result in OEX Points
1984 5 of 6 +15.7
1985 6 of 7 +35.4
1986 5 of 5 +35.5
1987 5 of 9 +8.8
1988 4 of 8 −2.8
1989 2 of 5 −4.3
1990 4 of 7 +15.0
1991 5 of 5 +58.3
1992 4 of 4 +41.7
1993 4 of 5 +28.3
1994 6 of 12 +56.3
1995 3 of 9 −15.7
1996 7 of 11 +34.7
1997 9 of 12 +160.7
1998 10 of 15 +85.2
1999 5 of 10 +40.0
2000 5 of 10 +72.8
2001 6 of 9 +121.7
Totals 95 of 149 (64%) +787.3
Maximum gain: 38.6 points
Maximum loss: 18.3 points
Average trade: +5.28 points
Longest holding period: 155 calendar days
Average holding period: 24 days
Can use S&P futures or options in this system.
Note: $OEX split 2-for-1 on 11/24/97.
OPTION EXPIRATION AND ITS EFFECTS ON THE STOCK MARKET 141
Overall, this is an easy indicator to keep track of, and its
track record shows that it is worthwhile to do so. A simple sys-
tem using this indicator is summarized in Table 4.6.
OPTION EXPIRATION AND ITS EFFECTS
ON THE BROAD STOCK MARKET
The stock market has been quite volatile on many option expira-
tion days during the year since index option trading was in-
vented. What many people do not understand, however, is why
index futures and option expiration make the stock market move.
There is a direct cause and effect, as you will see. Furthermore,
the stock market doesn’t just move because it’s expiration day or
expiration week. No, there must be some significant open inter-
est in the futures and options in order to create the potential for
market movement.
First, let’s understand what makes the market move. Then
we’ll concentrate on finding out how to identify expirations in
which there is a large potential for the market to move. You will
see that, depending on how aggressive index arbitrageurs are,
the stock market can experience serious movements from as far
as a week prior to expiration to the period immediately follow-
ing expiration day itself.
Index Arbitrage
Index arbitrage is what makes the market move at or near expi-
ration. The following scenario describes how index arbitrage po-
sitions can be built up to levels that are large enough to cause
the entire stock market to move. Suppose that the market is ris-
ing strongly over a few months’ time. In that case, public cus-
tomers who bought $OEX options would find themselves with
nicely profitable positions. Moreover, those long calls would
be heavily in-the-money by the time expiration was drawing
142 SYSTEM TRADING
nigh. So, the public usually sells these expensive calls (perhaps
rolling to other, less expensive contracts). Thus, a number of
calls with prices of 30, 40, or even higher are sold. The only
traders who will buy these calls are market makers and arbs,
for no one else is usually interested in purchasing such high-
priced inventory.
Arbs and market makers, however, are not sanguine about
owning such high-priced inventory either, at least not without
hedging it. So they sell short the appropriate quantity of the 100
stocks that make up the $OEX index in order to hedge their long
call position. As time progresses and expiration draws nearer
and nearer, most of the $OEX in-the-money calls in the series
that is about to expire fall into the hands of these arbs. So, going
into expiration, the arbs have a position that consists of lots of
long $OEX calls hedged by the appropriate amount of short
stock. The action of acquiring these arbitrage positions doesn’t
affect the stock market much at all. However, the unwinding of
these positions can have a large influence on the market.
To see why this is true, let’s assume that the arbs unwind
their entire $OEX position at the close of trading on expiration
Friday (the third Friday of the expiration month). In reality,
they may dispose of part of their position in other manners, but
to illustrate our point, we will assume they hold their positions
until expiration and unwind them then. At the end of trading on
expiration Friday, the arbs exercise their long $OEX calls. $OEX
calls—and, in fact, all index options—exercise for cash, not
for stock as an IBM call would. That is, when the index contracts
were originally designed, it was decided that it would be too
cumbersome to expect a public customer who exercised one
$OEX contract to receive 100 odd lots of different stocks. So the
contracts settle for cash in the amount of the index price less
the strike price.
Remember, though, that the arb has a two-sided position—
long $OEX calls and short the appropriate stocks. So, to com-
pletely unwind this position, the arb buys back all the short stock
TEAMFLY
Team-Fly
®
OPTION EXPIRATION AND ITS EFFECTS ON THE STOCK MARKET 143
at the close of trading on Friday with market-on-close orders. By
definition, then, since he is actually getting the last sale price of
each of the 100 stocks, he also gets the same last sale when he ex-
ercises his long $OEX calls for cash. Thus, the arbitrage is re-
moved at parity—there is no error factor or slippage.
But what has happened here? Many stocks were bought mar-
ket on close. That makes the stock market go up. Thus, we have
now identified exactly how index option expiration can have an
effect on the stock market itself. Very similar strategies apply to
index futures and index futures options as well. The largest con-
tract in the futures arena is the S&P 500 futures contract.
As the years have gone by, certain procedures have been in-
stituted by the NYSE in order to mitigate the problems associ-
ated with unwanted stock market fluctuations on expiration day.
One is that market-on-close orders must all be entered by at
least 30 minutes before the close of trading. This gives other
traders a chance to react to the perhaps abnormal buy (or sell)
imbalances that the index arb creates. More and more profes-
sional traders have come to understand how the index arb works,
so if they have some stock to sell, for whatever reason, when they
see that there is a lot of stock to buy market-on-close on expira-
tion day, they will sell into the buy orders because they can be
assured of getting a reasonably good price.
Finally, note that at some expirations, the whole process
may be reversed, and there might be sell programs entering the
market on expiration day. These would occur when the market
is declining as expiration draws near, and holders of long, in-
the-money puts sell them to take profits or to roll them. Once
again, these deeply in-the-money options (puts, in this case) fall
into the hands of arbs and market makers. In order to hedge
long puts, the arbs will buy stock in the appropriate ratio. At ex-
piration, then, to unwind their positions, they exercise the long
puts (for cash, remember) and sell their stocks. Thus, this form
of arbitrage activity will force the stock market down at the end
of the day on expiration Friday.
144 SYSTEM TRADING
During the bull market in recent years, there have been many
expirations where we saw buy programs because the bull market
created in-the-money calls—and the first example showed how
that creates arbitrage buy programs on expiration day. Con-
versely, there have only been a few expirations where sell pro-
grams were prevalent.
Another procedure instituted by the NYSE and the Chicago
Mercantile Exchange—the exchange where the S&P 500 fu-
tures are traded—is that the S&P contracts (and most other
stock index contracts) expire on the morning of expiration Fri-
day. The expiration value of the S&P 500 Index is determined by
using the opening trade on Friday morning of each of the 500
stocks in the S&P 500. Thus, the arbs remove these contracts by
executing market on open orders. This procedure was initiated
because specialists felt that it would be easier to handle big
blocks of stocks from the market-on-open orders if they had
some time during the morning to work on it, rather than having
to take on a big block of stock right at the close of trading on
Friday and then having to hold it over the weekend.
Open Interest
So now that we know how arb programs affect the market, it
makes sense to see if we can tell when these programs will come
into effect. As expiration nears, we want to know if we should
expect buy programs, sell programs, or nothing at all. As stated
earlier, arb programs are engineered with the S&P 500 futures
and futures options, too. However, it is very difficult to discern
what the arbs are really going to do with their futures because
one cannot tell if arbs are holding long or short futures against
their stocks. Hence, for predictability, $OEX options are much
easier to use.
What you need to observe is the open interest of the $OEX
in-the-money options. Open interest is merely the number of
contracts that exist—that have been opened by traders and not
OPTION EXPIRATION AND ITS EFFECTS ON THE STOCK MARKET 145
yet closed. It is reported for each option each day by the ex-
changes and the Option Clearing Corporation. The figures are
in the newspaper and on quote systems on the Internet and else-
where. So, if we monitor the open interest as expiration day ap-
proaches, we can get a pretty good idea as to whether or not
there will be arbitrage buy or sell programs.
The following example is more typical of actual situations
where the market has oscillated back and forth and there are
both in-the-money calls and in-the-money puts heading into ex-
piration week. The process is simple: For each strike, merely
calculate the total open interest of all calls with lower strike
prices, and also calculate the total open interest all puts with
higher strike prices. Then subtract the two: Total-in-the-money
call open interest minus total in-the-money put open interest. If
the resulting figure is greater that +40,000 contracts, buy pro-
grams are feasible and are probably large enough to move the
market. On the other hand, if the resulting figure is less than
−40,000, then sell programs can be expected at expiration.
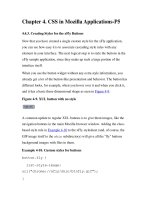
Table 4.7 shows an example of this approach. Suppose that
OEX closed at 500.93 on some day during expiration week, prior
to expiration Friday. The leftmost column in the table shows the
applicable striking prices that are near OEX’s price. The next
two columns, under the heading Raw Open Interest shows the
open interest of the calls and puts at each one of those strikes.
Next, under the column heading Running Sum, the call open in-
terest is summed—starting from the lower strike and summing
toward the higher strikes. Similarly, the put open interest is
summed, starting from the higher strikes and working down to
the lowest strikes. Finally, the running sum of the put open in-
terest is subtracted from the running sum of the call open inter-
est to produce the Net Difference.
Whenever the absolute value of the net difference is greater
than 40,000 contracts, it is probably that buy or sell programs
will be large enough to have an influence on the stock market on
expiration day or on the days immediately preceding expira
tion.
146 SYSTEM TRADING
In Table 4.7, that means that at 490 and below there would be
sell programs at expiration because the net differential is
−40,000 or less. Conversely, if $OEX is above 500 at expiration,
we would expect arbitrage buy programs because the net differ-
ential is greater than +40,000 contracts. If $OEX is between
490 and 500 at expiration, then we would not expect arbitrage
programs to have a significant effect on the stock market on
this expiration day.
Formulate a Strategy
Once you know what to expect from the arbs and—more impor-
tant—at what prices to expect it, it is much easier to formulate
a strategy as to how to approach trading near expiration. Re-
member, once again, that these examples deal with $OEX op-
tions. Although similar calculations can be made for $SPX
options and S&P futures options, the fact that those products
can be hedged by the futures makes it much more difficult to
Table 4.7 Cumulative Open Interest
OEX Close: 500.93
Raw Open Interest Running Sum
Net
Strike Calls Puts Calls Puts Difference
up through 480 12,000 12,000
485 4,000 40,000 16,000 108,000 −92,000
490 8,000 30,000 24,000 68,000 44,000 . . . Sell
495 17,000 20,000 41,000 38,000 3,000
500 30,000 10,000 71,000 18,000 53,000. . . Buy
505 40,000 5,000 111,000 8,000 103,000
510 50,000 2,000 161,000 3,000 158,000
515 35,000 500 196,000 1,000 195,000
down through 520 500
OPTION EXPIRATION AND ITS EFFECTS ON THE STOCK MARKET 147
predict what the arbs are going to do. But, for $OEX, we have a
pretty good idea. You should be aware that this is not an exact
science, for it is always possible that the arbs will roll their op-
tions out to a later expiration month, or they may decide to ex-
ercise them early—before the last Friday—so the calculations of
open interest accumulation could change. It is best to recalcu-
late these figures each day for the five to seven days preceding
expiration, in order to keep current.
Many expirations, your figures will show that there is really
very little chance of $OEX index option arbitrage affecting the
stock market. However, when there is a good chance, you can use
the hedged strategy on expiration Friday itself, or be prepared
for some “game playing” earlier in expiration week. On expira-
tion Friday itself, the $OEX arbs will unwind at the end of trad-
ing, and you can decide to do one of two things: (1) try to buy
calls if you think the arbs are going to engineer buy programs
(or buy puts if they’re going to sell), or (2) adopt a hedged strat-
egy. The first strategy is quite risky, from both the viewpoint of
timing (it’s probably best to wait until late in the day to buy op-
tions if you’re going to use this aggressive tactic) as well as from
the viewpoint that other larger institutional players may enter
the market to “meet” the arbs market on close orders and
negate the arbs’ impact on the marketplace. The second, hedged,
strategy is probably a better choice, for in it one buys 5 $OEX
expiring in-the-money options—being very careful to spend as
little as possible for time value premiums—and hedges it by sell-
ing one S&P 500 futures contract. The idea here is that you don’t
care so much about the timing of your entry point on expiration
day, nor do you care if institutions arrive to meet the arbs mar-
ket on close orders. All you want is for $OEX to outperform
$SPX on that day, and since the arbs are concentrating their ac-
tivity in exactly the 100 $OEX stocks, that should happen. Even
though all of those 100 stocks are also in the $SPX, the effect of
arb programs will be more dramatic on the $OEX than on $SPX.
Let’s use a simple example: