Model-Based Design for Embedded Systems- P35 ppsx
Bạn đang xem bản rút gọn của tài liệu. Xem và tải ngay bản đầy đủ của tài liệu tại đây (495.91 KB, 10 trang )
Nicolescu/Model-Based Design for Embedded Systems 67842_C010 Finals Page 306 2009-10-2
306 Model-Based Design for Embedded Systems
are different ways in which the cost may be calculated. Steps 6–7 in
Figure 10.12 illustrate two different types of processing elements that
may be used, and the interface to inform them which processing rou-
tine they should compute a cost for. The type of the processing element
may be changed easily to provide the necessary balance between the
speed of simulation and the required pre-simulation effort.
10.6.1.3 Mapped System
Table 10.4 describes the 48 mappings investigated. These vary from 11 PEs
to 1 PE. Partitions are broken down by the Rx, the Tx, the RLC, and the MAC
functionalities. Each is categorized into one of nine separate classes based on
the number of processing elements and the mix of pre-profiled and runtime
processing elements. Mappings are further categorized as purely runtime
processing (RTP) elements, purely profiled processing (PP) elements, or a
mix (MIX).
10.6.1.4 Results
Results relating to the design effort, the processing time, the framework sim-
ulation time, and the event processing are analyzed. Five different models
were used: a timed SystemC UMTS model [55], a timed M
ETRO II UMTS
model, an untimed M
ETRO II UMTS model, a SystemC runtime processing
model, and a M
ETRO II architectural model. In specific configurations, METRO
II constraints were used as opposed to explicit synchronization. The selection
of constraints, functional model configuration, architectural model parame-
ters, and mapping assignment is all achieved through small changes to the
top-level netlist. All results are gathered on a 1.8 GHz Pentium M laptop
running Windows XP with 1GB of RAM.
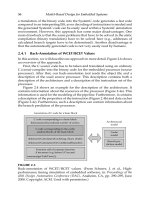
Figure 10.13 shows the UMTS estimated execution times (cycles) along
with the average processing-element utilization. Utilization is calculated as
the percentage of simulation rounds that an architectural processing element
has enabled outstanding functional model event requests for its services.
Low utilization indicates that a processing element is idle despite available,
outstanding requests. The x-axis (mapping #) is ordered by increasing execu-
tion times. The data is collected for each of the three scheduling algorithms.
For round-robin scheduling, the lowest and highest execution times are
obtained with mapping #1 (11 Sparcs) and mapping #46 (1 μBlaze), respec-
tively. Mapping #1 is 2167% faster than mapping #46. This shows a large
range in potential performances across mappings. It is interesting to note
that there are 23 different mappings that offer better performance than the
11 μBlaze or 11 ARM7 cores (mappings #2 and #3). This illustrates that inter-
processor communication is a bottleneck for many designs, and despite hav-
ing more concurrency those designs cannot keep pace with smaller, more
heavily-loaded mappings. Among all four processor systems, mapping #14
has the lowest execution time (two ARM9s used for the receiver and two
Nicolescu/Model-Based Design for Embedded Systems 67842_C010 Finals Page 307 2009-10-2
Platform-Based Design and Frameworks: METROPOLIS and METRO II 307
TABLE 10.4
Mapping Scenarios for the UMTS Case Study
# Type Partition # Type Partition # Type Partition
1 1: RTP 11 Sp 17 6: PP 2 μB (2), 2 A9 (3) 33 7: MIX A7 (4), Sp (5), μB (6), A9 (7)
22:PP 11μB 18 6: PP 2 A9 (2), 2 μB (3) 34 7: MIX A7 (4), Sp (5), A9 (6), μB(7)
3 2: PP 11 A7 19 6: PP 2 A7 (2), 2 A9 (3) 35 7: MIX A7 (4), μB (5), Sp (6), A9 (7)
4 2: PP 11 A9 20 6: PP 2 A9 (2), 2 A7 (3) 36 7: MIX A7 (4), μB (5), A9 (6), Sp (7)
5 3: RTP 4 Sp (1) 21 7: MIX Sp (4), μB (5), A7 (6), A9 (7) 37 7: MIX A7 (4), A9 (5), μB (6), Sp (7)
64:PP 4μB (1) 22 7: MIX Sp (4), μB (5), A9 (6), A7 (7) 38 7: MIX A7 (4), A9 (5), Sp (6), μB(7)
7 4: PP 4 A7 (1) 23 7: MIX Sp (4), A7 (5), μB (6), A9 (7) 39 7: MIX A9 (4), Sp (5), μB (6), A7 (7)
8 4: PP 4 A9 (1) 24 7: MIX Sp (4), A7 (5), A9 (6), μB(7) 40 7: MIX A9 (4), Sp (5), A7 (6), μB(7)
95:MIX2Sp(2),2μB (3) 25 7: MIX Sp (4), A9 (5), A7 (6), μB (7) 41 7: MIX A9 (4), μB (5), Sp (6), A7 (7)
10 5: MIX 2 μB (2), 2 Sp (3) 26 7: MIX Sp (4), A9 (5), μB (6), A7 (7) 42 7: MIX A9 (4), μB (5), A7 (6), Sp (7)
11 5: MIX 2 Sp (2), 2 A7 (3) 27 7: MIX μB (4), Sp (5), A7 (6), A9 (7) 43 7: MIX A9 (4), A7 (5), μB (6), Sp (7)
12 5: MIX 2 A7 (2), 2 Sp (3) 28 7: MIX μB (4), Sp (5), A9 (6), A7 (7) 44 7: MIX A9 (4), A7 (5), Sp (6), μB(7)
13 5: MIX 2 Sp (2), 2 A9 (3) 29 7: MIX μB (4), A7 (5), Sp (6), A9 (7) 45 8: RTP 1 Sp
14 5: MIX 2 A9 (2), 2 Sp (3) 30 7: MIX μB (4), A7 (5), A9 (6), Sp (7) 46 9: PP 1 μB
15 6: PP 2 μB (2), 2 A7 (3) 31 7: MIX μB (4), A9 (5), A7 (6), Sp (7) 47 9: PP 1 A7
16 6: PP 2 A7 (2), 2 μB (3) 32 7: MIX μB (4), A9 (5), Sp (6), A7 (7) 48 9: PP 1 A9
(1=RxMAC,TxMAC,RxRLC,TxRLC),(2=RxMAC,RxRLC),(3=TxMAC,TxRLC)
(4 = Rx MAC), (5)(Rx RLC), (6)(Tx MAC), (7 = Tx RLC) (Sp = Sparc, μB = Microblaze, A7 = ARM7, A9 = ARM9)
Nicolescu/Model-Based Design for Embedded Systems 67842_C010 Finals Page 308 2009-10-2
308 Model-Based Design for Embedded Systems
0.0E + 00
1 4 14 31 37 26 27 33 13 5 8
45 48 12 24 29 30 43 19 35 10 21 36 42 17 2 22 28 39 41 32 25 34 44 20 23 38 11 15 18 40 3 7 9 16 6 47
46
1.0E + 07
2.0E + 07
3.0E + 07
4.0E + 07
5.0E + 07
6.0E + 07
Mapping
Execution cycles
0%
10%
20%
30%
40%
50%
60%
70%
80%
90%
100%
110%
Percentage utilization per PE
RR Ex PR Ex FCFS Ex RR Util PR Util FCFS Util
UMTS estimated execution time and utilization for various OS scheduling policies
FIGURE 10.13
The UMTS estimated execution time vs. utilization for various OS scheduling policies.
Nicolescu/Model-Based Design for Embedded Systems 67842_C010 Finals Page 309 2009-10-2
Platform-Based Design and Frameworks: METROPOLIS and METRO II 309
Sparcs used for the transmitter). Mapping #31 has a similar execution time
with four different processors (Rx MAC on μBlaze, Rx RLC on ARM9, Tx
MAC on ARM7, and Tx RLC on Sparc). Many of the execution times are
similar and the graph shows that there are essentially four performance
groupings.
The lowest utilization values for round robin occur in the 11 processor
setups (an average of 15%). The highest is 100% for all single processor
setups. The max utilization before 100% is 39%. This gap points to ineffi-
ciency in the round-robin scheduler. It may be a goal of the other scheduling
algorithms to close this gap. Also notice that for similar execution times, uti-
lization can vary as much as 28% (mappings #41 and #32, for example).
The priority-based scheduling keeps the same relative ordering amongst
the execution times but reduces them on average by 13%. The highest is an
18% reduction (mapping #22, for example) and the smallest reduction is 9%
(mapping #8, for example). The utilization numbers are actually reduced
as well by an average of 2%. The largest reduction was 7% (in mapping
#6, for example) and the smallest was 1% (in mapping #31, for example).
As expected there was no change in the utilization or execution times for
mappings involving either eleven processing elements (fully concurrent) or
those with one element (no scheduling options). The utilization drop results
from high-priority, data-dependent jobs running before low-priority, data-
independent jobs.
The FCFS scheduling also does not change the relative ordering of execu-
tion times but is not as successful at reducing them. The average reduction
is only 7%. The maximum reduction is 11% (in mapping #24, for example)
and the minimum reduction is 4% (in mapping #5, for example). However,
utilization is increased by 27%. The max increase was 45% (in mapping
#31, for example) and the minimum improvement was 20% (in mapping #5,
for example). The FCFS increases utilization due to the fact that many jobs
that would be low priority often request processing in the same round as
high-priority jobs. While technically they are both “first,” the priority would
negate this fact. The FCFS’s round-robin tie-breaking scheme helps smaller
jobs in this case.
The analysis of execution and utilization for the UMTS shows that high
utilization is difficult to obtain due to the data dependencies in the applica-
tion. Also, some of the partitions explored do not balance computation well
amongst the different processing elements in the architecture. Many of the
coarser mappings only make this problem worse. A solution is to further
refine the functional model to extract more concurrency. From an execution-
time standpoint, scheduling can improve the overall execution time but not
as much as is needed to make a large majority of these mappings desirable
for an actual implementation.
An accuracy comparison was performed with mappings #2, #6, and #46
(pure μBlaze mappings). These designs were created on the Xilinx ML310
development board. For mappings #2 and #46, there was only a 3.1% and
Nicolescu/Model-Based Design for Embedded Systems 67842_C010 Finals Page 310 2009-10-2
310 Model-Based Design for Embedded Systems
a 2% increase, respectively, in execution times in the actual designs. For
mapping #6 (when scheduling affects the outcome), the increase was 16.2%
(RR), 18% (PR), and 15% (FCFS). Mapping #46 inaccuracy is due to the start-
up code and IO operations not captured by the model. Mapping #2 suffers
from a slightly oversimplified point-to-point communication scheme in the
model as compared to the FSL links used by the MicroBlazes. Finally, map-
ping #6 requires a more refined OS model to more closely match the schedul-
ing overhead of the actual OS used. This comparison shows that M
ETRO II
simulation can closely (within 5%) reflect actual implementations, and in
the cases where the differences are greater, a trade-off between the mod-
eling detail, the simulation performance, and the accuracy can be quickly
analyzed.
The untimed M
ETRO II UMTS functional model contains 12 processes
while the architectural model may contain up to 26 processes. This is a large
design, spread across 85 files and 8,300 lines of code. The changing of a map-
ping is trivial however, which requires only changing a few macros and
recompiling two files (2.3% of total; <20 s). All 48 mappings can be done
in less than 16 min.
The conversion of the SystemC timed functional model to an untimed
M
ETRO II functional model removes 1081 lines of code (related to scheduling
and timing—both of which are in the architecture model). M
ETRO II mapping
removes much of the overhead associated with the SystemC model synchro-
nization.
M
ETRO II constraints for the read/write semantics of a FIFO only require
60 lines of code, which is 1.4% of the total code cost. The average difference
of the entire conversion to M
ETRO II was only 1% per file. More than half of
these lines (58%) have to do with registering the constraints with the solvers.
The conversion of a SystemC runtime processing model (the Sparc pro-
cessing element) to M
ETRO II only requires 92 additional lines. This was a
mere 3.4% increase (2773 lines to 2681 lines). This includes adding sup-
port for loading a new code at runtime, returning the cost of operation to
the netlist, and exposing events for mapping. This result is encouraging for
importing code.
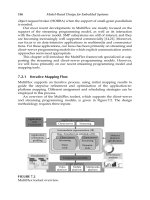
Figure 10.14 illustrates the percentage of the actual simulation runtime
spent in each of M
ETRO II’s simulation phases for the nine classes of map-
pings. The SystemC entry indicates the time spent in the SystemC simulation
infrastructure upon which M
ETRO II is built.
On an average, 61% of the time is spent in Phase 1 (lowest section on
the bar graph), 5% in Phase 2 (second section), and 17% in Phase 3 (third
section). For models with only runtime processing elements (R), the aver-
ages are 93%, 0.9%, and 3%, respectively. This indicates that in runtime
processing, the M
ETRO II activities of annotation and scheduling are negli-
gible in the runtime picture. For pure profiled (P) mappings, they are 21%,
7%, and 26%. In this case, one can see that M
ETRO II now accounts for a
greater percentage of runtime. (Phase 1 alone is the representative of other
Nicolescu/Model-Based Design for Embedded Systems 67842_C010 Finals Page 311 2009-10-2
Platform-Based Design and Frameworks: METROPOLIS and METRO II 311
Runtime spent in different phases
0%
10%
20%
30%
40%
50%
60%
70%
80%
90%
100%
Mix
avg
Avg.PP avgRTP
avg
987654321
Class
Percentage runtime
System C
Phase 3
Phase 2
Phase 1
FIGURE 10.14
M
ETRO II phase runtime analysis.
simulation environments.) For mixed classes, the numbers are 82%, 2.6% and
7.6%. Again the runtime processing elements dominate. It should be noted
that while Ps have higher averages, the average runtime toprocess 7000 bytes
of data was 54 seconds. The Phase 1 runtime and the SystemC overhead are
the main contributors to overall runtime.
If we consider the SystemC timed functional model, the M
ETRO II timed
functional model, and the M
ETRO II untimed functional model mapped to an
architecture, the M
ETRO II timed functional model had an average increase of
7.4% in runtime for the nine classes while the mapped version had a 54.8%
reduction. This reduction is due to the fact that M
ETRO II Phases 2 and 3
have significantly less overheads than the timer- and scheduler-based sys-
tem required by the SystemC timed functional model.
Table 10.5 shows the average number of event state changes per phase
and the average number of phases an event waits.
On an average, only 0.14 events are annotated or scheduled per round.
Because of the architectural model integration with the UMTS functional
model, there are a limited number of synchronization points (which satisfy a
rendezvous constraint, and, hence, an event state change). As shown in Fig-
ure 10.14, Phases 2 and 3 do not account for a large portion of the runtime, so,
while the event state change activity is low, it does not translate to increased
runtime. Runtime is not increased directly by changing an event’s state, but
rather by the total number of events in Phases 2 and 3.
Nicolescu/Model-Based Design for Embedded Systems 67842_C010 Finals Page 312 2009-10-2
312 Model-Based Design for Embedded Systems
TABLE 10.5
METRO II Phase Event Analysis
Class Event/Ph. Comp. % Comm. % Coord. % Avg Wait
1 0.091 0.083 0.083 0.833 3839.240
2 0.091 0.083 0.083 0.833 3839.240
3 0.169 0.125 0.042 0.833 6276.190
4 0.169 0.125 0.042 0.833 6276.190
5 0.131 0.170 0.114 0.716 5117.003
6 0.169 0.170 0.114 0.716 6276.190
7 0.150 0.101 0.088 0.811 5691.130
8 0.176 0.319 0.043 0.638 6718.550
9 0.176 0.319 0.043 0.638 6718.550
Avg 0.147 0.166 0.072 0.761 5639.143
Events in Classes 1 and 2 on average wait 42% less than the worse case.
These classes are precisely those that provide maximum concurrency (11
processing elements). The worst is in Classes 8 and 9 (single processing ele-
ments). As one would expect, when the scheduling overhead is lower and
more processing elements are available, events wait much less for resource
availability.
Finally, it should be noted that runtime processing vs. pre-profiled pro-
cessing does not impact this aspect of simulation. Comparing Classes 1 with
2 or 3 with 4 confirms this. This contrasts heavily with the runtime of the
simulation (in which the PE type is a key factor). The runtime processing in
the microarchitectural model is treated as a black box by M
ETRO II such that
the internal events are unseen and do not trigger phase changes. This indi-
cates that SystemC components can be imported quite easily into M
ETRO II
without affecting the three-phase execution semantics.
The 3rd, 4th, and 5th columns of Table 10.5 categorize the events in
Phase 1. Computational events request processing-element services directly.
Communication events transfer data between FIFOs, and coordination
events maintain correct simulation semantics and operation. The table indi-
cates that events in the system are heavily related to coordination. Classes 8
and 9 have the lowest percentage of coordination events (64%), since these
are single-PE systems.
10.6.1.5 Conclusions
We illustrated how an event-based design framework, M
ETRO II, may be used
to carry out architectural modeling and design-space exploration. Experi-
mental results show that M
ETRO II is capable of capturing functional mod-
eling, architectural modeling, and mapping for a UMTS case study with
limited overhead as compared with a baseline SystemC model. We showed
that the design effort involved in carrying out 48 separate mappings with a
variety of architectural models is minimal. Within the framework, we detail
Nicolescu/Model-Based Design for Embedded Systems 67842_C010 Finals Page 313 2009-10-2
Platform-Based Design and Frameworks: METROPOLIS and METRO II 313
the runtime spent in the three different M
ETRO II execution phases and pro-
vide an idea of how events move throughout the system.
Future work involves identifying and removing events not relevant for
annotation or scheduling from M
ETRO II’s second and third phases, support
for a wider variety of declarative constraints, and the analysis of other appli-
cations that may be mapped onto similar architectural platforms.
10.6.2 Intelligent Buildings: Indoor Air Quality
The construction of future energy-efficient commercial buildings will make
use of sophisticated control architectures that are able to sense several phys-
ical quantities, compute control laws, and apply control actions through
actuators. Sensors, actuators, and computation units are physically dis-
tributed over the buildings. The control algorithm can be run on either
distributed controllers or a central controller. The control performance is crit-
ically affected by both computation and communication delays that need to
be within precise bounds in order to guarantee energy savings while main-
taining the comfort level. Thus, a major challenge in designing such systems
is to balance the computation and communication efforts. In particular, a
designer needs to decide how to map the control algorithm on a set of con-
trollers and needs to find an optimal communication network, meaning the
communication medium and the network topology.
The goal of this case study is to model and simulate the control of the
temperature in the rooms of a building at a high level of abstraction. The
simulation results will be used to partition the sensor–actuator delay into
computation and communication latency requirements. The communication
latency requirements are then passed to an optimization tool that finds the
best communication network that supports the gathering of data from the
sensors and the delivery of commands to actuators.
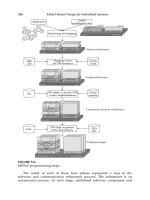
Our design flow is shown in Figure 10.15. In Step 1, both the function-
ality of the system and the architecture platform are modeled. The map-
ping between function and architecture models is carried out where the
controllers and the point-to-point communication between sensors, actu-
ators, and controllers are annotated with actual computation delays and
virtual communication delays. The performance of the control algorithm is
evaluated for different values of the communication delays until the least
constraining latency requirements are found. The communication require-
ments are then passed to an external network synthesis tool—the commu-
nication synthesis infrastructure (COSI) [51]. In Step 2, the COSI synthe-
sizes the communication network of the system based on the simulation
results. Then, in Step 3, the abstract point-to-point communication channels
are mapped to the communication network obtained by COSI.
Both the functionality and the architecture platforms of the control sys-
tem are modeled in M
ETRO II, while the environment dynamics is modeled
in OpenModelica [27], an external simulation tool. OpenModelica interacts
Nicolescu/Model-Based Design for Embedded Systems 67842_C010 Finals Page 314 2009-10-2
314 Model-Based Design for Embedded Systems
Step 1: modeling and
simulation
Mapping
Function
model
Architecture
model
Step 3: refinement
COSI
synthesis
results
Simulation
results
COSI
Step 2: synthesis
FIGURE 10.15
Design flow of the room temperature control system.
with the function model of the system. The M
ETRO II function model of
a two-room example and its interaction with OpenModelica is shown in
Figure 10.16. The environment dynamics is described in the Modelica
programming language. The Modelica language is designed to allow
Modelica
model
OpenModelica
CORBA communication
M
ETRO II
Interface to
OpenModelica
Controller1
FIFO_s1c
FIFO_s2c
FIFO_a1c
FIFO_a2c
Controller2
S2
S1
A2
A1
FIGURE 10.16
M
ETRO II function model and OpenModelica.
Nicolescu/Model-Based Design for Embedded Systems 67842_C010 Finals Page 315 2009-10-2
Platform-Based Design and Frameworks: METROPOLIS and METRO II 315
convenient, component-oriented modeling of complex physical systems, e.g.,
systems containing mechanical, electrical, electronic, hydraulic, thermal, con-
trol, electric power, or process-oriented subcomponents [46]. The Modelica
model in the indoor air quality case study deals with pressure and tempera-
ture dynamics in an indoor environment. It takes into account the structure
of the building, its floorplan, the sizes of the different rooms, and the place-
ment of doors and windows. Moreover, it includes outlet vents that can inject
a cold/hot air flow to perform cooling/heating of the environment; they are
the actuators of the control system, but expressed in Modelica in terms of
their effect on the temperature and pressure dynamics of the system.
The M
ETRO II model and the Modelica model are run together (co-
simulation [57]). Sensors and actuators in the functional model interact with
the plant to retrieve temperature values in the different rooms and to set the
status (closed/open; hot/cold air flow) of the vents. These operations obvi-
ously require synchronization and information exchange between the tools.
They are managed by the environment functional module, which controls
the execution of the Modelica model (start and stop the simulation) and it
is able to set and get the value of its parameters. From an implementation
point of view, this interaction is performed by the remote calling of a set of
services provided by OpenModelica over a CORBA connection [18] estab-
lished between the tools.
The architecture model includes generic electronic control units (ECUs)
communicating with sensors and actuators. During mapping, the controllers
in the function model are allocated onto ECUs. If multiple controllers are
mapped onto one ECU, a M
ETRO II scheduler is constructed to coordinate
their executions. Various scheduling policies can be applied by designing
different types of schedulers, while keeping the controller tasks intact. In
our example, we use round-robin scheduling. Sensors and actuators in the
function model are mapped to architectural sensors and actuators. The com-
munication between ECUs and sensoring/actuating units is modeled at an
abstract level in Step 1 of the design flow. The services of sensing, computing
control algorithms, and actuating are annotated with time by M
ETRO II anno-
tators. The end-to-end delays from sensing to actuating are computed dur-
ing simulation. The simulation results are sent to COSI, which synthesizes
the communication network in Step 2 of the design flow. Then the synthesis
results are utilized to refine the abstract communication network in Step 3 of
the flow.
10.7 Conclusions
We discussed the trends and challenges of system design from a broad per-
spective that covers both semiconductor and industrial segments that use