Model-Based Design for Embedded Systems- P10 ppt
Bạn đang xem bản rút gọn của tài liệu. Xem và tải ngay bản đầy đủ của tài liệu tại đây (499.6 KB, 10 trang )
Nicolescu/Model-Based Design for Embedded Systems 67842_C003 Finals Page 66 2009-10-13
66 Model-Based Design for Embedded Systems
in the application binary. Depending on the current cache state and the
execution history, cache misses may occur at different points in time. How-
ever, formal methods are able to identify for each basic block the maximum
number of cache misses that may occur during the execution [46]. The con-
trol flow graph can be annotated with this information, making the longest
path analyses feasible again.
Depending on the actual system configuration, the upper bound on the
number of transactions per task execution may not be sufficiently accurate.
In a formal model, this could translate into an assumed burst of requests
that may not occur in practice. This can be addressed with a more detailed
analysis of the task control flow, as is done in [1,39], which provides bounds
on the minimum distances between any n requests of an activation of that
task. This pattern will then repeat with each task activation.
This procedure allows to conservatively derive the shared resource
request bound functions ˜η
+
τ
(w) and ˜η
−
τ
(w) that represent the transaction traf-
fic that each task τ in the system can produce within a given time window
of size w. Requesting tasks that share the same processor may be executed in
alternation, resulting in a combined request traffic for the complete proces-
sor. This again can be expressed as an event model. For example, a straight-
forward approach is to approximate the processor’s request event model (in
a given time window) with the aggregation of the request event models of
each individual task executing on that processor. Obviously, this is an over-
estimation, as the tasks will not be executed at the same time, but rather the
scheduler will assign the processor exclusively. The resulting requests will
be separated by the intermediate executions, which can be captured in the
joint shared resource request bound by a piecewise assembly from the ele-
mentary streams [39].
3.3.2 Response Time Analysis in the Presence of Shared Memory
Accesses
Memory access delays may be treated differently by various processor imple-
mentations. Many processors, and some of the most commonly used, allow
tasks to perform coprocessor or memory accesses by offering a multi-cycle
operation that stalls the entire processor until the transaction has been pro-
cessed by the system [44]. In other cases, a set of hardware threads may allow
to perform a quick context switch to another thread that is ready, effectively
keeping the processor utilized (e.g., [17]). While this behavior usually has
a beneficial effect on the average throughput of a system, multithreading
requires caution in priority-based systems with reactive or control applica-
tions. In this case, the worst-case response time of even high-priority tasks
may actually increase [38].
The integration of dynamic memory access delays into the real-time anal-
ysis will in the following be performed for a processor with priority-based
preemptive scheduling that is stalled during memory accesses. In such a
Nicolescu/Model-Based Design for Embedded Systems 67842_C003 Finals Page 67 2009-10-13
Formal Performance Analysis 67
system, a task’s worst-case response time is determined by the task’s worst-
case execution time plus the maximum amount of time the task can be kept
from executing because of preemptions by higher-priority tasks and blocking
by lower-priority tasks. A task that performs memory accesses is addition-
ally delayed when waiting for the arrival of requested data. Furthermore,
preemption times are increased, as the remote memory accesses also cause
high-priority tasks to execute longer.
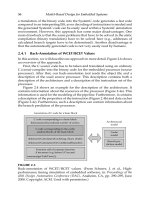
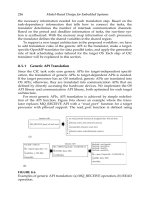
A possible runtime schedule is depicted in Figure 3.5. In the case where
both tasks execute in the local memory (Scenario 3.5a), the low-priority task
is kept from executing by three invocations of the high-priority tasks. Local
memory accesses are not explicitly shown, as they can be considered to be
part of the execution time. When both tasks access the same remote mem-
ory (Scenario 3.5b), the finishing time of the lower-priority task increases,
because it itself fetches data from the remote memory, and also because of
the prolonged preemptions by the higher-priority task (as its request also
stalls the processor). The execution of the low-priority task in the example
is now stretched such that it suffers from an additional preemption of the
other task. Finally, Scenario 3.5c shows the effect of a task on another core
CPUb that is also accessing the same shared memory, in this case, periodi-
cally. Whenever the memory is also used by a task on CPUb, CPUa is stalled
for a longer time, again increasing the task response times, possibly leading
to the violation of a given deadline. As the busy wait adds to the execution
t
(a)
Preemption
Stalling
CPU
Memory
CPU
(b)
Memory
CPUa
CPUb
(c)
FIGURE 3.5
Tasks on different processors accessing a shared memory. (a and b) Single
processor case and (c) conflicts from another CPU.
Nicolescu/Model-Based Design for Embedded Systems 67842_C003 Finals Page 68 2009-10-13
68 Model-Based Design for Embedded Systems
time of a task, the total processor load increases—possibly making the overall
system unschedulable.
On the basis of these observations, a response time equation can be
derived for the example scheduler. The response time represents the sum
of the following:
• The core execution times of all tasks mapped to the processor, and their
activation event models.
• The increased blocking time due to the resources being stalled during
memory accesses. (This is not shown in the example.)
• The aggregate delay caused by the memory accesses that is a function
of the memory accesses of a specific task and its higher-priority tasks.
This is investigated in Section 3.3.3.
Variations of such a response time analysis have been presented for
single- and multithreaded static-priority preemptive scheduling [38], as well
as for round-robin scheduling [41]. Other scheduling policies for which clas-
sical real-time analysis is available can be straight-forwardly extended to
include memory delays by including a term that represents the aggregate
busy time due to memory accesses.
3.3.3 Deriving Aggregate Busy Time
Deriving the timing of many memory accesses has recently become an
important topic in real-time research. Previously, the worst-case timing of
individual events was the main concern. Technically, a sufficient solution
to find the delay that a set of many events may experience, is to derive
the single worst-case load scenario and assume it for every access. How-
ever, not every memory request will experience a worst-case system state,
such as worst-case time wheel positions in the time division multiple access
(TDMA) schedules, or transient overloads in priority-based components. For
example, the task on CPUb in Figure 3.5 will periodically access the shared
memory, and, as a consequence, disturb the accesses by the two tasks on
CPUa. A “worst-case memory access” will experience this delay, but of all
accesses from CPUb, this happens maximally three times in this example.
Thus, accounting this interference for every single memory access leads to
very unsatisfactory results—which has previously prevented the use of con-
servative methods in this context.
The key idea is instead to consider all requests that are processed during
the lifetime of a task jointly. We therefore introduce the worst-case accumu-
lated busy time, defined as the total amount of time, during which at least one
request is issued but is not finished. Multiple requests in a certain amount of
time can in total only be delayed by a certain amount of interference, which
is expressed by the aggregate busy time.
This aggregate busy time can be efficiently calculated (e.g., for a shared
bus): a set of requests is issued from different processors that may interfere
Nicolescu/Model-Based Design for Embedded Systems 67842_C003 Finals Page 69 2009-10-13
Formal Performance Analysis 69
with each other. The exact individual request times are unknown and their
actual latency is highly dynamic. Extracting detailed timing information
(e.g., when a specific cache miss occurs) is virtually impossible and consid-
ering such details in a conservative analysis yields exponential complexity.
Consequently, we disregard such details and focus on bounding the aggre-
gate busy time. Given a certain level of dynamism in the system, this con-
sideration will not result in excessive overestimations. Interestingly, even in
multithreaded multicore architectures, the conservatism is moderate, sum-
ming up to less than a total of 25% of the overestimated response time, as
shown in practical experiments [42].
Without bus access prioritization, it has to be assumed that it is possi-
ble for every transaction issued by any processor during the lifetime of a
task activation i that it will disturb the transactions issued by i. Usually, the
interference is then given by the transactions issued by the other concur-
rently active tasks on the other processors, as well as the tasks on the same
processor as their requests are treated on a first-come-first-served basis. The
interested readers are referred to [40] for more details on the calculation of
aggregate memory access latencies.
If a memory controller is utilized, this can be very efficiently consid-
ered. For example, all requests from a certain processor may be prioritized
over those of another. Then, the imposed interference by all lower-priority
requests equals zero. Additionally, a small blocking factor of one elementary
memory access time is required, in order to model the time before a transac-
tion may be aborted for the benefit of a higher-priority request.
The compositional analysis approach of Section 3.2, used together with
the methods of Section 3.3, now delivers a complete framework for the
performance analysis of heterogeneous multiprocessor systems with shared
memories. The following section turns to detailed modeling of inter-
processor communication with the help of HEMs.
3.4 Hierarchical Communication
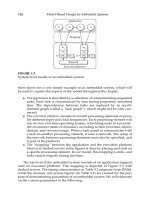
As explained in Section 3.2, traditional compositional analysis models bus
communication by a simple communication task that is directly activated by
the sending task, and which directly activates the receiving task. Figure 3.6
shows a simple example system that uses this model for communication,
where each output event of the sending tasks, T
a
and T
b
, triggers the trans-
mission of one message over the bus.
However, the modern communication stacks employed in today’s
embedded control units (ECUs), for example, in the automotive domain,
make this abstraction inadequate. Depending on the configuration of the
communication layer, the output events (called signals here) may or may
Nicolescu/Model-Based Design for Embedded Systems 67842_C003 Finals Page 70 2009-10-13
70 Model-Based Design for Embedded Systems
T
a
T
c
T
d
T
b
ECU1 Bus
C
1
C
2
ECU2
FIGURE 3.6
Traditional model.
ES
a
HES
a,b
ES
b
ECU1 Bus ECU2
T
c
T
d
T
b
C
T
a
FIGURE 3.7
Communication via ComLayer.
not directly trigger the transmissions of messages (called frames here).
For instance, AUTOSAR [2] defines a detailed API for the communication
stack, including several frame transmission modes (direct, periodic, mixed,
or none) and signal transfer properties (triggered or pending) with key
influences on communication timings. Hence, the transmission timings of
messages over the bus do not have to be directly connected to the output
behaviors of the sending tasks anymore, but they may even be completely
independent of the task’s output behavior (e.g., sending several output
signals in one message).
In the example shown in Figure 3.7, the tasks T
a
and T
b
produce output
signals that are transmitted over the bus to the tasks T
c
and T
d
. The send-
ing tasks write their output data into registers provided by the communi-
cation layer, which is responsible for packing the data into messages, called
frames here, and triggering the transmission of these frames according to the
signal types and transmission modes. On the receiving side, the frames are
unpacked, which means that the contained signals are again written into dif-
ferent registers for the corresponding receiving task. Using flat event models,
the timings of signal arrivals can only be bound with a large overestimation.
To adequately consider such effects of modern communication stacks in
the system analysis, two elements must be determined:
1. The activation timings of the frames
2. The timings of signals transmitted within these frames arriving at the
receiving side
To cope with both the challenges, we introduce hierarchical event streams
(HESs) modeled by a HEM, which determines the activating function of the
frame and also captures the timings of the signals assignedtothat frame, and,
Nicolescu/Model-Based Design for Embedded Systems 67842_C003 Finals Page 71 2009-10-13
Formal Performance Analysis 71
most importantly, defines how the effects on the frame timings influence the
timings of the transmitted signals. The latter allows to unpack the signals
on the receiving side, giving tighter bounds for the activations of those tasks
receiving the signals.
The general idea is that a HES has one outer representation in the form
of an event stream ES
outer
, and each combined event stream has one inner
representation, also in the form of an event stream ES
i
, where i denotes the
task to which the event stream corresponds. The relation between the outer
event stream and the inner event stream depends on the hierarchical stream
constructor (HSC) that combined the event streams. Each of the involved
event streams is defined by functions δ
−
(n) and δ
+
(n) (see Section 3.2.2),
returning the minimum and the maximum distance, respectively, between n
consecutive events.
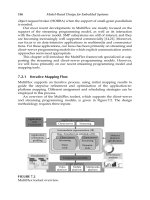
Figure 3.8 illustrates the structure of the HES at the input of the chan-
nel C of the example shown in Figure 3.7. The HSC combines the output
streams of the tasks T
a
and T
b
, resulting in the hierarchical input stream of
the communication task C. According to the properties and the configuration
of the communication layer that is modeled by the HSC, the inner and outer
event streams of the HES are calculated. Each event of the outer event stream,
ES
outer
, represents the sending of one message by the communication layer.
The events of a specific inner event stream, ES
a
and ES
b
, model the timings of
only those messages that contain data from the corresponding sending tasks.
The detailed calculations of the inner and outer event streams, considering
the different signal properties and frame transmission modes, are presented
in [37].
For the local scheduling analysis of the bus, only the outer event stream
is relevant. As a result, the best-case response time, R
min
, and the worst-case
HES
a,b
ES
outer
HSC
Distances between total message releases
Distances between
messages containing a
new signal from T
b
Distances between
messages containing a
new signal from T
b
δ(n)
δ(n)
δ(n)
δ
–
(n)
δ
–
(n)δ
–
(n)
23456
23456
23456
n
n
n
δ
+
(n)
δ
+
(n)δ
+
(n)
HSC
HSC
ES'
b
ES'
b
ES'
a
ES'
a
ES
a
ES
outer
ES
b
FIGURE 3.8
Structure of the hierarchical input stream of C.
Nicolescu/Model-Based Design for Embedded Systems 67842_C003 Finals Page 72 2009-10-13
72 Model-Based Design for Embedded Systems
response time, R
max
, are obtained. Based on the outer event stream, ES
outer
,
of the hierarchical input stream, we obtain the outer event stream, ES
outer
,of
the hierarchical output stream by using the following equations:
δ
−
outer
(n) = max{δ
−
outer
(n) − J
resp
, δ
−
outer
(n − 1) + d
min
} (3.2)
δ
+
outer
(n) = max{δ
+
outer
(n) + J
resp
, δ
+
outer
(n − 1) + d
min
} (3.3)
In fact, Equations 3.2 and 3.3 are generalizations of the output model calcu-
lation presented in Equation 3.1. As can be seen, actually two changes have
been made to the message timing. First, the minimum (maximum) distance
between a given number of events decreases (increases) by no more than the
response time jitter, J
resp
= R
max
− R
min
. Second, two consecutive events
at the output of the channel are separated by at least a minimum distance,
d
min
= R
min
. The resulting event stream, modeled by δ
−
outer
(n) and δ
+
outer
(n),
becomes the outer stream of the output model.
To obtain the inner event streams, ES
i
, of the hierarchical output stream,
we adapt the inner event streams, ES
i
, of the hierarchical input stream
according to the changes applied to the outer stream. For the adaptation,
we consider the two changes mentioned above separately. First, consider
that the minimum distance between n messages decreases by J
resp
. Then,
the minimum distance between k messages that contain the data of a spe-
cific task decreases by J
resp
. Second, we must consider that two consecu-
tive messages become separated by a minimum distance d
min
. Figure 3.9a
illustrates a sequence of events consisting of two different event types,
a and b. Assume that this event sequence models the message timing, where
the events labeled by a lowercase a correspond to the messages containing
data from task T
a
, and the events labeled by a lowercase b correspond to the
messages containing data from task T
b
. Figure 3.9b shows how this event
sequence changes when a minimum distance d
min
between two consecutive
events is considered. As indicated, the distance between the last two events
of type b further decreases because of the minimum distance. Likewise, the
maximum distance increases because of the minimum distance, d
min
, as can
be seen for the first and the second of the events of type b. Based on the min-
imum distance, d
min
, the maximum possible decrease (increase), D
max
,inthe
δ
+
b
(2)
ab a
(a)
(b)
ab b t
δ
–
b
(2)
δ
+
b
(2)
d
min
a
b
a
a
b b t΄
δ
–
b
(2)
FIGURE 3.9
(a) The event sequence before applying the minimum distance and (b) the
event sequence after considering the minimum distance d
min
.
Nicolescu/Model-Based Design for Embedded Systems 67842_C003 Finals Page 73 2009-10-13
Formal Performance Analysis 73
minimum (maximum) distance between events that can occur because of the
minimum distance can be calculated. Note that, in the case of large bursts,
D
max
can be significantly larger than d
min
, since an event can be delayed by
its predecessor event, which itself is delayed by its predecessor and so on.
More details can be found in [37].
In general, considering the response time jitter, J
resp
, and the minimum
distance, d
min
, the inner stream of the hierarchical output stream, modeling
messages that contain data from the task T
i
, can be modeled by
δ
−
i
(n) = max{δ
−
i
(n) − J
resp
−D
max
, δ
−
i
(n − 1) + d
min
},
δ
+
i
(n) = δ
+
i
(n) + J
resp
+D
max
To determine the activation timings of the receiving tasks, T
c
and T
d
,we
now have not only the arrival times of messages, but also the timings of
exactly those messages that contain new data from a certain sending task,
given by the corresponding inner stream. Assuming that the task T
c
is only
activated every time a new signal from the task T
a
arrives, then the inner
event stream ES
a
of the hierarchical output stream of the communication
task C can directly be used as an input stream of the task T
c
.
It is also possible to have event streams with multiple hierarchical lay-
ers, for example, when modeling several layers of communication stacks or
communications over networks interconnected by gateways, where several
packets may be combined into some higher-level communication structure.
This can be captured by our HEM by having an inner event stream of a HES
that is the outer event stream of another HEM. For more details on multilevel
hierarchies, refer to [36].
3.5 Scenario-Aware Analysis
Because of the increasing complexity of modern applications, hard real-time
systems are often required to run different scenarios (also called operating
modes) over time. For example, an automotive platform may exclusively exe-
cute either an ESC or a parking-assistant application. While the investigation
of each static scenario can be achieved with classical real-time performance
analysis, timing failures during the transition phase can only be uncovered
with new methods, which consider the transient overload situation during
the transition phase in which both scenarios can impress load artifacts on the
system.
Each scenario is characterized by a specific behavior and is associated
with a specific set of tasks. A scenario change (SC) from one scenario to
another is triggered by a scenario change request (SCR) which may be caused
either by the need to change the system functionality over time or by a system
Nicolescu/Model-Based Design for Embedded Systems 67842_C003 Finals Page 74 2009-10-13
74 Model-Based Design for Embedded Systems
transition to a specific internal state requiring an SC. Depending on the task
behavior across an SC, three types of tasks are defined:
• Unchanged task: An unchanged task belongs to both task sets of the ini-
tial (old) and the new scenario. It remains unchanged and continues
executing normally after the SCR.
• Completed task: A completed task only belongs to the old scenario task
set. However, to preserve data-consistency, completed task jobs acti-
vated before the SC are allowed to complete their execution after the
SCR. Then the task terminates.
• Added task: An added task only belongs to the new scenario task set.
It is initially activated after the SCR. Each added task is assigned an
offset value, φ, that denotes its earliest activation time after the SCR.
During an SC, executions of completed, unchanged, and added tasks may
interfere with one another, leading to a transient overload on the resource.
Since the timing requirements in the system have to be met at any time dur-
ing the system execution, it is necessary to verify if task deadlines could be
missed because of an SC.
Methods analyzing the timing behavior across an SC under static-priority
preemptive scheduling already exist [32,45,47]. However, they are limited
to independent tasks mapped on single resources. Under such an assump-
tion, the worst-case response time for an SC for a given task under analysis
is proved to be obtained within the busy window during which the SCR
occurs, called the transition busy window. These approaches can however
not be applied to distributed systems because of the so-called echo effect.
The echo effect is explained in the following section using the system exam-
ple in Figure 3.11.
3.5.1 Echo Effect
The system used in the experiments of Section 3.8 (depicted in Figure 3.11)
represents a hypothetical automotive system consisting of two IP compo-
nents, four ECUs, and one multicore ECU connected via a CAN bus. The
system is assumed to run two mutually exclusive applications: an ESP
application (Sens1, Sens2 → eval1,eval2) and a parking-assistant application
(Sens3 → SigOut). A detailed system description can be found in Section 3.8.
Let us focus on what happens on the CAN bus when the ESP application
is deactivated (Scenario 1) and the parking-assistant application becomes
active (Scenario 2). Depending on which application a communication task
belongs to, we can determine the following task types on the bus when an SC
occurs from Scenario 1 to Scenario 2: C1andC5 are unchanged communica-
tion tasks, C3andC4 are added communication tasks, and C2 is a completed
communication task. Furthermore, we assume the following priority order-
ing on the bus: C1 > C2 > C3 > C4 > C5.
Nicolescu/Model-Based Design for Embedded Systems 67842_C003 Finals Page 75 2009-10-13
Formal Performance Analysis 75
When an SC occurs from Scenario 1 to Scenario 2, the added communica-
tion task C3 is activated by events sent by the task mon3. However, C3 may
have to wait until the prior completed communication task C2 finishes exe-
cuting before being deactivated. This may lead to a burst of events waiting at
the input of C3 that in turn may lead to a burst of events produced at its out-
put. This burst of events is then propagated through the task ctrl3onECU4
to the input of C4. In between, this burst of events may have been ampli-
fied because of scheduling effects on ECU4 (the task ctrl3 might have to wait
until calc finishes executing). Until this burst of events arrives at C4’s input—
which is a consequence of the SC on the bus—the transition busy window
might already be finished on the bus. The effect of the transient overload
because of the SC on the bus may therefore not be limited to the transition
busy window but be recurrent. We call this recurrent effect the echo effect.
As a consequence of the echo effect, for the worst-case response time calcu-
lation across the SC of the low-priority unchanged communication task C5,
it is not sufficient to consider only its activations within the transition busy
window. Rather, the activations within the successive busy windows need to
be considered.
3.5.2 Compositional Scenario-Aware Analysis
The previous example illustrates how difficult it is to predict the effect of
the recurrent transient overload after an SC in a distributed system. As a
consequence of this unpredictability, it turns to be very difficult to describe
the event timings at task outputs and therefore to describe the event tim-
ings at the inputs of the connected tasks, needed for the response time cal-
culation across the SC. To overcome this problem, we need to describe the
event timing at each task output, in a way that covers all its possible tim-
ing behaviors, even those resulting from the echo effect that might occur
afteranSC.
This calculation is performed by extending the compositional methodol-
ogy presented in Section 3.2 as follows. As usual, all external event models at
the system inputs are propagated along the system paths until an initial acti-
vating event model is available at each task input. Then, global system anal-
ysis is performed in the following way. In the first phase, two task response
time calculations are performed on each resource. First, for each task we cal-
culate its worst-case response time during the transition busy window. This
calculation is described in detail in [13]. Additionally, for each unchanged or
added task, using the classical analysis techniques we calculate its worst-case
response times assuming the exclusive execution of the new scenario. Then,
for each task, a response time interval is built into which all its observable
response times may fall (i.e., the maximum of its response time during the
transition busy window and its response time assuming the exclusive exe-
cution of the new scenario). The tasks’ best-case response times are given by
their minimum execution times in all scenarios.