Springer Old Growth Forests - Chapter 15 pot
Bạn đang xem bản rút gọn của tài liệu. Xem và tải ngay bản đầy đủ của tài liệu tại đây (1.35 MB, 24 trang )
Chapter 15
Temperate and Boreal Old-Growth Forests:
How do Their Growth Dynamics and
Biodiversity Differ from Young Stands
and Managed Forests?
Ernst-Detlef Schulze, Dominik Hessenmoeller, Alexander Knohl,
Sebastiaan Luyssaert, Annett Boerner, and John Grace
15.1 Introduction
Countries in the northern hemisphere are responsible for the emission of most of the
6.5 Gt carbon (C) produced from fossil fuels annually by humankind. However, it
has also been estimated that from 1980 onwards, terrestrial ecosystems have been
providing an effective sink for much of this carbon (Schimel et al. 2001; IPCC
2001, 2007). It has been proposed that the net carbon uptake of Europe, North
America and Siberia has been as much as 4 Gt C year
À1
in recent years, with a
0.4 Gt C year
À1
sink-strength over Europe and a 1.3 Gt C year
À1
sink-strength over
Siberia (Schimel et al. 2001). Between 1980 and 2000 these regions jointly
appeared to balance almost 90% of the fossil fuel emissions (1.9 Gt C year
À1
)of
the EU-15 and Russia.
Russian forests, due to their vast extent, appear to play a key role in the global
carbon cycle, even though a major part of such forest is unmanaged primary or
‘‘old-growth’’ forest (Shvidenko and Nielsson 1994; TBFRA 2005). Thus, unman-
aged forests may be an important component of the northern hemisphere terrestrial
carbon sink (Luyssaert et al. 2008). However, the national reporting and accounting
of carbon stocks that is submitted to the climate secretariat of the UNFCCC (United
Nations Framework Convention on Climate Change), is based on UNFCCC (1992;
Art. 2), which states that only anthropogenic interferences with the climate system
shall be stabilised. From this it follows that unmanaged systems are not considered
under the UNFCCC reporting system (Luyssaert et al. 2008; and see Chap. 20
by Freibauer, this volume), even though they provide an important service to
mankind. Moreover, despite being carbon sinks, and thus contributing to stabilising
atmospheric CO
2
concentrations, they do not qualify for carbon credits under
current international legislation. One biological reason for excluding old-growth
forests from reported carbon budgets has been the scientific paradigm that, in old
forests, carbon uptake is balanced by respiration (Odum 1969). This view is
C. Wirth et al. (eds.), Old‐Growth Forests, Ecological Studies 207, 343
DOI: 10.1007/978‐3‐540‐92706‐8 15,
#
Springer‐Verlag Berlin Heidelberg 2009
supported but not proven by a stand-level decline in net primary productivity
(NPP) in even-aged mono-specific plantations (Binkley et al. 2002). It appears
that these findings have been uncritically transferred to uneven-aged mixed old-
growth forests, implying that old-growth forests are redundant in the global carbon
cycle. Although this view has been challenged (Carey et al. 2001; Chap. 4 by
Kutsch et al. this volume), this assumpt ion highlights the notorious lack of obser-
vational or experimental evidence for Odum’s equilibrium hypothesis, which can
possibly be ascribed to the limited knowledge of unmanaged forests compared to
managed systems.
Contrary to Odum’s hypothesis, recent data show that untouched, primary and
old-growth forest can be an important carbon sink (Luyssaert et al. 2008). At the
same time, these forests represent a significant economic resource, yielding a multi-
plicity of products including environmental services. These services are endangered
by intensified development and harvest (IPCC 2001), which often lead to complete
or partial destruction of the current carbon stock and sink strength, turning these
forests into substantial carbon sourc es. This has been clearly demonstrated using
the deforestation of North America and the Amazon as examples (Houghton et al.
1999, 2000). The degradation of primary forest is now recognised as a significant
component in the global carbon cycle, worthy of an international effort to reduce
emissions from deforestation and degradation (Decision-/CP.13 2007).
In this chapter, the definition of the Food and Agriculture Organisation of the
United Nations (FAO; TBFRA 2005) will be used to describ e primary forest, which
is ‘‘a forest of native species, where there are no clearly visible indications of human
activities and ecological processes are not significantly disturbed’’. This definition
includes all successional stages after disturbance (Korpel 1995), as well as ‘‘old-
growth’’ forests at the more advanced stages. Thus, the term ‘‘primary forest’’ also
includes naturally regenerating stands after large-scale wind-throw, insect out-
breaks, fire, or avalanches as long as there was no human interference, e.g. wood
extraction. Because the data sources we use in this chapter do not allow us to judge
the degree of ‘‘old-growthness’’ , in either the successional or structural sense (see
Chap. 2 by Wirth et al., this volume), we refer mostly to ‘‘primary forest’’. When we
use the term ‘‘old-growth’’, we refer to stands that approach a maximum biomass at
high age. This usage of the term is based on plot-scale observations, which may
differ according to regional and landscape perspectives. We deliberately avoid the
terminology used throughout forestry industry of young, mature and over-mature
forests. This is not suitable in our context because ‘‘maturity’’ in this narrow sense
refers to the maximum economic value of the harvested wood from the forestry
viewpoint. Over-mature forest has lost its timber value, but this could be at a very
early age, depending on the product to be sold, and the same stand could become
very ‘‘valuable’’ in terms of its biodiversity and its role in the global carbon cycle.
In the following, we discuss to what extent unmanaged primary forests differ
from managed forests in terms of C-sequestration and biodiversity, and to what
extent they may also be similar.
344 E. D. Schulze et al.
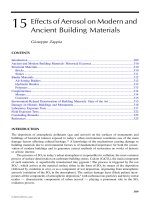
15.2 Global Distribution of Temperate and Boreal Forests
Temperate forests (Fig. 15.1) occur between 40
and 60
latitude in both the
northern and southern hemisphere. Temperate climate is characterised by a strong
seasonality (Chapin et al. 2002; Sitte et al. 2005) with mean summer temperatures
in the range of 18 20
C and mean winter temperatures around 3 5
C. Forests occur
when annual precipitation is sufficient to support tree growth, which is usually
above 600 mm. This definition of temperate forests includes the coastal coniferous
forests of the Pacific Northwest. Towards the tropics of Ca ncer and Capricorn there
is a transition from temperate to Mediterranean and subtropical evergreen forests.
Towards the northern polar circle, temperate forests turn into boreal forests, largely
dominated by coniferous species extending beyond about 50
up to 71
N(Hatangar,
Russia). In boreal forests, the winter is dominated by polar and the summer by
temperate air masses, producing very cold winters (<À60
C temperature minima)
and warm summers (>30
C temperature maxima). The temperature regime and the
high latitude result in a short growing season of about 3 months with over 20 h of
daylight per day. Precipitation range s between 300 and more than 1,000 mm,
depending on the distance to the nearest ocean.
The FAO assessment of temperate and boreal forest resources (TBFRA 2005)
distinguishes betwee n primary forest and various types of forest that are modified
by man. The global forest area is estimated at 3.9 Â 10
9
ha, of which one-third
(1.3 Â 10
9
ha) is still considered primary forest. About 45% of this primary forest is
located in the northern hemisphere (0.57 Â 10
9
ha), of which more than 90% is
Fig. 15.1 Global distribution of temperate and boreal forests (after Sitte et al. 2005)
15 Temperate and Boreal Old Growth Forests 345
boreal forest in Russia, the United States and Canada. It is important to recognise
that the primary forests of the northern hemisphere account for about 15% of the
global forest area. The TBFRA report does not distinguish between boreal and
temperate forest, therefore both regions are discussed jointly in the following.
15.3 Productivity of Temperate and Boreal Forests
Our analysis is based on a database of eddy-flux sites (Luyssaert et al. 2007)
including managed and unmanaged stands. Additionally, old-growth forest sites
in Europe and in North America were included (Korpel 1995; Van Tuyl et al. 2005).
‘‘Stand age’’ refers to the age of emergent trees of the main canopy, which is
different from an average stand age (see Chap. 14 by Lichstein et al., this volume).
The database includes a total of 513 forest sites where flux towers have been
established. Selecting both boreal and temperate sites (Table 15.1), there are 152
sites where net ecosystem productivity has been measured. An additional 67 old-
growth sites were taken from the literature, when biomass, NPP and stand density
had been published. Not all sites reported this information in full. Thus, the number
of sites varies for different aspects of this study.
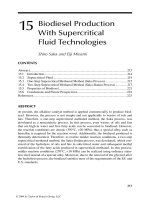
We found that biomass accumulates with age, and that accumulation continues
even in stands with 800-year-old canopy trees (Fig. 15.2a; see also Luyssaert et al.
2008). This pattern of biomass accumulation holds for broadleaf and coniferous
stands as well as for temperate and boreal forests. The response was irrespective of
management. The variation in biomass accumulation for a given age is large,
especially in the temperate zone, where some forest species have much higher
growth rates than others (e.g. Populus vs Quercus,orPseudotsuga vs Thuja). Also
large variations exist within a species according to site quality (yield class). In
contrast to managed forests, most natural forests are uneven aged. Thus, an 800-
year-old canopy may contain a second or third canopy layer of younger trees, but
Table 15.1 Number of sites for which data were available to analyse the relationships of age and
density to biomass, net primary productivity (NPP) and net ecosystem productivity (NEP)
Age Density
Biomass NPP NEP Biomass NPP NEP
Boreal 72 83 27 65 45 22
Temperate 147 120 102 108 105 73
Deciduous 84 64 40 50 46 21
Mixed 5 11 6 5 1 4
Evergreen 135 129 91 123 104 75
Managed 94 58 63 60 44 37
Unmanaged 30 36 19 20 15 12
No information 92 80 62 90 83 39
Recently disturbed 3 23 8 3 1 7
346 E. D. Schulze et al.
Fig. 15.2 a Total biomass accumulation and b stand density in temperate and boreal forests as
related to the age of the emergent trees of the main canopy. The data show that low stand density is
not restricted to old growth forests, but can be found in all age classes. The horizontal line in b
indicates the cut off point in the self thinning line where the crowns of the remaining canopy no
15 Temperate and Boreal Old Growth Forests 347
the processes at the stand level are still dominated by the old canopy. Carbon
accumulationinabovegroundbiomassbetweenage100and300yearsisabout
0.3 t C ha
À1
year
À1
. Based on the areal extent of primary forest in the northern
hemisphere, these unmanaged forests may accumulate about 0.4 Gt C year
À1
in
their aboveground woody biomass (not even accounting for changes in soil carbon).
Thus, they represent a major fraction of the total northern hemisphere sink.
When relating biomass to density, it emerges that all stands follow a process of
density-driven mortality, which is described by the thinning rule (Yoda et al. 1963).
Some trees continue to dominate and get bigger at the expense of subdominant
trees, which die. The slope of the biomass-density relationship as observed in this
study is close to the theoretical self-thinning line of 0.5 that was developed for
monocultures (Fig. 15.2c). Biomasses below this self-thinning line represent forests
where the canopy is not fully closed due to management, stand disturbances, or
stands of multiple canopy layers (Schulze et al. 2005a, p 405).
With increasing age, stand density decreases exponentially (Fig. 15.2b). If
calamities occur, old forests may reach densities where the projected crown area
of canopy trees no longer covers the ground area, and biomass falls below the self-
thinning line (vertical line in Fig. 15.2c; horizontal line in Fig. 15.2b). With
sufficient regeneration in the understorey, these stands will recover and reac h the
self-thinning line again at higher stand density. Thus, the variation in density is
huge, depending on species, site conditions and canopy structure. However, there is
no significant difference between boreal and temper ate, or between broadleaf and
coniferous forest.
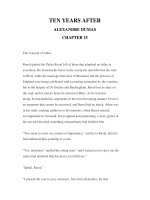
The interpretation ofthe biomass-age relationship of Fig. 15.2a is complex. Based
on the same dataset we investigated some of the component processes (Fig. 15.3). It
emerges that biomass per living tree increases almost linearly over time, as is
known from growth curves of large individual plants (Hunt 1982). The net growth
rate per tree was constant up to an age of 850 years (0.5 kg C tree
À1
year
À1
).
However, at the stand level, a large number of trees died in thickets of regeneration.
This mortality results in removal of living into dead biomass at a constant rate of
0.3 kg C tree
À1
year
À1
. Thus, total tree biomass growth was 0.8 kg C tree
À1
year
À1
up to age 800 years. Mortality accounts for 37% of total productivity. The
growth rate per total biomass decreased from 0.2 t C t C
À1
year
À1
at age 1 year
to 0.001 t C t C
À1
year
À1
at age 850 years due to increasing biomass. The growth
analysis shows that growth of the remaining trees accumulates 63% of total
productivity. The effect of mortality of individual trees may be different for broad-
leaves and conifers. Broadleaved trees are better able to extend branches laterally
Fig. 15.2 (continued) longer cover the ground area. c Self thinning shown as the relationship
between the logarithm of aboveground biomass and the logarithm of stand density (redrawn from
Luyssaert et al. 2008). The vertical line was placed visually to indicate the cut off at which the
number of individuals becomes too small to cover the area. The regression line indicates the self
thinning line according to Yoda et al. (1963). In all panels circles denote broadleaf and mixed
forest, while triangles denote coniferous forests
348 E. D. Schulze et al.
and close gaps, while the lateral growth of branches in conifers is limited and gaps
may remain open. This is shown in Fig. 15.2c as the critical stand density at which
the biomass accumulation becomes saturated probably in the range of 200 300
trees/ha for broadleaved trees (crown diameter of 6 8 m), and 500 1,000 tree/ha for
conifers (crown diameter 3 6 m). The inventory-based data of Lichstein et al.
(Chap. 14, this volume) demonstrate such an asymptote in biomass with increasing
age, especially in stands with multiple canopy layers. It should be emphasised that
the decline in biomass at low densities is neither age-dependent nor density-
dependent but rather the result of calamities that cause size-independent mortality.
In unmanaged forests, a decrease in stand density, or gaps due to the loss of a
major canopy tree, results in a new generation of trees, which sustains stand density.
The process of re-gener ation may be closely linked to stand density to the extent
that stand biomass may continue to increase even during replacement of the main
canopy, as shown for fire successions of Larix and evergreen conifers in Siberia
(Schulze et al. 2009; see also Fig. 15.8). At this point it becomes important that
we selected sites where flux measurements were available. Reichstein et al.
(2007) showed that ecosystem respiration is linked closely to stand photosynthesis
(Reichstein et al. 2007), and Luyssaert et al. (2008) demonstrated that the ratio of
heterotrophic respirationR
h
and NPP was constant with age, reaching a value of 0.6
to 0.7. Thus, ecosystem respiration is driven by assimilation. This was confirmed
experimentally by large-scale girdli ng experiments (Hoegberg et al. 2001), where
ecosystem respiration dropped to 30% of the initial value. Knohl et al. (Chap. 8,
this volume) also confirm that NPP and net ecosystem productivity do not decrease
significantly with age. The ecosystem carbon-balance cannot reach zero or be
Fig. 15.3 Tree biomass and growth, tree mortality, and relative growth rates as related to stand
age. The curves were calculated from the biomass and density relations shown in Fig. 15.2
15 Temperate and Boreal Old Growth Forests 349
b
Fig. 15.4 a Schematic presentation of gross primary productivity, ecosystem respiration, net
primary productivity and stand biomass as a function of forest age according to Kira and Shidei
(1967) and Odum (1969, redrawn from Carey et al. 2001). b Proposed age dependency of gross
primary production, ecosystem respiration, net primary productivity, total biomass and the risk for
damage
350 E. D. Schulze et al.
negative, except for transitional periods of times mainly after catastrophic events.
The accumulation of carbon in soils, coarse woody detritus and charcoal since
glaciation of the boreal forest in Siberia is a visible sign that an equilibrium
between assimilation and respiration has not been reached also at larger scale
(Ciais et al. 2005).
The age-independent ratio of R
h
/NPP as shown by Luyssaert et al. (2008) is the
most convincing demonstration that the Odum-paradigm of a zero carbon balance
in old-growth forests must be rejected. Figure 15.4 depicts the main idea of Odum
(1969), namely that gross primary productivity reaches a maximum at a young age
and levels off with further growth, while ecosystem respiration continues to in-
crease due to the increased biomass. At high age, ecosystem respiration approaches
gross primary production, and it is at this point that Odum (1969) assumed that the
carbon balance of the system approaches zero. At late age, total biomass remains
constant, i.e. growth balances the production of litter. At present knowledge, gross
primary production is constant over time, dependent only on available radiation and
leaf angle (Schulze et al. 2005a). Since respiration depends on available carbohy-
drates and not on biomass (which in trees is mainly dead wood), the carbon balance
remains positi ve and constant. Stand biom ass continues to increase with age.
However, there is an additional process, namely the risk of damage, which
increases exponen tially with biomass. This leads to catastrophes (windbreak,
fire), which can be partially or totally stand replacing. However, ecosystem respi-
ration will also decrease, unless accumulated resources are open to decay (e.g.
woody detritus after windbreak). Otherwise the system will continue to grow and
recover. After all, in contrast to the organisation in animals, trees are open systems,
which enables them to restore growth even after severe damage.
The self-thinning rule suggests that mortality is a function of the growth rate. In
fast-growing species (e.g. Douglas fir), the critical stand density of canopy opening
is reached faster (and at an earlier age) than in slow-growing species (e.g. red
cedar). Thus, only inherently slow-growing species, or sites supporting only low
yield classes, will reach a high biomass, and the status of ‘‘old-growth’’ forest, at a
later age (Schulze et al. 2009).
Based on Fig. 15.3, forest density and growth rates appear to be more important
than age in explaining stand biomass. Forest stands may accumulate biomass for
centuries, and in this process they will lose individual trees by self-thinning
mortality or disturbances (windbreak, fungal disease, or lightning) or by manage-
ment. The net effect can be an accumulation of biomass until a critical threshold of
biomass or density is reached. Is there a maximum biomass or carbon density? It
seems that forests can accumulate biomass to levels of up to 800 t C ha
À1
, which is
about 3,200 m
3
wood ha
À1
, depending on the species. In Fig. 15.3, stands reaching
this biomass were Pseudotsuga stands at an age below 200 years and Thuja stands
at an age beyond 600 years. Obviously, at som e point in time, depending on species,
the system appears to become mechanically unstable (Quine and Gardiner 2006),
and individual components of the forest, or even the entire forest, may collapse due
to external forces, mainly wind (Fig. 15.2c, vertical line), which initiates a new
succession. The eff ect of wind increases with exposed crown area, and with the
15 Temperate and Boreal Old Growth Forests 351
Stem volume (m
3
ha
-1
)
Regeneration (%)
Hainich National Park, 2000-2007
0 1020304050607080
200
400
600
800
1000
1200
Basal area in year 2000 (m
2
ha
-1
)
0 1020304050607080
0
20
40
60
80
100
120
y = 4.64 + 0.21x
r
2
= 0.03, p = 0.04
c
b
a
0 1020304050607080
Yearly change in stem volume
(m
3
ha
-1
yr
-1
)
−20
−10
0
10
20
30
40
I
II
III
VI
yield table class
x (volume) = 758 ± 125 m
3
ha
1
2000
2007 with loss of trees
2007 without loss of trees
average in 2000
x (basal area) = 55.4 ± 7.3 m
2
ha
1
x (volume) = 392 ± 72 m
3
ha
1
x (basal area) = 26.8 ± 4.6 m
2
ha
1
x (ΔVolume) = 12.7 ± 6.3 m
3
ha
1
yr
1
x (basal area) = 26.6 ± 4.3 m
2
ha
1
x (ΔVolume) = 9.8 ± 8.2 m
3
ha
1
yr
1
x (basal area) = 55.6 ± 7.4 m
2
ha
1
Fig. 15.5 a Stem volume as related to basal area on several plots of a repeated inventory of the
Hainich National Park, Germany. The inventories were made in the years 2000 and 2007.
b Annual change in stem volume between 2000 and 2007 as related to basal area in 2000. Negative
352 E. D. Schulze et al.
distance between trees, i.e. with decreasing stand density (Quine and Gardiner
2007). In addition, old trees become increasingly affected by fungal heart-woo d
rot (Schulze et al. 2009), which in turn decreases their stability and their strength to
withstand strong wind. Consequently, the decline in stand density is related not to
age, but results from species-specific structural attributes, disease, or management.
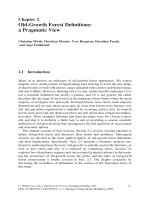
An inventory study of the Hainich National Park (NP) in Germany is given as an
example of the biomass dynamics in an old-growth beech forest (Fagus sylvatica ).
Stand volume and basal area are linearly related, which implies that stand height is
almost constant (Fig. 15.5; Hessenmoeller et al. 2009). Within the time of two
consecutive surveys, stand volume and basal area increased at all inventory spots,
except at those where a tree had collapsed. This happened on 3 out of 63 plots (5%
of plots) within 7 years. Plots where such loss occurred had reached neither the
highest stand volume nor the largest basal area. Although plot biomass decreased in
these cases, it never became zero, and we can assume that these plots will again
accumulate biomass in the future. Plot history of growth and losses revealed that the
variation of biomass increased with basal area. The net growth rate of woody
biomass in the old-growth stand was the same as the growth rates of 150-year-old
beech trees according to the yield tables (Fig. 15.5b, curved lines). However, the
total stand volume of the old growth stand was higher by a factor of 2 than that
presented in the relevant yield tables. On average, the net increment in woody
biomass (which is woody NPP minus biomass losses) was 9.3 Æ0.6 m
3
ha
À1
year
À1
.
In the case of Hainich NP, when a single tree collapsed or was felled by wind, the
neighbouring canopies remained undamaged. Uprooting and wind throw of indi-
vidual trees resulted in relatively small gaps that were soon colonised by new
regeneration. The instability of the stand, and the magnitude of fungal attacks,
increased with basal area (S. Kahl, personal communication). Regeneration was
high even in stands with high age and high basal area (Fig. 15.5c). The whole
process of regeneration initiated by the collapse of individual trees resembles the
earlier hypothesis of Watt (1947) that, in terms of their spatial extent, the succes-
sional stages in a plant community resemble at any given time a dynamic mosaic of
patches.
Large-scale disturbances and stand destruction can occur at any time and at any
place. A stand needs to be shielded for centuries from these events in order to turn
into an old-growth stand. Since biomass accumulation and collapse are highly
asymmetric with respect to the time it takes for destruction and recovery, and
even though extreme climatic events are stoc hastic, the probability that a distur-
bance is caused is higher in stands with high aboveground biomass. As a conse-
quence, old stands are rarer than young stands, even in an unmanaged landscape (see
Fig. 15.5 (continued) numbers indicate the loss of a major canopy tree. The small parabolic curves
show the yearly increment in stem volume of different yield classes according to yield tables. It is
interesting to note that yield tables cover only the lower end of basal areas that are found in the
unmanaged forest, and that unmanaged forest stands reach higher annual wood increment rates
than predicted by yield tables. c Regeneration in 2007 as related to basal area (after Hessenmoeller
et al. 2009)
15 Temperate and Boreal Old Growth Forests 353
below; Mollicone et al. 2002; Chap. 2 by Wirth et al., this volume). At the
landscape level, there is a mosaic of forests characterised by different times having
elapsed since the last stand-replacing disturbance. Nevertheless, these differently
aged forests follow the same relationship trend between biomass and age
(Fig. 15.2a).
We may conclude that old-growth forests do not differ from younger stands with
respect to their productivity at similar yield class and, on average, they maintain the
capacity for carbon sequestration due to gap regeneration. The processes that
determine stand biomass in managed and unmanaged forests are summarised in
Fig. 15.6. Following disturbance, managed and unmanaged forests develop very
similarly. In managed forests, thinning by forestry reduces stand density, but gaps
are kept small to avoid regeneration. The managed forest reaches ‘‘maturity’’
whenever a commercial yield of timber is reached. Maturity could be reached at
age 30 years for firewood and at age 100 for saw-wood timber. Thereafter, depend-
ing on species, the stand is harvested, or regenerated below an increasingly open
canopy. A permanent canopy cover is also possible in forests that are managed by
selective cutting. In unmanaged forests, self-thinning reduces stand density initially
but, with increasing dimensions of trees, gaps may become large enough to initiate
Fig. 15.6 Conceptual scheme of processes that affect biomass and turnover in managed and
unmanaged forests
354 E. D. Schulze et al.
regeneration. The stand reaches an ‘‘old-growth’’ stage when the maximum biomass
of the canopy is reached. At that stage, there is increased risk that single canopy
trees collapse due to increasing attack of heartwood by fungi, and due to increased
load for wind. Single-tree-collapse results in gaps that are closed by regeneration.
However, increasing calamities may also open the canopy and induce further risk of
mortality by wind or by fire, which may lead to total canopy loss also in primary
forests. This results in new forest establishment as in managed forests. Thus,
managed and unmanaged forests have similarities in their dynamics. The main
difference is the total time required for turnover, and the end-product. Managed
forests produce commercial wood for products, while unmanaged forests contribute
coarse woody detritus to the carbon pool in soils.
15.4 Disturbance and Forest Succession at the Regional Scale
According to Scherzinger (1996), the successional cycle distinguishes between
early and successional stages, which contain an optimal phase and a senescent
phase, and which then returns to the successional stage. However, this idealised
cycle may not exist in nature. Various kinds of disturbances appear to drive forest
succession at different spatial scales. Disturbance can be an immediate destructive
process at any one of these stages (Fig. 15.7). In fact, regeneration and senescence
may become a continuous parallel process that may result in old-growth forests of
heterogeneous spatial structure. Disturbances may be natu ral or anthropogenic, and
Fig. 15.7 Stages of natural forest succession in primary forests without and with disturbances
(after Scherzinger 1996)
15 Temperate and Boreal Old Growth Forests 355
Fig. 15.8 Succession in a Picea- and Abies -dominated dark Taiga of central Siberia (Schulze et al. 2005b)
356 E. D. Schulze et al.
some natural disturbances, especially fires and insect outbreaks, have been shown to
have an anthropogenic background (e.g. Mollicone et al. 2006).
In contrast to the disturbance cycle in temperate forests, which is dominated by
fungal attack and wind (see Hainich NP case study above), the boreal primary forest
is characterised by a stand-replacing fire, which may result in regeneration of
deciduous forest as shown for the example of the Siber ian dark taiga (Fig. 15.8).
The dark taiga differs from the ‘‘light’’ taiga, which is dominated by pine or larch,
mainly with respect to re-occurring ground fires which do not exist in the dark taiga
where deep branching crowns always lead to stand-replacing crown fires (Chap. 2 by
Wirth et al., this volume). In the dark taiga, fire succession starts with birch and
poplar forest, which collapse without regeneration because these species require
mineral soil and high light for germination. Conifers, which germinate on organic
soils and in the shade of the deciduous early fire succession, take eventually over in
the canopy (Schulze et al. 2005b). The conifers then form multi-aged and multi-
species stands that are disturbed mainly by wind and by insect attacks on both
a single tree basis and at the scale of whole stands or even at a regional level. When
the forest is disturbed by wind or insects it does not return to the fire successional
phase with deciduous species but regenerates with conifers. The life cycle of the
Fig. 15.9 Number of trees belonging to different breast height diameter classes in forests of
different management. The unmanaged forest and the selection system contain all diameter classes
within the same stand at almost equal numbers. In contrast, the shelterwood system exhibits
cohorts of diameter classes in individual stands. Thus, each age class has a specific diameter
distribution, and a strong decrease in overall stand density. Unmanaged Hainich National Park,
Germany; selection cutting Langula district in the Hainich area; clear cut Leinefelde age class
management
15 Temperate and Boreal Old Growth Forests 357
different coniferous species determines the species composition. If fire is absen t for
a long time, old-growth boreal forests may develop. Thus, primary boreal forests
can idle between old stands and coniferous succession after insect attack or wind-
throw for centuries until a fire again starts a fire succession. The fire return time can
be estimated based on the extent of deciduous stands in the region (Mollicone et al.
2002). Fires may be initiated by lightening in the absence of humans. For central
Siberia, this mean fire cycle was estimated to be 425 years (Schulze et al. 2005b).
The fire successional stages cover about 67% of the landscape, 33% is covered by
insect-windthrow succession. Thus, old-growth forest (>200 years) would cover
only about 0.1% of the area (see also Chap. 13 by Bergeron et al., this volume).
However, since fire frequency has increased due to human impact (Mollicone et al.
2006), the area of old-growth forest is likely to have decreased.
15.5 Effects of Management
Management interferes with natural succession through the extraction of wood on
an individual tree basis (selective harvest) or on a stand basis (thinning and clear-
cut). We did not observe differences in the diameter distribution (Fig. 15.9)
between the unmanaged old-growth forest in Hainich NP and nearby managed
forests under a selective harvesting regime (Mund and Schulze 2006). Under both
management systems, regeneration is a continuous process and requires only a
relatively small number of seedlings to maintain productivity. Cohorts of shade-
tolerant seedlings develop to a second or even third canopy below the main canopy,
which consists of a few large and old trees. Deciduous trees growing in the shade
generally loose their apic al dominance, and are barely able to grow into the main
canopy after gap formation. Regeneration of the main canopy generally originates
from seedlings (or coppices) that germinated after gap formation, and which exhibit
high apical growth. This is different in coniferous stands, where rege nerating trees
do not lose their apical dominance in the shade, and are ready to take advantage of
an opening in the canopy (Schulze et al. 2005a). In unmanaged forest, upon death,
old trees contribute to the coarse woody detritus pool. In contrast, under selective
harvesting, old trees are harvested and used economically (Wirth et al. 2004). The
aboveground biomass was 20% higher (497 Æ 16 m
3
ha
À1
) in the unmanaged
Hainich NP forest than in selectively harvested forest (409 Æ 21 m
3
ha
À1
)
(D. Hessenmoeller, personal communication; Erteld et al. 2005).
In contrast, in forests that are based on thinning and final clear-cuts, the density
of regeneration is much higher than under selective cutting. In beech forest, the
‘‘clear-cut’’ follows the principles of a shelter-wood, where the early stage of
regeneration takes place under the protection of the old stand at reduced stand
density. Clear-cut of the remaining canopy trees follows regeneration (Fig. 15.9). In
this management system regeneration leads to a surplus of individuals that are
extracted through thinning and used economically. Thinning aims at a stand density
below the self-thinning line (Kramer 1988, p 186). Thus, tree densities just before
358 E. D. Schulze et al.
the clear-cut are lower than those observed under selective cutting. The average
woody biomass over the whole rotation period (340 m
3
ha
À1
, highest yield class of
beech with a 150-year rotation period, Schober 1995) is about 30% lower than that
in unmanaged forest. Economically, the loss in biomass is outweighed by the
economic value of large amounts of wood of uniform quality.
The interaction between natural disturbance and management can result in a
wide variety of successional stages and land uses. To illustrate these complex
interactions, the example of Alpine larch forests is shown in Fig. 15.10. European
larch (Larix decidua) is an early successional species, which can regenerate only on
mineral soil and under high light (Schulze et al. 2007). Old Larix forest form
pastoral wood lands with single large trees on meadow-like grazing land. These
forests do not regenerate unless overgrazing results in the exposure of mineral soil
Forest pasture
few Larix trees,
grass cover
Degradation by
overstocking
Land
slides
Mechanical
disturbances
Extraction of
fence poles
Saw wood
Extraction
Saw
wood
Litter raking
Selection forest
Mixed tall
forest
Forest grazing
Saw wood
extraction
Tall forest
of Larix
Pole stand of Larix
Decreased stand density
Afforestation Deforestation
Abandonment
Successional forest
Hay meadow
Picea abies
Picea abies
No forest
grazing
Picea abies
Pinus cembra
Pinus cembr
a
1
2
4
5
6
7
8
9
20
21
22
3a
10
11
3b
4a
3c
200-400 years
100-150
years
150-200
years
Tree age (yrs)
0 50 100 150 200 250 300 350
Diameter (cm)
0
20
40
60
80
100
120
140
160
Stem base
Breast height
a
b
Fig. 15.10 a Succession and land use of Larixforests. The numbers refer to specific properties in
the study region where these stages can be observed. b Diameter of trees as related to tree age
during the course of a successional cycle (after Schulze et al. 2007)
15 Temperate and Boreal Old Growth Forests 359
or causes land-slides enabling larch to regenerate. This successional larch forest
type is then followed by successional species such as Norway spruce (Picea abies)
and Swiss Stone pine (Pinus cembra). At the pole stage (Fig. 15.10a), individual
pine and spruce will be thinned for fence poles. After thinning, the stand grows into
a tall forest, where larch, spruce and pine continue to be selectively harvested for
saw timber. Without management, these forests would turn into spruce/pine forest;
however, selective harvest further reduces the number of evergreen trees, opens the
canopy and allows grasses to colonise the herb layer. In this phase, the forest becomes
attractive for grazing, which again increases the risk of overgrazing or land-slides,
which in turn could initiate a new successional cycle starting with Larix. The full
regeneration cycle has a length of 200 400 years. During this successional cycle,
individual Larix trees exhibit no sign of age-related decline, but rather show an
exponential growth rate (Fig. 5.10b) because they experience an increasing amount
of available light, and probably gain from manure input from grazing.
15.6 Forest Management and Forest Protection in Europe
In large parts of Europe, the forests are shaped by almost 1,000 years of interaction
between management and other anthropogenic distur bances (Fig. 15.11). In the
earliest phase of management, forest clearing was the main activity. This period
was followed by periods of erosion, grazing, and litter raking. Forest degradation
reached its height in the seventeenth century due to over-use for firewood and the
production of charcoal, and supplies for continui ng wars. The devastation of
European forests resulted in the establishment of legal frameworks for sustainable
Fig. 15.11 Anthropogenic effects on forest ecosystems over time in Europe (after WBGU 1997).
The y axis scales the relative effect of each type of disturbance during the time it was operating,
e.g. forest clearing terminated about in the year 1200. The change towards conifers started after
1700 and has probably reached its peak in present times
360 E. D. Schulze et al.
forest use, and the shift from broad-leaved forest into more productive conifers.
However, the fingerprint of earlier forest degradation is still recognisable in the
decreased amount of soil carbon and cationic nutrients such as potassium, calcium
and magnesium depending on the management history (Wirth et al. 2004). The
industrial revolution and the accompanying massive use of fossil fuels resulted in
acid deposition and further soil acidification. Wide-spread nitrogen deposition,
however, accelerated g rowth (Mund et al. 2002). All these changes affected forests
independent of age some of them also independent of management.
The main objectives of forestry are the supply timber and fibre for various uses
in society, although forests, by virtue of their existence, exhibit a multi-functionali-
ty ranging from recreation to water supply. The sustainability of forests is ensured
by various production systems, which can range from coppicing to selective
logging systems. In managed forests, the production system is protected against
Fig. 15.12 Plant biodiversity of forest systems as related to management intensity in central
Europe. Dark grey symbols Forest types under nature conservation: Wilderness areas regions
without management in historic times (only remnants exist, e.g. Rotwald in Austria); Natural
Parks presently under nature conservation but usually had been managed in historic times the
range in plant diversity depends on geological conditions; Forest reserves single stands of small
scale; Biosphere reserves larger entities but maintain some human management; Landscape
protection area full agriculture and forest management but restricted industrial development;
Conservation monuments single individuals in a region where land use intensity may be very
high (e.g. 1,000 year old lime tree in a village). Light grey symbols Different management systems
in forestry: Farmers’ forests small plots with the high tree diversity needed to operate a farm in
historic times. In former times each farm tool was made of a different wood. Trees, such as oak,
were in part planted; Selection forest a management system where individual tall trees are
harvested according to market value; Coppice forest provides mainly firewood in a 30 year
rotation period; coppice with standards contains an upper canopy of tall trees for construction
wood, mainly oak; Forest pasture open forest canopy with ground cover of grasses for grazing;
Production forest an age class forest. Each of the forest systems will have a range in its diversity
and in its land use intensity. However, at present no data exist to quantify this range
15 Temperate and Boreal Old Growth Forests 361
catastrophic events such as pathogen attack, fire and wind. In some cases, the
protection of forest productivity conflicts with the aims of environmental protec-
tion, which are to ensure the existence of certain plant and animal species, and the
occurrence of natural processes such as fungal attacks, fires and blow downs
(Scherzinger 1996). Thus, certain ecosystem types are protected by states to a
varying degree in order to maintain natural biogeochemical cycles and biodiversity.
Conservation in forests can range from the protection of individual trees as natural
monuments, via preservation of landscape arrangements up to small scale forest
reserves (>600 stands in Germany covering 1 100 ha in area), and National Parks.
Europe has over 60 National Parks, located mainly in Northern and Eastern Europe.
The average size is 204 km
2
, but none of these areas represent truly pristine primary
forests. The situation is similar in eastern North America (Chap. 14 by Lichstein
et al., this volume) where less than 1% of the pre-settlement forest is thought to
remain. In Europe, these forests are mostly on land that is difficult to manage.
However, this land has also been affected by people, mainly following times of war
and thr ough air pollution. Nowadays, most of these forests do not have large
carnivores, and therefore grazing by rei ndeer or deer (mostly roe and red deer)
determines succession.
Table 15.2 Species diversity in the Hainich National Park, Germany (National Park Administra
tion Hainich, 2007)
Species
group
Total species
number
Number on Red List
in Germany
% Red List
species total
Mammals 46 (14 bats) 20 43
Birds 179 (107 nesting) 54 30
Reptiles 5 3 60
Amphibia 12 8 66
Insects
Ephemeroptera, Odonta,
Plecoptera, Satatoria,
Heterotera
168 28 17
Coleoptera 1,903 (1,307 in
wood)
401 21
Hymenoptera, Formicidae,
Trichoptera
260 56 21
Lepidoptera 705 59 8
Diptera 657 19 3
Araneae 221 19 8
Diplopoda 24
Gastropoda 82
Total fauna 4,262
Cormophyta 802 47 (+31 lost species) 6
Bryophyta 220 14 6
Lichens 134 41 30
Fungi 1,548 203 13
Total flora + fungi 2,704
362 E. D. Schulze et al.
The biodiversity of protected areas is often impressive (Table 15.2). For exam-
ple, a total of 2,704 plant and fungal species and 4,262 vertebrates and invertebrates
have been identified in the Hainich NP (National Park Hainich 2006). However, the
comparison of managed and protected systems with respect to biodiversity is
difficult, because flora and fauna has not been studied with same intensity at
managed sites. The main difference between managed and unmanaged systems
would be the amount of coarse woody detritus, which hosts a number of specialised
fungi and insects. However, managed forests where the management follows a
sustainable-use certification also require a certain amount of standing dead biomass
and coarse woody detritus. In contrast to the species pool, which is depend ent on
dead wood, clear-cut forests contain stages in their development where the soil is
not covered by a canopy, and a diverse flora and fauna, which is not present under
the continuous cover of an unmanaged forest, may exist for a short time. In
addition, a comparison of species numbers is valid only when forest with different
management systems but similar soil and climatic conditions are compared. Total
plant species number increased with the mean of the N- and R-value (site quality
indicators according to Ellenberg 1993) of the plant community in beech forests
from about 10 plant species on acid soils up to about 100 plant species on calcare-
ous soils (Schulze et al. 1996). Because managed sites in Central Europe may
contain more variation in light conditions during succession than a closed canopy
old-growth forest [but cf. Chaps. 6 (Messier) and 8 (Harmon), this volume, for other
forest ecosystems], managed systems may even carry a higher species diversity
than unmanaged systems. For example, Ellenberg (1993) determined the number of
the most abundant plant species in primary forests of beech with 20 plant species,
forest pasture had 27 species, coppice forest (30 year rotation period) and
‘‘coppice forest with standards’’ had 29 species, and managed age class forest had
18 species. Figure 15.12 shows an ‘‘expert view’’ of the relationship between plant
biodiversity and land-use intensity for beech forests, and it is suggested that there
are managed systems that can be very diverse (but these may not be the most
productive or valuable in terms of timber), and that some of the conservation
systems are not very effective in term of species diversity. Consequently, mere
species richness seems not necessarily to be an attribute of ‘‘old-growth forest’’, and
the effects of management are also relat ed to the scale of the operation at the
landscape level.
15.7 Conclusions
Based on our dataset, forests may accumulate woody biomass at an almost constant
rate for centuries. There is little evidence in support of an age-related decline in
productivity. Instead, self thinning and management lead to a loss of individual
trees to an extent that the remaining trees are eventually no longer able to cover the
available ground surface, thus leading to a decline in productivity per unit area. This
threshold may be reached earlier in fast-growing than in slow-growing species. It
15 Temperate and Boreal Old Growth Forests 363
is enhanced by management because trees may lose their economic value with
increasing dimensions due to fungal heart-wood rot.
Old forests are similar with respect to carbon-accumulation than young forests at
the same yield class and of the same species. However, due to the accumulated mass
per area, and the increased spread of fungal heart-wood rot, old forests become
unstable and collapse due to external forces, mainly wind. Since accumulation and
collapse are highly asymmetric with respect to time, and old forests become more
vulnerable to stochastic events because of their size, it follows that old stands are
rarer than young stands. Also, unmanaged forests contain a mosaic of age structures
at the landscape level.
Forest structure and management rather than stand age determine NPP; therefore,
there is no clear distinction in productivity between primary and managed forest,
except that managed forests are generally harvested at an age below 100 years.
Although unmanaged forests sustain natural processes, biodiversity expressed
as species richness is not necessarily higher in unmanaged compared to managed
forests. This, however, may be a matter of scale.
References
Binkley D, Stape JL, Ryan MG, Barnard HR, Fownes J (2002) Age related decline in forest
ecosystem growth: an individual tree, stand structure hypothesis. Ecosystems 5:58 67
Carey EV, Sala A, Keane R, Callaway EM (2001) Are old forests underestimated as global carbon
sinks? Glob Change Biol 7:339 344
Chapin FS III, Matson PA, Mooney HA (2002) Principles of terrestrial ecosystem ecology.
Springer, New York
Ciais P, Janssens I, Shvidenko A, Wirth C, Malhi Y, Grace J, Schulze E D, Heimann M, Phillips O,
Dolman AJ (2005) The potential for rising CO
2
to account for the observed uptake of carbon by
tropical, temperate and boreal forest biomes. In: Griffith H, Jarvis P (eds) The carbon balance
of forest biomes. Taylor and Francis, Milton Park, UK, pp 109 150
Decision /CP.13 (2007) Reducing emissions from deforestation in developing countries:
approaches to stimulate action. FCCC/CP.13
Ellenberg H (1993) Vegetation Mitteleuropas mit den Alpen. Ulmer, Heidelberg
Erteld T, Gerold D, Mund M, Schulze E D, Weller E (2005) Vorrat, Zuwachs und Nutzung im
plenterwaldartigen Buchenwald. AFZ Der Wald 13:702 706
Hessenmoeller D, Schulze ED, Grossmann M (2009) Zustand und Entwicklungstendenzen im
Naturwald ‘‘Schoenstedter Holz’’ des Nationalparks Hainich. Allg Forstjagdz (in press)
Hoegberg P, Nordgren A, Buchmann N, Taylor AFS, Ekblad A, Hoegberg MN, Nyberg G, Otto
Lofvenius M, Read DJ (2001) Large scale forest girdling shows that current photosynthesis
drives soil respiration. Nature 411:789 792
Houghton RA, Hackler JL, Lawrence KT (1999) The US carbon budget; contributions from land
use change. Science 285:574 578
Houghton RA, Skole DL, Nohre CA, Hackler IL, Lawrence KT, Chomentowsski WH (2000)
Annual fluxes of carbon from deforestation and regrowth in the Brazilian Amazon. Nature
403:301 304
Hunt R (1982) Plant growth curves. The functional approach to growth analysis. Arnold, London
IPCC (2001) Climate Change 2001: the science of climate change, WG I. Cambridge University
Press, Cambridge
364 E. D. Schulze et al.
IPCC (2007) Climate change 2007: the physical science basis, WG I. Cambridge University Press,
Cambridge
Kira T, Shidei T (1967) Primary production and turnover of organic matter in different forest
ecosystems of the western Pacific. Jpn J Ecol 17:70 87
Korpel S (1995) Die Urwa
¨
lder der Westkarpaten. Fischer, Stuttgart
Kramer H (1988) Waldwachstumslehre. Parey, Hamburg
Luyssaert S, Inglima I, Jung M, Reichstein M, Papale D, Piao S, Schulze E D, Wingate L,
Matteucci G, Aubinet M, Beer C, Bernhofer C, Black KG, Bonal D, Chambers J, Ciais P,
Davis KJ, Delucia EH, Dolman AJ, Don A, Gielen B, Grace J, Granier A, Grelle A, Griffis T,
Gru
¨
nwald T, Guidolotti G, Hanson PJ, Harding R, Hollinger D, Kolari P, Kruijt B, Kutsch W,
Lagergren F, Laurila T, Law B, Le Maire G, Lindroth A, Magnani F, Marek M, Mateus J,
Migliavacca M, Misson L, Montagnani L, Moncrieff J, Moors E, Munger JW, Nikinmaa E,
Loustau D, Pita G, Rebmann C, Richardson AD, Roupsard O, Saigusa N, Sanz MJ, Seufert G,
Soerensen L, Tang J, Valentini R, Vesala T, Janssens IA (2007) Global patterns in forest CO
2
balance
an analysis based on a new global database. Glob Change Biol 13:1 29
Luyssaert S, Schulze E D, Boerner A, Knohl A, Hessenmoeller D, Law BE, Ciais P, Grace J
(2008) Old growth forests as global carbon sinks. Nature 455:213 215
Mollicone D, Achard F, Marchesini LB, Federici S, Wirth C, Leipold M, Rosellini S, Schulze E D,
Valentini R (2002) A remote sensing based approach to determine forest fire cycle: case study
of the Yenisei Ridge dark taiga. Tellus 54B:688 695
Mollicone D, Hugh DE, Archard F (2006) Human role in Russian wild fires. Nature 440:436 437
Mund M, Schulze E D (2006) Impacts of forest management on the carbon budget of European
beech (Fagus sylvatica) forests. Allg Forstjagdz 177:47 63
Mund M, Kummetz E, Hein M, Bauer GA, Schulze E D (2002) Growth and carbon stocks of a
spruce forest chronosequence in central Europe. For Ecol Manag 171:275 296
Nationalpark Hainich (2006) Artenbericht 2005: Tiere, Pflanzen und Pilze im Nationalpark
Hainich. Freistaat Thu
¨
ringen, Bad Langensalza
Odum EP (1969) The strategy of ecosystem development. Science 164:262 270
Quine CP, Gardiner BA (2006) Understanding how the interaction of wind and trees results in
windthrow, stem breakage, and canopy gap formation. In: Johnson EA, Miyaniski K (eds)
Plant disturbance ecology, the processes and the responses. Elsevier, Amsterdam
Reichstein M, Papale R, Valentini R, Aubinet M, Bernhifer C, Knohl A, Laurila T, Lindroth A, Moors
E, Pilgaard K, Seufert G (2007) Determinants of terrestrial ecosystem carbon balance inferred
from European eddy covariance flux sites. Geophys Res Lett 34:L01402, doi:01410.01029/
02006GL027880
Scherzinger W (1996) Naturschutz im Wald. Ulmer, Stuttgart
Schimel DS, House JI, Hibbard KA, Bousquet P, Ciais P, Peylin P, Braswell BH, Apps MJ, Baker
D, Bondeau A, Canadell J, Churkina G, Cramer W, Denning AS, Field CB, Friedlingstein P,
Goodale C, Heimann M, Houghton RA, Melillo JM, Moore B, Murdiyarso D, Noble I, Pacala
SW, Prentice IC, Raupach MR, Rayner PJ, Scholes RJ, Steffen WL, Wirth C (2001) Recent
patterns and mechanisms of carbon exchange by terrestrial ecosystems. Nature 414:169 172
Schober R (1995) Ertragstafeln wichtiger Baumarten, 4th edn. Sauerla
¨
nder, Frankfurt
Schulze ED, Bazzaz FA, Nadelhoffer KJ, Koike T, Takatsuki S (1996) Biodiversity and ecosystem
function of temperate deciduous broad leaved forest. SCOPE 55:71 98
Schulze ED, Beck E, Mu
¨
ller Hohenstein K (2005a) Plant ecology. Springer, Heidelberg, pp
403 406
Schulze E D, Wirth C, Mollicone D, Ziegler W (2005b) Succession after stand replacing dis
turbances by fire, wind throw, and insects in the dark Taiga of Central Siberia. Oecologia
146:77 88. doi:10.1007/s00442 005 0173 6
Schulze ED, Mischi G, Asche G, Boerner A (2007) Land use history and succession of Larix
decidua in the Southern Alps of Italy an essay based on a cultural history study of Roswitha
Asche. Flora 202:705 713
15 Temperate and Boreal Old Growth Forests 365
Schulze E D, Mollicone D, von Luepke N, Ziegler W, Achard F, Mund M (2009) The role of fire
for succession and carbon dynamics of central Siberian larch forest. Oecologia (in press)
Shvidenko A, Nielsson S (1994) What do we know about Siberian forests? Ambio 23:396 404
Sitte P, Weiler E, Bresinsky A, Kadereit J, Koerner Ch (2005) Lehrbuch der Botanik, 35th edn.
Spektrum, Heidelberg
TBFRA (2005) Forest resources of Europe, CIS, North America, Australia, Japan and New
Zealand. United Nations, p 244
UNFCCC (1992) United Nations Framework Convention on Climate Change. FCCC/INFOR
MAL/84, GE.05 62220 (E) 200705. Article 2. />conveng.pdf
Van Tuyl S, Law BE, Turner DP, Gitelman AI (2005) Variability in net primary production and
carbon storage in biomass across Oregon forests an assessment integrating data from forest
inventories, intensive sites, and remote sensing. For Ecol Manage 209:273 291
Watt AS (1947) Pattern and process in the plant community. J Ecol 35:1 22
WBGU (1997) World in transition: ways towards sustainable management of freshwater resources.
Annual Report 1997, Springer, Heidelberg
Wirth C, Schulze ED, Schwalbe G, Tomczyk S, Weber G, Weller E (2004) Dynamik der
Kohlenstoffvorra
¨
te in den Wa
¨
ldern Thu
¨
ringens. Mitteilungen der Thu
¨
ringer Landesanstalt
fu
¨
r Wald, Jagd und Fischerei 23/2004
Yoda K, Kira T, Ogawa H, Hozumi H (1963) Self thinning in overcrowded pure stands under
cultivated and natural conditions. Inst Polytech Osaka City Univ Ser D 14:107 129
366 E. D. Schulze et al.