ADOBE INDESIGN CS2 REVEALED- P22 pdf
Bạn đang xem bản rút gọn của tài liệu. Xem và tải ngay bản đầy đủ của tài liệu tại đây (1.36 MB, 15 trang )
Lesson 4 Apply Transparency to Placed Graphics INDESIGN 8-19
Figure 24 shows the Multiply blending
mode being applied to a placed graphic
with a white background.
Remember the two essential rules when
working with the Multiply blending
mode: when a black color is multiplied with
any other color, the result is black; when
white is multiplied with any color, white
always becomes transparent. Figure 25 is
an excellent example of these two rules.
The Screen blending mode works as the
inverse of the Multiply mode. With the
Screen mode, black areas become
transparent and white areas remain white.
Figure 26 shows an example.
FIGURE 23
Positioning text in front of a placed graphic
FIGURE 24
Removing a white background with the Multiply mode
FIGURE 25
Image 1 multiplied with Image 2 results in Image 3
FIGURE 26
Image 1 screened with Image 2 results in Image 3
White background
becomes transparent
INDESIGN 8-20 Working with Transparency
Placing Graphics into
Transparent Frames
When you place a graphic into a frame, the
graphic takes on any transparency effects
that were applied to the frame. Figure 27
shows a frame that is multiplied and has a
feathered edge. Figure 28 shows a graphic
placed into that frame.
Selecting Overlapping Frames
When you create even slightly complex lay-
outs, many objects on the page will over-
lap. When a layout contains many
overlapping objects, it can become chal-
lenging to select the backmost objects in
the stacking order. Rather than move the
topmost objects to access the objects
behind them, you can simply “click
through” the topmost objects to select the
objects behind them. Select any of the top
objects, press and hold [Ctrl] (Win) or
(Mac), then click the top object again. This
will select the object behind it in the stack-
ing order, as if you “clicked through” the
top object. Use this method to select any
object positioned behind any other objects.
FIGURE 27
Frame with transparency applied
FIGURE 28
Graphic placed into a transparent frame
Multiply blending mode
and feather applied
Multiply blending mode
and feather applied
Lesson 4 Apply Transparency to Placed Graphics INDESIGN 8-21
Apply transparency to placed
Photoshop graphics
1. Make the Pink Flowers layer visible, click the
Selection Tool (if necessary), then click
the flowers graphic.
TIP Be sure that you select the flowers
graphic and not the “take a wok on the wild
side” text.
2. Change the blending mode to Screen.
3. Change the blending mode to Overlay.
4. Change the blending mode to Color, deselect,
then compare your work to Figure 29.
5. Make the Whisk layer visible, then click the
whisk graphic.
6. Change the blending mode to Multiply.
As shown in Figure 30, the white back-
ground becomes transparent because white
always becomes transparent when multiplied.
7. With the whisk graphic still selected, click
the Opacity list arrow on the Transparency
palette, then drag the slider to 70%.
You applied various blending modes to placed
graphics in InDesign, then changed the opacity of
one of the graphics.
FIGURE 29
Viewing the placed graphic with the Color blending mode applied
FIGURE 30
Applying the Multiply blending mode to a placed graphic with a white background
Color blending
mode applied
White background
becomes
transparent
INDESIGN 8-22 Working with Transparency
Selecting overlapping
graphics
1. Verify that the Selection Tool is selected,
then click the handle of the red fork.
The fork is selected.
2. Press and hold [Ctrl] (Win) or (Mac),
then click the handle of the red fork in the
same place.
The blue object behind the fork is selected.
TIP Pressing and holding [Ctrl] (Win)
or (Mac) allows you to select objects
behind other overlapping objects.
3. Press and hold [Ctrl] (Win) or (Mac),
then click the fork in the same place.
The Pink Flowers graphic is selected.
4. Press and hold [Ctrl] (Win) or (Mac),
then click the fork in the same place.
The green background graphic is selected.
5. Click the Opacity list arrow in the Transparency
palette, then drag the slider to 80%.
By decreasing the opacity of the green
graphic, the 50% yellow fill applied to the
graphics frame behind it becomes more
visible.
6. Press and hold [Ctrl] (Win) or (Mac),
then click the fork in the same place.
The frame with the 50% yellow fill is
selected.
7. Click the Tint list arrow in the Swatches
palette, then drag the slider to 75% so that
your page resembles Figure 31.
You used a keyboard command to select objects
behind overlapping objects.
FIGURE 31
Viewing the tint change of the backmost graphic
Area appears
more yellow
Lesson 4 Apply Transparency to Placed Graphics INDESIGN 8-23
Placing graphics into
transparent frames
1. Make the Illustrator Graphics layer visible.
2. Verify that the Selection Tool is
selected, then select the blue circular object.
3. Place the graphic named Octopus.ai from the
location where your Data Files are stored,
then compare your work to Figure 32.
The placed graphic is multiplied at 60%
because that is the blending mode applied to
the blue object.
4. Click Object on the menu bar, point to
Fitting, then click Fit Content to Frame.
5. Select the orange circular object, place the
graphic named Lava Rocks.psd from the
location where your Data Files are stored,
click Object on the menu bar, point to
Fitting, then click Fit Content to Frame.
6. Deselect, then compare your work to
Figure 33.
Like the frame, the graphic is multiplied at
55% opacity. The graphic fades with the
frame’s feathered edge.
7. Select the blue circular object, then change
the blending mode to Screen.
You placed graphics into transparent frames, not-
ing that the graphics themselves took on the same
transparency as the frames.
FIGURE 32
Viewing the transparency of a placed graphic
FIGURE 33
Viewing a placed graphic in a frame with transparency and a feathered edge
Feathered
edge
Graphic is transparent
INDESIGN 8-24 Working with Transparency
Apply transparency to placed
Illustrator graphics
1. Select the Goblets.ai graphic to the right of the
leftmost Octopus graphic, then note its trans-
parency setting in the Transparency palette.
As shown in Figure 34, the graphic’s
blending mode is set to Normal even though
it appears to be multiplied. The Multiply
blending mode was applied to the graphic in
Illustrator.
TIP InDesign recognizes and preserves any
transparency that is applied and saved with
an Illustrator file.
2. In the Transparency palette, change the
blending mode to Multiply.
The graphic is darkened.
3. Select the black Illustrator graphic named
Octopus.ai, then change the blending mode
to Overlay.
(continued)
FIGURE 34
Viewing a placed graphic with transparency applied in its native application
Graphic is not
multiplied in InDesign
Graphic appears
to be multiplied
Lesson 4 Apply Transparency to Placed Graphics INDESIGN 8-25
4. Select the Chefs on Safari text, then change
its blending mode to Screen.
5. Deselect, then compare your work to
Figure 35.
6. Save your work, then close Transparency.
You modified the transparency on two placed
Illustrator graphics, one of which had trans-
parency applied to it in Illustrator.
FIGURE 35
Viewing the completed project
CHAPTER SUMMARY
CHAPTER SUMMARY
Chapter 8 further explores InDesign’s
features as a graphic design and art
creation tool. You began by working with
grayscale images, learning what they are
and how to colorize them in InDesign.
You then moved on to work with the
Transparency palette, learning how to
manipulate opacity and how to apply a
feathered edge to a graphic. You moved
on to study the powerful effects that can
be achieved when applying blending
modes to overlapping graphics.
What You Have Learned
• An understanding of a grayscale image
• How to colorize a grayscale image in
InDesign
• How to manipulate opacity
• How to apply a feathered edge
• How to use the Transparency palette
• An understanding of blending modes
• An understanding of the Multiply blending
mode
• How to apply transparency to placed
graphics
• How to select overlapping frames
Key Terms
Blending modes An InDesign feature
that allows you to create different trans-
parency and color effects where two or
more objects overlap.
Feather A term used to describe the
illusion of a soft edge applied to a graphic
or digital image.
Grayscale A term that refers to a digi-
tal image created with a total of 256 pos-
sible colors or a printed image printed
with a single ink (usually black).
Multiply A blending mode in which
the top image becomes transparent but
retains its colors.
Opacity A term derived from the word
opaque. An object that is opaque is nei-
ther transparent nor translucent—it can’t
be seen through.
Transparency The quality of a graphic
that makes it possible to see other graph-
ics that are placed behind it.
INDESIGN 8-26 Working with Transparency
9-1
WORKING WITH TABS
AND TABLES
9
chapter
1.
Work with tabs.
2.
Create and format a table.
3.
Format text in a table.
4.
Place graphics in a table.
InDesign offers many great options for
creating charts and tables. The Tabs
palette is an excellent resource with a
sophisticated interface. You use tabs to
position text at specific horizontal loca-
tions within a text frame, and you use the
Tabs palette to determine the placement of
those tabs.
In addition to tabs, an important compo-
nent to any layout application is the ability
to create tables. By setting up data in rows
and columns, tables are an efficient
method for communicating large amounts
of information. InDesign provides excel-
lent options for creating tables quickly and
easily—in fact, it provides both a Table
palette and an entire Table menu!
9-2
WORKING WITH TABS
AND TABLES
chapter
9
9-3
Tools You’ll Use
LESSON 1
What You’ll Do
INDESIGN 9-4 Working with Tabs and Tables
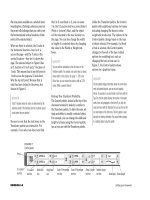
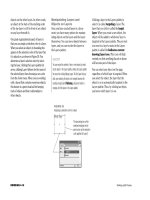
Using Tabs
You use tabs to position text at specific
horizontal locations within a text frame.
Figure 1 shows a simple layout created
using tabs. The heading “Column 2” and
the five items beneath it are all aligned
with the left-justified tab shown in the tab
ruler of the Tabs palette.
Note that the left edge of the white ruler in
the Tabs palette is aligned with the left edge
of the text frame. This alignment occurs by
default when you select a text frame and
open the Tabs palette. The alignment of the
text frame with the Tabs palette makes it eas-
ier to note the horizontal position of text
within a frame. For example, in the same fig-
ure, you can see at a glance that Column 2 is
positioned two inches in from the left edge
of the text frame.
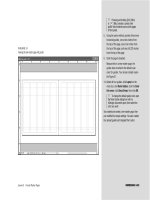
If you scroll up or down, or resize the page
or the text frame, the text frame will no
longer be aligned with the Tabs palette. To
realign the two, simply click the Position
Palette above Text Frame button on the
Tabs palette. The Tabs palette will move to
realign itself with the text frame.
Once text has been aligned on a tab, mov-
ing the tab moves the text as well. In
Figure 2, the tab has been moved right
to 2.5" and the left edge of the text is also
aligned at that position. The text does not
need to be selected to be moved. Simply
moving the tab moves the text.
To delete a tab from the tab ruler, simply
drag it off the tab ruler, and then release
the mouse button.
Using Different Tab
Alignments
The Tabs palette offers four types of tab
buttons for aligning text—Left-Justified
Tab, Center-Justified Tab, Right-Justified
Tab, and Align to Decimal Tab. To create
a tab in the tab ruler, you can click a tab
button, then click a location in the tab
ruler or click a tab button, then enter a
location in the X text box in the Tabs
palette.
In this lesson, you will use the Tabs palette
to position text at specific horizontal posi-
tions within a frame.
▼
WORK WITH
TA B S
Lesson 1 Work with Tabs INDESIGN 9-5
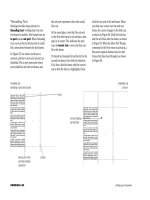
In Figure 3, the second column of text is
aligned with a left-justified tab. Note that
the tab is selected in the tab ruler—it is
highlighted with blue. When a tab is
selected, its horizontal location is indi-
cated in the X text box. This tab is posi-
tioned at 2.25.
In Figure 4, the tab has been changed to a
center-justified tab. Its horizontal location
remains unchanged; however, now the cen-
ter points of the text are aligned at the
2.25" mark.
QUICKTIP
You change a tab from one type to another by clicking the
tab in the tab ruler, then clicking a different tab button in
the Tabs palette.
FIGURE 1
Tabs palette
FIGURE 2
Moving a tab
FIGURE 3
Using the Left-Justified Tab button
FIGURE 4
Using the Center-Justified Tab button
Left-justified
tab
Tab ruler
Position
Palette above
Text Frame
button
Text that is left-
aligned is positioned
to the right of the tab
Left edge of
tab ruler
aligns with
left edge of
text frame
Tab moved
to 2.5"
Text moves
with tab
X text box
Left-Justified
Tab button
Selected tab
(highlighted
in blue)
Center-Justified
Tab button
Text is centered
beneath center-
aligned tab