THE FRACTAL STRUCTURE OF DATA REFERENCE- P27 pot
Bạn đang xem bản rút gọn của tài liệu. Xem và tải ngay bản đầy đủ của tài liệu tại đây (122.34 KB, 5 trang )
120 THE FRACTAL STRUCTURE OF DATA REFERENCE
In addition, the access density A and storage intensity q are, in effect,
inverses of each other:
This relationship applies, not just to individual applications, but also to aggre
-
gates of applications, since the average access density per unit of storage is
given by:
We can therefore conclude from (9.11) that
(9.12)
In words, this says that as the cost of disk storage falls, the access density of
applications should also be expected to fall, but at a slower rate. Note, however,
that the deployable applications model does not predict how much of a time
lag should be expected between these events.
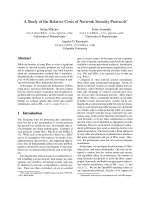
Equation (9.12) provides a convenient method of model calibration. As
Figure 9.2 illustrates, both storage cost and access density declined steadily
throughout the 1980’s and early 1990’s. From 1980 to 1993, storage costs
fell at a compound annual rate of approximately 15 percent (from about 39 to
about 5 dollars per megabyte), while access densities fell at a compound annual
rate of approximately 11 percent (from about 9 to about 2.1
I/O’s per second
per gigabyte). Due to the reasonably steady nature of the process during this
extended period of time, we can therefore conclude, even without knowing the
specific time lag between cause and effect, that
or
(9.13)
Here we have added slightly to the exact calculation so as to express β
^
as a
round number. The upward direction of round
-
off is the conservative direction;
it corresponds, in the subsequent section, to adopting a slightly more demanding
objective for disk performance than would have been the case if we had carried
forward additional digits.
Disk Applications: A Statistical View
121
Figure 9.2. Approximate trends in access density and storage cost.
3. DISK PERFORMANCE REQUIREMENTS
The results just obtained apply directly to the assessment of disk performance
for new generations of disks. For concreteness, consider the case in which,
compared to
GOODDISK, GOODDISK' has twice the capacity and half the cost per
unit of storage. Then by (9.11), we should expect that, as a result of deploying
GOODDISK', the average storage intensity of applications will increase by a
factor of 2
1 3
= 1.62. However, the amount of storage per disk increases by
a factor of 2. Therefore, we must expect the net load per disk to increase by a
factor of 2/1.62 = 1.23.
In order for performance to stay “in balance” with the projected application
requirements, the servicing of
I/O requests must therefore speed up by enough
to allow a 23 percent throughput increase.
Suppose, hypothetically, that we have adopted a fixed objective for the
response time per
I/O. Then an increase in throughput by some factor 1 + δ (for
example, the factor of 1.23 needed in the present analysis) can be achieved by
reducing the service time per
I/O by some corresponding factor 1 – where
we would expect that < δ.
While theoretically appealing, however, the reasoning just outlined does not
“ring true”. It is too risky to maintain a fixed response time objective while
allowing service times to vary, since queue times may then also vary. The larger
the queue time grows relative to service time, the more erratic the performance
perceived by users of the system is likely to become.
122
THE FRACTAL STRUCTURE OF DATA REFERENCE
For this reason, we do not adopt a fixed response time objective for the
purpose of the present analysis. Instead, we aim to ensure performance stability
by controlling the ratio of queue time to service time. The net result of this
requirement is to force response times and service times to fall together.
If the load across a collection of disks is uniform, then to prevent the ratio
of queue time versus service time from increasing, utilization must remain
constant. So for the case of uniform disk load, we must require that the
reduction in disk service time match the expected increase in disk load: a
service time reduction of 23 percent is needed.
The reference [44] examines how to meet a similar objective in the case of a
skewed environment. Given typical variations of disk load, the desired stability
can be achieved by meeting the following condition:
where it should be recalled that D represents the service time per
I/O and y is
the average
I/O rate per disk. To ensure that both GOODDISK and GOODDISK'
meet an objective of this form equally well, given that the load of the latter disk
increases by a factor of 1 + 6 and its service time decreases by a factor of 1 –
we require that:
Since 1, we can simplify this condition using first
-
order Taylor
(9.14)
Fortuitously, the factor that appears in prens on the right side of (9.14) is
rather insensitive to the actual I/O load per disk y. provided that it is in a
“reasonable” range. For example, if y is in the range 9 ≤ y ≤ 49, then the
factor on the right side of (9.14) is in the range 1.39 ≤ factor 1.6. For
“back
-
of
-
the
-
envelope” purposes, then, we can state the result of (9.14) as
follows: in a skewed environment, the average throughput which a disk can
sustain increases by a percentage roughly half again as large as the percentage
by which the disk’s service time per
I/O can be reduced.
To achieve the throughput improvement of 23 percent that is needed for
GOODDISK', we therefore conclude that a reduction in service time in the range
of 15 percent (for typical disk skews) to 23 percent (for no skew) will be
required.
Since the results just stated might leave the impression that a skewed environ
-
ment has some performance advantage compared with a uniform distribution of
I/O across the disks supporting an application, it is important to emphasize that
expansions:
Disk Applications: A Statistical View
123
the reverse is actually the case. Any disk can deliver its best level of throughput
per actuator in a uniform environment. The performance degradation due to
skew is less, however, for a larger
-
capacity disk than for a smaller one. The
required improvement in service time needed in deploying
GOODDISK', as just
stated above, takes into account this effect.
The needed reduction in service time can be (and historically, has been)
accomplished in many ways. These include faster media data rate, shorter seek
time, shorter latency, schemes to access the disk via multiple paths, higher path
bandwidth, disk buffering and/or storage control cache, and many others.
What if
GOODDISK' does not deliver the needed improvement in service
time? For example, what if the
I/O capabilities of GOODDISK' and GOODDISK
are exactly the same?
The case of no improvement in performance is a useful extreme to examine.
It helps to illustrate the difference between the conclusions of the deployable
applications model, as just presented above, and those which would be reached
by adopting performance objectives based upon access density.
Suppose that in some specific environment where
GOODDISK is in use, stor
-
age capacity and performance are in perfect balance, so that GOODDISK’
S
I/O
capability and its capacity both run out at the same time. Also, suppose that the
I/O capabilities of GOODDISK' and GOODDISK are the same. If we reason from
performance objectives based upon access density, we must then conclude that
the extra capacity offered by
GOODDISK' has no value in the given environment,
because it cannot be used. Therefore, we must consider that
GOODDISK' has
the same effective storage cost as
GOODDISK, despite the fact that GOODDISK'
offers twice the capacity at the same price.
Given these circumstances, the deployable applications model draws a dif
-
ferent conclusion. It projects that the lower cost per unit of storage will enable
a range of new applications, causing average access density to decrease, and
average storage intensity to increase, by a factor of 1.62. Therefore, we can
use up to 62 percent of the added capacity offered by
GOODDISK'. As a result,
GOODDISK' reduces the effective cost of storage by a factor of 1.62.
Given that
GOODDISK' offers twice the storage of GOODDISK for the same
price, the conclusion that some reduction of effective costs must occur as
the result of deploying
GOODDISK' seems compelling. As just shown, the
deployable applications model provides a way to quantify the resulting effective
cost, while also accounting for the performance of the new disk. Pulling the
reasoning about
GOODDISK and GOODDISK' into a systematic procedure, the
steps of the method are:
1. Assume that disk capacity and performance are initially “in balance”. More
specifically, assume that the level of capacity use at which the old disk’s
I/O capability is exhausted (the usable capacity) is the same as its physical
capacity.
124
2. Estimate the change y'/ y in the I/O capability due to the new disk. For an
environment with no skew of load across disks, the
I/O capability should
be expected to increase by the same ratio as the decrease in device service
time. For an environment with skew, the change y'/ y can be estimated based
upon (9.14); or, as a “rule of thumb”, the
I/O capability can be increased by
half again the percentage by which the service time falls. The factor y'/ y
represents an increase in usable capacity that comes with the new disk.
3. Use (9.11) to estimate the change q
-
/q
-
in storage intensity due to applica
-
tions that the new disk enables. This factor also represents an increase in
the usable capacity.
4. For performance to remain in balance with capacity, all of the new disk’s
physical capacity must continue to be usable:
THE FRACTAL STRUCTURE OF DATA REFERENCE
(9.15)
or equivalently,
(9.16)
(with equality in the case where the disk remains in perfect balance).
5. If the new disk satisfies (9.16), its effective storage cost E'
net
is the same as
its nominal cost E'. If the new disk fails to satisfy (9.16), then its effective
storage cost exceeds the nominal cost in proportion to the shortfall:
(9.17)
Equations (9.16) and (9.17) can be illustrated by validating our previous conclu
-
sions about GOODDISK'. We previously reasoned that an increase of 23 percent
in
I/O capability was needed for GOODDISK' to remain in balance, given an ex
-
pected increase in storage intensity by a factor of 1.62. This agrees with (9.16),
since 1.62 x 1.23 = c’/c = 2. If
GOODDISK' delivers at least the required 23
percent improvement, then its effective cost will be the same as its nominal cost.
We also reasoned that if
GOODDISK' offers no improvement in performance,
then its effective cost would be a factor of 1.62 lower than that of
GOODDISK.
This agrees with (9.17), since in this case the larger term within the maximiza
-
tion yields a right side equal to E' x2 / (1 x 1.62) = (E/ 2) x2/1.62 = E/ 1.62.
4. CONCLUSION
As promised, we have applied the deployable applications model to demon
-
strate a cause
-
and
-
effect mechanism behind the historical linkage that has