THE FRACTAL STRUCTURE OF DATA REFERENCE- P11 pot
Bạn đang xem bản rút gọn của tài liệu. Xem và tải ngay bản đầy đủ của tài liệu tại đây (132.35 KB, 5 trang )
36
proves to be useful for comparison against the proposed synthetic pattern of
requests.
To estimate λ(t) assume that some initial request occurs at time t = 0
(time is measured relative to whatever initial request we choose to examine).
Consider the number N(t) of requests that occur at some time 0 < t
i
≤ t.
Let us now assume that the
I/O requests are being serviced by a cache, whose
single
-
reference residency time is given by τ = t. To determine the expectation
of N(t), we must examine all potential choices of the initial
I/O request. Let
us divide these potential choices into groups, depending upon the cache visit
within which they occur.
For any given, initial
I/O request, let V(t) be the largest number of I/O’s that
occurs during any time period of length t that falls within the cache visit that
contains the request. Note that V(t) is identical for all initial
I/O requests that
fall within the same cache visit. Also, for all such
I/O’s, 0 ≤ N(t) ≤ V(t) – 1
(the case N(t) = V(t) cannot occur since the count of
I/O’s given by N(t) does
not include the
I/O at time t = 0). Moreover, values must occur throughout
this range, including both extremes. For the identified cache visit, we therefore
adopt the rough estimate E[N(t)] ≈
1
/
2
[V(t) – 1]. For all cache visits, we
estimate that
THE FRACTAL STRUCTURE OF DATA REFERENCE
But the expected number of I/O’s per cache visit is just 1 / m(t). Although
not all of these must necessarily occur during any single time period of length
t, such an outcome is fairly likely due to the tendency of
I/O’s to come in bursts.
Thus, E[V(t)] ≈ 1/ m(t), which implies
Asymptotically, for sufficiently small miss ratios,
(2.1)
Based upon (2.1), we can now state the asymptotic behavior of the arrival
rate λ(t). For sufficiently small miss ratios, we have
(2.2)
This is the asymptotic behavior that we wish to emulate.
Hierarchical Reuse Daemon 37
2.
We now define a synthetic, toy application that performs a random walk
within a defined range of tracks. A number of tracks equal to a power of two
are assumed to be available for use by the application, which are labeled with
the track numbers 0 ≤ l ≤ 2
H
max
– 1. In the limit, as the number of available
tracks is allowed to grow sufficiently large, we shall show that the pattern of
references reproduces the asymptotic behavior stated by (2.2).
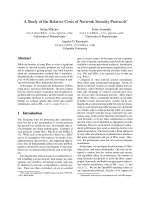
The method of performing the needed random walk can be visualized by
thinking of the available tracks as being the leaves of a binary tree, of height
H
max
. The ancestors of any given track number l are identified implicitly by the
binary representation of the number l. For example, suppose that H
max
= 3.
Then any of the eight available track numbers l can be represented as a three
-
digit binary number. The parent of any track l, in turn, can be represented as
a two digit binary number, obtained by dropping the last binary digit of the
number l; the grandparent can be represented as a one digit binary number,
obtained by dropping the last two binary digits of the number l; and all tracks
have the same great
-
grandparent.
Starting from a given leaf l
i
of the tree, the next leaf l
i+1
is determined as
follows. First, climb a number of nodes 0 ≤ k<<H
max
above leaf l
i
. Then,
with probability v, climb one node higher; with another probability of v, climb
an additional node higher; and so on (but stop at the top of the tree). Finally,
select a leaf at random from all of those belonging to the subtree under the
current node.
No special data structure is needed to implement the random tree
-
climbing
operation just described. Instead, it is only necessary to calculate the random
height 0 ≤ H ≤ H
max
at which climbing terminates. The next track is then
given by the formula
DEFINITION OF THE SYNTHETIC APPLICATION
where R is a uniformly distributed random number in the range 0 ≤ R < 1.
3. ANALYSIS OF THE SYNTHETIC APPLICATION
Consider, now, the probability of a repeat request occurring to track l
i
, at
step i + n (the nth step after some identified initial request i). Suppose that
H
highest
(abbreviated H
hi
) is the maximum of the heights H encountered in
producing the requests i + 1, . . . , i + n, and that this maximum height was
encountered in producing the request i<i+n
hi ≤ i + n. Then clearly, track
l
i
is one of the leaves in the subtree from which the random selection at step
i + n
hi
is performed.
Moreover, given no further information as to events occurring at steps i +n
hi
or after, any of the leaves of this subtree might be selected at step i + n, and
38
these are the only leaves that can be selected. By symmetry, it follows that
the probability of a repeat request to track l
i
, at step i + n, is identical to the
probability of requesting any other leaf of the same subtree, namely 2
-Hhi
.
Putting the same fact in a different way, it is the lowest value of 2
-H
achieved
in n trials of the random variable H.
To understand the implications of this, consider, first, a single trial. We now
wish to determine the cumulative distribution F(
.
) of the quantity 2
-H
. This is
a step function, since H assumes only discrete values. For the present purpose,
it suffices to consider only the values ofthe domain of F(
.
) that have non
-
zero
probabilities. Let H = k + j; that is, j 0 represents the random part of
H after removing the constant k. Also, let us assume that the upper bound
on j, imposed by the height H
max
of the tree’s root, is sufficiently large that
its presence can be neglected. Then, by taking advantage of the fact that j is
distributed as a geometric random variable with parameter v, we have
THE FRACTAL STRUCTURE OF DATA REFERENCE
(2
-
3)
Given this description of F(
.
), we may apply the David
-
Johnson extreme
value approximation [20] to estimate the smallest value γ
hi
of the random
variable γ = 2
-H
which we should expect after n trials. To obtain the needed
estimate, this technique requires us to solve the equation
(2
-
4)
Since γ
hi
assumes only discrete values, (2.4) cannot, in general, be solved
exactly. In many applications of the David
-
Johnson approximation, a compli
-
cation of this type must be dealt with carefully. For our own purpose, however,
we choose to disregard the requirement that the solution must be discrete, since
we are not so much interested in obtaining a precise solution for any given
value of n, as we are in determining the asymptotic behavior of the solution as
n increases.
Keeping in mind that a given value of γ
hi
has a corresponding highest climb
H
hi
=j
hi
+k,and that j
hi
=H
hi
–k = –log
2
γ
hi
– k, we may take advantage
of (2.3) to express (2.4) equivalently as
Hierarchical Reuse Daemon 39
This equation is easily solved to yield,
(2.5)
We can now return to the behavior of the arrival rate λ(t). To introduce time
into our synthetic framework for generating requests, we set n = tr, where
r represents the number of synthetic requests per second which we wish to
produce. Based upon (2.5), we must then have that the arrival rate of a repeat
request, which follows an initial request by an amount of time t, is given by
or asymptotically,
(2.6)
Comparing (2.2) with (2.6), we can therefore arrange matters so that, asymp
-
totically, λ'(t) = λ(t). This requires that the two conditions
and
be met. Simplifying, these two conditions yield the parameter values
(2.7)
and
(2.8)
In view of the rough nature of the calculations just presented, and since
k must be a small integer, it should not be surprising that, in practice, k is
best determined by trial and error, rather than by direct application of (2.8).
Experiments performed via simulation show that it is easy to select parameters
k and v which result in a pattern of reference that faithfully conforms to the
hierarchical reuse model, not just asymptotically, but throughout the behavioral
range of interest.
40
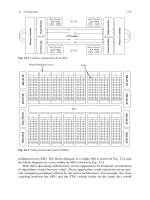
4. EMPIRICAL BEHAVIOR
Figures 2.1, 2.2, and 2.3 present the results of a series of simulation ex
-
periments. Each test was performed with a simulated request rate of one I/O
per second. To reflect a range of values for the parameter 8, tests were per
-
formed for v = 0.44 (corresponding to = 0.15), v = 0.40 (corresponding
to θ = 0.25), and v = 0.34 (corresponding to θ = 0.35). Each figure shows
the results for a specific value of v, and also the slope 8 that, by (2.7), should
correspond to that value. For each value of the parameter v, the cases k = 0
through k = 3 are examined. All simulations used the value H
max
= 14 (a
high enough value to prevent this limit from having a noticeable impact).
A strong match is apparent between the curves presented by Figures 2.1
-
2.3
and the intended characteristics. Many of the curves appear to be, not just
asymptotically linear, but linear throughout the entire range of the plot. If we
focus specifically on the most interesting region of interarrival times (those in
the range of 32–512 seconds), all of the curves appear to have settled into a
close approximation of the predicted asymptotic slope throughout this range.
The figures do show a slight dependency of the slope upon the parameter k,
which is not predicted by the analysis presented in the previous section, and
which becomes stronger as k increases. It is possible that this dependency may
disappear for extremely large values of the interarrival time, or it may reflect a
second
-
order effect not captured by the approximate method of analysis adopted
in the previous section.
THE FRACTAL STRUCTURE OF DATA REFERENCE
Figure 2. 1.
per second, with v = 0.44 (corresponding to θ = 0.15).
Distribution of interarrival times for a synthetic application running at one request