How to trade the new single stock future Part 6 potx
Bạn đang xem bản rút gọn của tài liệu. Xem và tải ngay bản đầy đủ của tài liệu tại đây (858.42 KB, 22 trang )
Although many trading systems and methods can be used for
trading in SSFs, some clearly work better than others. This chapter
provides an overview of indicators and methods that I have found
particularly useful in the futures markets. In reviewing these indi-
cators, you should bear in mind that systems and methods used for
trading stocks are not necessarily effective or applicable to futures
given the more volatile nature of the futures market, which, as you
know, is a function of its lower margin.
❚ The Gap Trade
The opening gap trade is a short-term trade that can be used ef-
fectively by day traders. The logic and rules of its application are
not only simple but logical and sensible as well. The efficacy of the
gap trade is based on trader psychology. The tendency of a stock or
SSF contract to open below the previous day’s session low or above
the previous day’s session high is a function of news that, in turn,
prompts traders and investors to sell or buy aggressively. Hence,
127
Advanced
Technical
Methods for
SSFs
❚ CHAPTER ELEVEN
bearish news can cause an SSF market to open below the previous
day’s session low, whereas bullish news can cause an SSF market to
open above the previous day’s session high. Of course, the tendency
of an SSF to act this way is a function of the behavior of the un-
derlying stock.
As examples of gap higher and gap lower openings, examine
Figures 11.1 and 11.2.
❚ The Gap Trade Concept
Now that you can spot gap trades, this is the concept: When a
market opens gap up (G+), there is a tendency for the price to retrace
following the emotional buying that promoted the gap higher open-
ing. If the price of the stock or SSF then falls below the high of the
previous day, there is a tendency for the rest of the day to be lower
and for the SSF to close lower than its open as well as lower than the
high of the previous day, as illustrated in Figures 11.3 and 11.4.
At point 1 in Figure 11.3, NEM opened above the high of the
previous day (point 2). It later dropped below point 2, giving a gap
sell indication and close at point 3, lower than the price at which
it triggered a sell pattern. At point A, prices opened above the pre-
vious daily high, B. Prices then declined to close at point C for a
profitable day trade. At point D, prices opened above point E.
When prices dropped below E, a short position would be entered
and closed out at the end of the day, in this case, profitably.
Figure 11.4 shows the gap sell signal in NVDA. Note the gap
higher open at A and penetration below the high of the day (A)
and then the close well below the high of the day (A) at point B.
When a market opens gap down (G−), there is a tendency for the
price to retrace following the emotional selling that promoted the
gap lower opening. If the price of the stock or SSF contract then
rallies above the low of the previous day, there is a tendency for the
rest of the day to be higher and for the SSF contract to close higher
than it opened as well as higher than the low of the previous day, as
illustrated in Figures 11.5 and 11.6.
128 How to Trade the New Single Stock Futures
11 / Advanced Technical Methods for SSFs 129
❚ FIGURE 11.1 Gap Lower Openings in IBM (note − signs)
❚ FIGURE 11.2 Gap Higher Openings in Kaufman and Broad (note + signs)
+
➤
130 How to Trade the New Single Stock Futures
❚ FIGURE 11.3 The Gap Sell Trades in Newmont Mining (NEM)
❚ FIGURE 11.4 Gap Sell Trade in NVDA
➤
11 / Advanced Technical Methods for SSFs 131
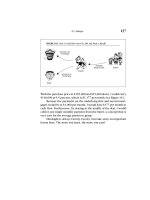
❚ FIGURE 11.5 Gap Buy Signal in ADM. The lower open at A (i.e., below low B)
resulted in a buy, which was closed out at C.
❚ FIGURE 11.6 Gap Buy Signals on Days A and B
❚ Trading Gaps
Although gaps don’t occur often, they are very amenable to SSF
trading. SSF gap trades are usually day trades, although you can
hold until the next day. Take your time and study the gap trades.
You may like what you see, particularly if you’re a short-term trader.
The rules for trading gaps in SSFs are simple. They are as follows:
• If an SSF opens above the high of the previous day by at least 5
percent of the previous daily trading range (i.e., high − low of
day), then sell short on a penetration back below the high of
the previous day.
• Use a risk management or dollar stop loss.
• Exit the trade at the end of the day.
• Use a trailing stop loss intraday if the position moves strongly
in your favor.
• Consider trading multiple contracts and exiting on a scale up.
• If an SSF contract opens on a gap below the low of the previous day
by 5 percent or more of the previous daily trading range, then
sell short on a penetration back above the low of the previous
day.
• Use a risk management or dollar stop loss.
• Exit the trade at the end of the day.
• Use a trailing stop loss intraday if the position moves strongly
in your favor.
• Consider trading multiple contracts and exiting on a scale up.
❚ Momentum Divergence
Momentum (also known as rate of change) is a powerful indica-
tor, albeit one that has not been used very effectively by many
traders. The difficulty in using the momentum indicator for timing
SSF (as well as stock) trades is in its interpretation. This topic has
been discussed extensively in my book Momentum Stock Selection
(McGraw-Hill, 2000), in which I outline a number of steps for
132 How to Trade the New Single Stock Futures
using momentum as a timing indicator in stocks. The use of mo-
mentum in SSFs is a natural extension of its use in stocks.
As noted by the heading of this section, momentum can be used
to spot momentum divergence, which is simple to find but difficult
for some traders to apply because they are not familiar with the cor-
rect timing application of momentum divergence. This section
shows you how to use momentum divergence for timing SSF trades.
Definition
The momentum indicator compares the price of a given market
today with the price X days ago. If the price today is higher than the
price X days ago, then momentum is positive, or bullish. If the price
of a market is lower than it was X days ago, then momentum is bear-
ish. All you need to do to calculate momentum is subtract the clos-
ing price of a market today from the closing price X days ago if the
price today was lower than the price X days ago. As an example, if
the price today is 10 and the price X days ago was 20, then momen-
tum for today is −10 (minus 10). If the price X days ago was 10 and
the price today is 20, then momentum is +10 (plus 10). The X in
this case is 28 periods. For a daily SSF price chart, the momentum
would be determined using 28 days. For an hourly SSF chart, mo-
mentum would be determined using 28 periods of 60 minutes each.
Divergence
Divergence occurs when price and momentum are moving in op-
posite directions. In particular, when price is making a new low for
a given period while momentum is moving higher, bullish diver-
gence is occurring. When price is making a new high while mo-
mentum is moving lower, bearish divergence is said to be in process.
Note that bullish and bearish divergence in and of themselves do
not indicate that one should buy or sell. The divergence pattern
must develop into a sell signal or a buy signal. Please refer to Figures
11.7 through 11.10 for examples of bullish and bearish divergence.
11 / Advanced Technical Methods for SSFs 133
134 How to Trade the New Single Stock Futures
❚ FIGURE 11.7 Bullish Divergence. Price low B was lower than price low A, while
momentum C was higher than momentum D, thereby creating bullish divergence.
❚ FIGURE 11.8 Bullish Divergence. Price low A was lower than price low C, while
momentum low B was higher than momentum low D, thereby setting up bullish
divergence.
11 / Advanced Technical Methods for SSFs 135
❚ FIGURE 11.9 Bearish Divergence. Price high A was higher than price high C,
while momentum at B was lower than momentum D, setting up bearish divergence.
❚ FIGURE 11.10 Bearish Divergence
The Key to Momentum Divergence
The key to using momentum divergence effectively in trading is
timing. See Figures 11.11 through 11.14 for specific examples of buy
and sell signals generated after momentum divergence patterns
have developed.
Finding the Signals
Figures 11.11 through 11.14 illustrate buy and sell signals. As you
can see, in the case of bullish divergence the momentum high
(point E on Figures 11.13 and 11.14) is the buy points that, once
penetrated, yield a buy signal. Figures 11.11 and 11.12 show bearish
momentum divergence. Point E in this case is the sell point; once
it has been penetrated, a sell signal develops. Remember that the
momentum is what triggers a buy or a sell signal, not the price be-
havior of the SSF contract.
❚ Momentum/Moving Average (MOM/MA)
Still another method of timing SSF trades is by using the momen-
tum indicator (MOM) previously discussed with its moving average.
The simple rules for this combination indicator are as follows:
• Calculate a 28-day momentum indicator.
• Calculate a 28-day moving average of the momentum indicator.
• When the 28-day momentum indicator rises above the 28-day
moving average of the momentum indicator, a change in
trend to the upside has likely started.
• When the 28-day momentum indicator falls below the 28-day
moving average of the momentum indicator, a change in
trend to the downside has likely started.
• Buy and sell signals are generated accordingly.
136 How to Trade the New Single Stock Futures
11 / Advanced Technical Methods for SSFs 137
❚ FIGURE 11.11 Momentum Divergence Sell Signal. After setting up bearish
divergence pattern A>C with B<D, a sell signal was triggered upon penetration of E.
❚ FIGURE 11.12 Momentum Divergence Sell Signal. After setting up bearish
divergence at A>B and C<D, a sell signal was generated at penetration of E.
138 How to Trade the New Single Stock Futures
❚ FIGURE 11.13 A momentum divergence buy signal will occur if point E is
penetrated.
❚ FIGURE 11.14 A momentum divergence buy signal occurs at penetration of point E.
Figures 11.15 and 11.16 illustrate buy and sell signals, respec-
tively, in a futures contract. Remember that this approach is not a
trading system but rather a timing method. In order to function as
a complete trading system, the method needs additional features,
such as a risk management stop loss, added to it.
You can use this approach in trading SSF spreads as well as flat
positions. This approach is also discussed in my book Momentum
Stock Selection (McGraw-Hill, 2000).
11 / Advanced Technical Methods for SSFs 139
❚ FIGURE 11.15 Momentum/Moving Average (MOM/MA) Signals. This chart shows
a buy signal at A and a sell signal at B.
140 How to Trade the New Single Stock Futures
❚ FIGURE 11.16 Momentum/Moving Average (MOM/MA) Signals. Note that two
consecutive closes by the momentum above its MA signals a buy, whereas two
consecutive closes below its MA signals a sell.
Seasonality is one of the most important underlying forces in the
stock and futures markets. Although many traders, market analysts,
and economists dispute the value—and even the existence—of sea-
sonal forces in the markets, seasonal forces, or seasonals, do exist
and do indeed account for certain trends within the course of the
calendar year.
Art Merrill, for example, in his classic book The Behavior of Prices
on Wall Street (Analysis Press, 1980) demonstrated the existence of
preholiday behavior in the Dow Jones Industrial Average, conclud-
ing there was a high probability of higher closing prices in the Dow
on the day before major U.S. holidays. His study demonstrated sta-
tistically that the odds of a chance occurrence in his findings were
about 1 in 10,000!
My work in the futures markets also verifies the existence of sea-
sonal patterns, which are often reflected in individual stocks as well
as in the major stock indices.
As an example of such seasonal patterns, consider the tendency
of the S&P 500 average to move higher from approximately January
12 through 18, a pattern that has been in existence for many years.
141
A Seasonal
Strategy for
SSFs
❚ CHAPTER TWELVE
In fact, close examination of S&P futures from 1982 through 2001
(and well before 1982 in the cash S&P index) indicates a high
probability of upward movement during this time frame.
Figure 12.1 shows a historical summary that illustrates my point
about seasonality in the S&P 500 index. This summary shows hy-
pothetical trading in S&P futures—buying on the close of trading
January 12 every year from 1983 through 2001 and exiting the po-
142 How to Trade the New Single Stock Futures
❚ FIGURE 12.1 Key Date Seasonal Trade in S&P 500 Futures
MAR S&P 500 LONG Enter: 1/12 Exit: 1/18 Stop: 3 P/L Ratio: 1761.50 Trade #: 2197
ContractYr Date In Price In Date Out Price Out Prof/Loss Total
1983 1/12/83 147.950 1/18/83 148.350 0.400 0.400
1984 1/12/84 169.600 1/18/84 169.900 0.300 0.700
1985 1/14/85 173.350 1/18/85 173.400 0.050 0.750
1986 1/13/86 207.400 1/20/86 208.350 0.950 1.700
1987 1/12/87 260.750 1/19/87 271.400 10.650 12.350
1988 1/12/88 246.350 1/18/88 252.400 6.050 18.400
1989 1/12/89 285.250 1/18/89 288.700 3.450 21.850
1990 1/12/90 340.950 1/18/90 340.850 -0.100 21.750
1991 1/14/91 314.350 1/18/91 333.900 19.550 41.300
1992 1/13/92 415.800 1/20/92 417.400 1.600 42.900
1993 1/12/93 431.450 1/18/93 437.300 5.850 48.750
1994 1/12/94 474.200 1/18/94 474.400 0.200 48.950
1995 1/12/95 464.250 1/18/95 471.150 6.900 55.850
1996 1/12/96 604.950 1/18/96 610.500 5.550 61.400
1997 1/13/97 764.300 1/20/97 780.150 15.850 77.250
1998 1/12/98 945.500 1/20/98 985.200 39.700 116.950
1999 1/12/99 1251.100 1/19/99 1257.000 5.900 122.850
2000 1/12/00 1442.000 1/18/00 1469.500 27.500 150.350
2001 1/12/01 1330.300 1/18/01 1356.000 25.700 176.050
Trades: 19 Winners: 18 Losers: 1 %Winners: 94.73 Daily PF: 1.63
Avg Prof: 9.78 Avg Loss: -0.10 %Avg Prof: 1.64 %Avg Loss: -0.02
Copyright ©2002 MBH Commodity Advisors, Inc. 847-446-0800 1-800-678-5253
trade-futures.com
sition on the close of trading January 18 every year. For cases in
which the market was closed on the ideal entry date, the trade
would be executed on the close of business the next day; the trade
carries a 3 percent closing basis stop loss.
As you can see, this pattern was correct well over 90 percent of
the time during period shown. Naturally, a good statistician would
argue that there were not enough trades in the sample to constitute
a valid test of the pattern. If you look back prior to 1982, when S&P
futures began trading, you’ll find a similar pattern in the cash S&P
500, albeit with a lower but still significant percentage accuracy to
the listing here shows. Seasonals are not perfect and some do indeed
deteriorate over time, but in the main they are reliable and valid
methods for trading.
Although literally hundreds of seasonal patterns exist in the
major stock indices—some short-term, some longer-term—these
patterns can be used successfully by traders who are aware of them
and who, moreover, have the discipline to use them consistently.
As a further example, consider the seasonal patterns in the crude
oil market shown in Figure 12.2.
It shows the seasonal pattern in fuel oil dating back to the 1930s.
The line plot shows a strong tendency for prices to rise from August
until late in the year. The up arrows show a high probability of an
upward move for the month. The down arrows show a high proba-
bility of a downward move for the month. The bottom row shows
the percentage of times the monthly average prices for the given
month have been higher or lower for the period studied.
Based on the chart in Figure 12.2, you would expect to find a sim-
ilar pattern in crude oil futures and, most likely, in petroleum stocks
as well. Figure 12.3 shows the same pattern on a weekly basis in
November crude oil futures. You can see the tendency for higher
prices from late February through late August.
Based on the patterns illustrated in these studies, the odds are
that a similar pattern would be found in petroleum company shares.
Figure 12.4 shows the monthly prices of a major petroleum stock re-
flecting this seasonal pattern. Using this approach, trades could be
made in SSFs or NBIs.
12 / A Seasonal Strategy for SSFs 143
❚ Other Timing Systems and Methods
The availability of low-cost computers, historical data, and ad-
vanced analytical programs allows contemporary traders to develop,
test, and refine a literally unlimited number of trading systems or
144 How to Trade the New Single Stock Futures
❚ FIGURE 12.2 Seasonal Tendency in Cash Fuel Oil, 1938–1997
methods. Yet in spite of these advances, most traders still lose. Even
though the SSF market offers many new opportunities to traders
and investors, far too many adventurers in this market will lose
money. Three essential reasons account for this sad state of affairs:
1. Most traders fail to adequately pretest trading systems and
timing indicators before using them.
2. Most traders overoptimize trading systems, thus creating sys-
tems that perform exceptionally well in pretesting but, be-
cause of their curve-fitted nature, fail to perform profitably in
real-time applications. Curve fitting is the process of adjust-
ing a trading system to perform well on historical data. Curve-
fitted systems tend to fail in the future.
3. Most traders lack the self-discipline and winning psychology
to consistently apply their methods to the markets.
12 / A Seasonal Strategy for SSFs 145
❚ FIGURE 12.3 Seasonal Tendency in November Crude Oil Futures
To avoid becoming a statistic in the SSF market, I recommend
the following general rules for trading systems and timing methods.
Please take them seriously. I have learned them through lengthy
and often painful experiences:
•Your trading system or timing method must be one with which
you are comfortable, so you’ll apply it consistently without
second-guessing.
•Your trading system or method should ideally be based on a
concept or concepts that have some degree of validity.
•Your trading system or method must represent the worst-case
scenarios in pretesting as opposed to best-case results. I say this
because the reality of the marketplace is that the worst case
develops more often than the best case. Showing worst-case
146 How to Trade the New Single Stock Futures
❚ FIGURE 12.4 Seasonal Price Pattern in a Petroleum Stock. Arrows up show
seasonal rallies in this petroleum stock. The arrow down shows a contraseasonal
decline.
results historically will temper your optimism, melding firmly
with realistic expectations as opposed to dreams of perfection.
• Make certain that the timing method or system you use pro-
vides clear-cut rules of application that, by their nature, elim-
inate the need for interpretation and/or guessing.
• Consider using a different method for exiting trades than the
one that was used for entering trades.
• Consider different indicators for long and short positions.
• If your trading decisions are currently based on fundamentals
alone, then consider adding timing to the mix to improve the
results.
• If your trading decisions are currently based exclusively on
timing and technical factors, you may want to add some gen-
eral fundamentals into the plan to improve the longer-term
perspective.
• Consider adding contrary opinion indicators into your trading
plan, as futures tend to be more responsive to trader sentiment
than are stocks. (See Chapter 13.)
• Remember that systems that were effective for stocks may not
necessarily be effective in the SSF markets and vice versa.
• Develop a system or method for trading SSF spreads. This area
could offer some of the largest rewards with the lowest amount
of risk.
• Study timing oscillators, such as moving average conver-
gence/divergence (MACD) for short-term swing trading.
• Investigate more complex methodologies, such as combina-
tions of SSF futures and stock options.
12 / A Seasonal Strategy for SSFs 147
This Page Intentionally Left BlankThis Page Intentionally Left BlankThis Page Intentionally Left BlankThis Page Intentionally Left BlankThis Page Intentionally Left Blank
This Page Intentionally Left Blank
