Photoshop CS4 Studio Techniques- P5 doc
Bạn đang xem bản rút gọn của tài liệu. Xem và tải ngay bản đầy đủ của tài liệu tại đây (1.7 MB, 30 trang )
106
Chapter 3 Layers and Curves
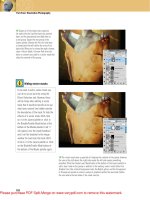
Layer Styles
Choose Layer > Layer Style to access a bunch of really neat
options. Some of the same options are available under the
Layer Style pop-up menu at the bottom of the Layers panel
(it’s the leftmost icon). To experiment with these options,
create a new, empty layer, and paint on it with any of the
painting tools. Then apply one of the effects found in the
Layer Style menu: Drop Shadow, Inner Shadow, Outer
Glow, Inner Glow, Bevel and Emboss, and so on (Figures
3.26 to 3.28). You can use the default settings for now. After
applying an effect, use the Eraser tool to remove some of
the paint on that layer. Did you notice that the layer effect
updates to refl ect the changes you make to the layer? In
one simple step, layer styles create results that would usually
require multiple layers and a lot of memory.
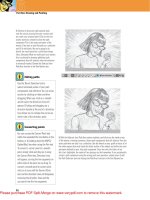
Figure 3.27 A text layer is ordinary
and flat, sometimes needing a little
more punch.
Figure 3.28 Adding a drop shadow
to a text layer makes the font much
clearer and adds to the overall image.
When you have at least one layer style applied to a layer,
a small fx appears next to the layer’s name in the Layers
panel. That’s the only indication that a layer has a layer
style attached to it. Click the triangle that appears next to
that symbol to see a list of the layer styles that are applied
to that layer (Figure 3.29). If you drag one of the layer
styles from that list and release the mouse button when the
cursor is over another layer, that layer style moves to the
Figure 3.26 One of the most popular layer styles is
the drop shadow.
Figure 3.29 Applied layer styles
appear under the fx symbol in
the layer.
107
II: Production Essentials
selected layer. Holding down Option/Alt when dragging
a style copies the style instead of moving it. Dragging the
word Effects from the top of the list moves all of the layer
styles attached to that layer. To remove a layer style, click its
name in the list and drag it to the Trash icon at the bottom
of the Layers panel.
You can lower the Fill setting at the top of Photoshop’s
Layers panel to reduce the opacity of the layer contents
while keeping the layer style at full strength (Figure 3.30).
Alternatively, hold down Shift and type a number while
the Move tool is active. Choose Layer > Layer Style > Create
Layer to have Photoshop create the layers that would usu-
ally be needed to create the effect. For example, you might
want to choose Create Layer if you want to distort the
effect separately from the layer to which it was attached.
Figures 3.31 to 3.34 show what a few of the layer styles can
do to an image.
Figure 3.31 Use an emboss layer style to give text a soft-
ened effect.
Figure 3.32 Settings for beveling and
embossing.
Figure 3.33 An inner shadow can create an interesting
cutout effect.
Figure 3.34 Settings for the inner shadow
layer style.
Figure 3.30 By lowering the Fill value
for a layer with effects applied, you
can achieve interesting results.
108
Chapter 3 Layers and Curves
Adjustment Layers
The Adjustment Layer pop-up menu at the bottom of the
Layers panel (it’s the half-black and half-white circle) allows
you to apply adjustments that will affect multiple layers. But
CS4 goes one step further with a new Adjustments panel,
making the use of this key Photoshop feature even easier.
This is the most versatile method for applying adjustments,
and it’s such a powerful feature that we’ve devoted an
entire chapter to it (Chapter 5, “Adjustment Layers”).
Fill Layers
The options in the New Fill Layer menu (Layer > New Fill
Layer) add solid color, gradient, and pattern content to a
layer. This feature is especially useful when combined with
vector masks, as described in Chapter 10. If you don’t want
a fi ll layer to fi ll your entire document, make a selection
before creating the fi ll layer, which will create a layer mask.
After a fi ll layer has been created, you can reset your fore-
ground and background colors to black/white by press-
ing D. Then you can use the Eraser tool to hide the area
and the Paintbrush tool to make areas visible again.
Solid Color Layer
Choosing Layer > New Fill Layer > Solid Color brings up
a dialog that asks you to name the layer you’re creating.
After you click OK, it opens the color picker, where you
can specify the color that will be used for the solid color
layer. When you’ve created one of these layers, you can
double-click the leftmost thumbnail of the layer in the
Layers panel to edit the color.
Gradient Layer
Choosing Layer > New Fill Layer > Gradient brings up a
dialog that asks you to name the layer; this creates a new
layer that contains a gradient (Figure 3.35). The gradient
is always editable by double-clicking the leftmost thumb-
nail in the Layers panel. If the Align with Layer check box
is turned on, the start and end points of the gradient are
determined by the contents of the selected layer rather
than by the document’s overall size. You can change the
Figure 3.35 The Gradient Fill dialog
is useful for creating a new layer that
contains a gradient.
109
II: Production Essentials
gradient content by clicking the Gradient selection in the
dialog.
Pattern Layer
Choosing Layer > New Fill Layer > Pattern allows you
to create a new layer that contains a repeating pattern
(Figure 3.36). Use this type of layer to add a brushed-
aluminum look to a background. Then, if you ever decide
to change the pattern, it’s as simple as double-clicking the
thumbnail in the Layers panel and choosing New Pattern
from the drop-down menu.
The Blending Mode Menu
The Blending Mode menu at the upper left of the Layers
panel allows the information on a layer to blend with the
underlying image in interesting and useful ways. Using this
menu, you can quickly change the color of objects, colorize
grayscale images, add refl ections to metallic objects, and
much more. This is an advanced feature, so you’ll have to
wait until you get to Chapter 9 to fi nd out more about it.
Automatic Selections
To select everything on a particular layer, just Command/
Ctrl-click the thumbnail image of the layer in the Layers
panel. If the layer fi lls the entire screen, it will select all
because this trick looks for transparent areas. You can hold
down the Shift key to add to a selection that already exists
or use the Option/Alt key to take away from the current
selection.
Layer Via Copy
The Layers menu offers a wide variety of options for copy-
ing, merging, and manipulating layers. Let’s look at one of
these choices. If you select an area of an image and then
choose Layer > New > Layer Via Copy, the selected area
is moved from the active layer to a new layer in the same
position (Figures 3.37 to 3.39). This feature is particularly
handy when you want to move just a portion of a layer so
that you can place it on top of another layer, or remove a
portion of a layer and add layer styles. Very handy, but keep
in mind that this won’t work with vector shape or fi ll layers.
Figure 3.36 A new fill layer with a
pattern makes it easy to repeat a small
image throughout a larger document.
Figure 3.37 Making a selection is the
first step to using the Layer Via Copy
option.
110
Chapter 3 Layers and Curves
Figure 3.39 Layer Via Copy is also useful for adding various layer styles.
Use All Layers
When you’re editing on a layer, some of the editing tools
might not work as expected. Most of the tools act as if each
layer is a separate document; they ignore all layers except
the active one—unless the tool has the Use All Layers
check box (labeled All Layers in the Paint Bucket tool)
turned on in the options bar of the tool you’re using. This
check box makes the tools act as if all the layers have been
combined into one layer. This possibility can work in your
favor or not, depending on what you’re trying to accom-
plish (Figures 3.40 and 3.41).
Figure 3.40 Using the Paint Bucket
tool without the Use All Layers option
checked fills the selected layer.
Figure 3.41 Using the Paint Bucket
tool with the Use All Layers option
checked attempts to fill all layers.
Figure 3.38 Selecting the Layer Via
Copy option moves the selection from
one layer into a new layer.
111
II: Production Essentials
Layer Shortcuts
You’ll be doing a lot of switching between layers, which can
get a bit tedious. Here are some quick shortcuts:
. Command/Ctrl-click anywhere in the image window
when using the Move tool to activate the layer directly
below your cursor. To fi nd out which layer is active,
glance at the Layers panel.
. You won’t always need the layer directly below your cur-
sor. Control-clicking/right-clicking brings up a menu
of all the layers that contain pixels below your cursor.
Choose the name of the layer you want, and Photoshop
switches to that layer.
. To get the Move tool temporarily at any time, hold
down the Command/Ctrl key. If you press Command-
Control (Mac) or hold down Ctrl and right-click (Win-
dows), no matter what tool you’re using, Photoshop
presents the pop-up menu.
Grouping Layers
Have you ever had a complicated images with dozens of
layers? If so, you’re probably familiar with the agony of
fumbling through an endless sea of layers to fi nd the right
one. You’ll be ecstatic to learn that you can group layers
together. A group of layers looks like a folder in the Layers
panel. You can view all the layers in the group or just the
group name.
To group multiple layers, select the layers and then either
Shift-click the folder icon at the bottom of the Layers panel
or choose Layer > Group Layers. You can also click the
folder icon (without holding down any keys) to create an
empty folder. You can move any number of layers into the
folder by dragging and dropping them onto the folder. The
folder will have a small triangle just to its left that allows
you to collapse the group down to its name or expand the
group to show all the layers it contains (Figures 3.42 and
3.43). You can even drag one folder onto another to create
a hierarchy of up to fi ve levels of folders). This approach
can greatly simplify the Layers panel, making a document
of 100+ layers look as if it’s made of only a few layers.
Figure 3.42 A typical project can
have a full Layers panel.
Figure 3.43 By grouping layers,
you can stay organized.
112
Chapter 3 Layers and Curves
Option/Alt-clicking the arrow next to a group expands
or collapses all the groups and layer style lists within that
group. Adding the Command/Ctrl key expands or col-
lapses all the groups in the entire document.
Groups can also be useful when you want to reorganize
the layers in an image. If one of the layers within a group
is active, using the Move tool affects only that layer (unless
it’s linked to other layers). If the group is active, using the
Move tool moves all the layers within that group.
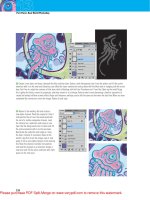
Smart Guides
When you choose View > Show > Smart Guides, Photoshop
displays pink guides to indicate how the active layer aligns
with the surrounding layers. These Smart Guides appear
only when you’re actively dragging a layer. Smart Guides
pay attention to the top, bottom, left, right, and center of
each layer, and extend the pink guides across all the layers
that are aligned. The layers also snap to these alignment
points, making it especially easy to get your layers in align-
ment. You can toggle the snapping behavior off or on by
choosing View > Snap To > Layers.
Smart Guides ignore layer styles that are applied to a layer.
In Figure 3.44, the outer ring of each object was created
using the Stroke and Bevel & Emboss layer styles, so it
wasn’t used when determining where the edge of the layer
is located. The Smart Guides also ignore any areas that have
an opacity of less than 50%, which also affects any layers
that have soft edges, causing the snapping behavior to treat
the halfway point of the fadeout as the edge of the layer.
To get rid of a group without throw-
ing away the layers that are inside
it, click the group to make it active,
click the Trash icon at the bottom of
the Layers panel, and then choose
Group Only when prompted.
Figure 3.44 Smart Guides help you
to align images and graphics as you
move them.
113
II: Production Essentials
Figure 3.45 Panel options for the Layers panel are
found by clicking the side menu button.
Figure 3.46 You can choose larger or smaller thumbnails for the
Layers panel—or none at all.
Hiding Layer Thumbnails
If you’ve organized an image into layer groups, but the
Layers panel is still a mess, you might want to simplify
the way Photoshop displays layers. Choose Panel Options
from the side menu of the Layers panel and click None in
the Thumbnail Size section of the dialog to turn off the
layer thumbnails. Once you’ve done that, the list of layers
takes up a lot less space, but you still have the full func-
tionality of all of Photoshop’s features (Figures 3.45 and
3.46). This feature also speeds up the screen redraw of the
Layers panel.
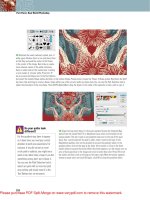
Displaying Layer Bounds
If you have many small elements on individual layers, the
Layers panel might look like a sea of checkerboard. Photo-
shop allows you to crop the layer thumbnails so that they
show the contents of a layer while ignoring any empty area
surrounding the content. To get to this view, choose Panel
Options from the side menu of the Layers panel and turn
on the Layer Bounds setting (Figure 3.47).
Figure 3.47 Select Layer Bounds in
the Thumbnail Contents section to
remove transparent areas from your
thumbnails.
114
Chapter 3 Layers and Curves
Color-Coding Layers
If you work within a large group of Photoshop users, it can
be useful to assign colors to layers to indicate their current
status. Maybe some text needs to be proofed, or the client
approved a certain part of the image, or an area needs
to be sent off for color correction. All you have to do is
Control/right-click the name of a layer and choose Layer
Properties. In the resulting dialog, you can color-code a
layer or a group (Figure 3.48). Even easier, Control/right-
click the Eyeball column to bring up color choices for that
layer or group.
Figure 3.54 Change the color of a selected layer to help stay
organized.
Merging Layers
When you create a complicated image containing dozens
of layers, the project can start hogging memory, which in
turn makes it diffi cult to manage all the layers. Every time
you create a new layer and add something to it, Photoshop
gobbles up more memory. Photoshop not only has to
remember what’s on that layer, but what’s below it (even if
that information is completely covered by the information
on the layers above).
Whenever possible, try to simplify your images by merging
layers. This action combines the layers into a single layer,
which saves memory. The Layer menu and the side menu
on the Layers panel provide several ways to merge layers:
. Merge Down: Merges the active layer into the layer
directly below it.
. Merge Visible: Merges all the layers that are currently
visible in the main image window.
. Merge Layers: Merges all the selected layers.
. Merge Group: Merges all the layers that are within the
active group.
115
II: Production Essentials
. Flatten Image: Merges all visible layers into the Back-
ground image, discards hidden layers, and fi lls empty
areas with white.
If you want to know how much extra memory the layers
take as you’re modifying an image, choose Document
Sizes from the menu that appears at the bottom center
of the document (Figure 3.49). The number on the left
should stay relatively constant (unless you scale or crop the
image); it indicates how much memory the image would
use if all the layers were merged. The number on the right
indicates how much memory the image is using with all
the layers included. This number changes as you add and
modify layers. Keep an eye on it so that you can see how
memory-intensive the different layers are.
Figure 3.49 View the document’s memory usage at
the bottom of the document window.
The number on the right might get huge if you’re using a
lot of layers; however, keep in mind that by glancing at the
left number you’ll know exactly how large the image will
be when you fl atten the layers.
Layers play such a huge role in Photoshop that to deny
yourself any crucial information about them is asking for
trouble. With every new release, Adobe likes to pack more
and more functions into the Layers panel. So, as time goes
on, understanding layers will become even more essential.
You should feel comfortable with them before you move
on to more advanced areas of Photoshop.
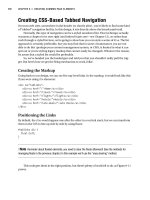
The Power of Curves
Curves can be used for just about anything; in fact, it’s
probably the one adjustment tool you should use all the
time. By mastering the Curves dialog, you’ll have more
control over your images than you thought possible. We’re
not talking about a simple bell curve here, but rather a
robust adjustment system that can make ordinary images
look extraordinary.
Once you’ve merged two layers, it’s
awfully hard to get them apart—
the only way to do so is to use the
History panel. However, even with
the History panel, you might lose all
the changes you’ve made since you
merged the layers.
116
Chapter 3 Layers and Curves
Let’s consider some of the things you can do with the
Curves dialog:
. Use the Sharpening fi lters to pull out far more detail
than you can see (Figures 3.50 to 3.52).
. Lighten or darken areas without making selections
(Figures 3.53 and 3.54).
. Turn ordinary text into extraordinary text (Figures
3.55 and 3.56).
. Enhance color and contrast in seconds (Figures 3.57
and 3.58).
Figure 3.50 An ordinary image can
be improved with the help of Curves.
(©2008 Dan Ablan.)
Figure 3.51 Making an image sharper
with Curves.
Figure 3.52 Curves can make
colors pop.
Figure 3.53 An ordinary image, some-
what flat. (©2008 Dan Ablan.)
Figure 3.54 With the help of Curves,
the image from Figure 3.53 has areas
darkened and lightened.
117
II: Production Essentials
Figure 3.55 Original text with some layer styles applied. Figure 3.56 The text from Figure 3.55 after a simple Curves
adjustment.
Figure 3.57 The original image. (©2008 Dan Ablan.) Figure 3.58 The image from Figure 3.57 after simple Curves
adjustments.
118
Chapter 3 Layers and Curves
None of these changes could be made by using Levels or
Brightness/Contrast (that is, not without making compli-
cated selections or losing control over the result). Now you
can see why you’ll want to master Curves!
Using Curves, you can perform all the adjustments avail-
able in the Levels, Brightness/Contrast, and Threshold
dialogs—and much, much more. In fact, you can adjust
each of the 256 shades of gray in your image indepen-
dently (Figure 3.59).
Figure 3.59 Photoshop’s adjustment hierarchy.
The Concept of Curves
Before we delve deeply into Curves, let’s test your present
knowledge of the Curves dialog. (The lower your score, the
more you should enjoy this section.)
All the techniques mentioned
in this chapter apply equally to
images prepared for Web pages and
those prepared for print. You might
notice that we concentrate on ink
settings throughout this chapter.
Most users are more comfortable
thinking about the effect of ink on
an image, rather than the effect of
light. Ink is the exact opposite of
light, so Photoshop can easily trans-
late what you’re attempting to do,
even if your image will be displayed
using light.
119
II: Production Essentials
Look at the curve shown in Figure 3.60 and see if you can
answer the following questions:
. Which shades will lose detail from this adjustment?
. Which shades will become brighter?
. What happened to 62% gray?
. What happened to the image’s contrast?
If you truly understand the Curves dialog, these questions
should be extremely easy to answer. However, if you hesi-
tated before answering any of them or couldn’t answer at
all, this section was designed for you.
Because the Curves dialog allows you to adjust every shade
of gray in an image independently of the others (256 in
all), it works quite a bit differently from the other adjust-
ment tools. To get a clearer picture of what Curves does,
let’s construct our own Curves dialog from scratch, using
something that’s already familiar: a stylish bar graph (also
called a bar chart).
Suppose you create a bar graph that indicates how much
light your monitor uses to display each color in an image.
This graph would be just like any other that you’ve seen,
where taller bars mean more light and shorter bars mean
less. You could show the shade of gray you’re using below
each bar, and then draw a line from the top of each bar
over to the left so you could label how much light is being
used for each shade. You’d end up with something that
looks like Figure 3.61. Or you could just as easily change
the graph to indicate how much ink your inkjet printer
would use to reproduce the image. Now that we’re talking
about ink, short bars would mean less ink, which would
produce a light shade of gray, and tall bars would mean
a lot of ink and would produce a dark shade of gray. To
make the change, all we’d have to do is fl ip all the shades
at the bottom of the graph so the dark ones are below the
tall bars and the bright ones are below the short bars. The
result would look like Figure 3.62, right?
Now that you’ve got the concept, let’s expand on it to
accommodate the real world. Our basic bar graph might
work for a simple logo with just a few shades of gray (one
Figure 3.60 Can you figure out what
this curve adjustment will do to an
image?
Figure 3.61 This bar graph indicates
the amount of light used to display
the shades of gray shown at the
bottom.
Figure 3.62 Flip the shades at the
bottom, and you have a graph that
represents ink usage.
120
Chapter 3 Layers and Curves
bar representing each shade), but most of your images will
contain many more shades. So, we just increase the num-
ber of bars (Figure 3.63), right? Well, sort of. The image
can contain up to 256 shades of gray. But if we jam 256
bars (one for each shade) into the graph, they won’t look
like bars anymore; they’ll just turn into a big mass (Figure
3.64). You can’t see the individual bars because there’s no
space between them.
All the same, images contain up to 256 shades of gray,
so we really need that many bars in our graph. Now that
they’re all smashed together, we don’t have room to label
each bar, so why don’t we just overlay a grid (Figure 3.65)
and label that instead? If that grid isn’t detailed enough
for you, we could add a more detailed grid, such as the one
shown in Figure 3.66.
Figure 3.63 Add more bars for addi-
tional accuracy.
Figure 3.65 A grid can help you to
figure out how much ink is used.
Figure 3.64 The 256 bars take up so
much space that the result no longer
looks like a bar graph.
Figure 3.66 A more detailed grid
allows you to be even more accurate.
121
II: Production Essentials
The sample graph we’ve created isn’t really all that
useful—yet. It’s not telling you anything you can’t fi nd
in the Info or Color panels. For example, if you really
want to know how much ink (or light) you’d use to
reproduce a shade of gray, you could just open the Info
panel by choosing Window > Info (Figure 3.67), and then
move your pointer over the image; the Info panel would
indicate how much ink would be used in that area. The
Color panel (Window > Color) is set up similarly and
will indicate how much ink or light makes up a shade
of gray (Figure 3.68). The main difference between the
two methods is that the Info panel gives you information
about your image—specifi cally, what’s under the pointer.
The Color panel isn’t image-specifi c but gives you generic
information about how much ink or light makes up a
shade of gray.
Think of the Curves dialog as just a simple bar graph—
with a lot of bars that are very close together—showing
how much ink or light will be used in the image. The
gradient at the bottom shows all the shades of gray you
could possibly have, and the graph above shows how much
ink or light will be used to create each shade. But the
wonderful thing about the Curves dialog is that it doesn’t
just sit there like a static bar graph that only gives infor-
mation. Curves is interactive—you can use it to change
the amount of ink (or light) used to reproduce the image
(Figure 3.69).
Think of our ink usage bar graph: As the shades of gray
get steadily darker, each shade uses slightly more ink,
resulting in a straight diagonal line. But in the Curves
graph, you can move points on the line. For example, you
can fl atten the line so that, in the modifi ed image, many
shades of gray are represented by a single shade. Or you
can make a dramatic change to the line, dragging a point
up or down so that a shade changes to become much
darker or lighter.
Figure 3.67 The info panel indicates
how much ink or light would be used
to reproduce the color under the
pointer.
Figure 3.68 The Color panel indicates
how much ink would be used to
reproduce the current foreground
color.
Figure 3.69 Changing the shape of
the line in the Curves graph changes
how much ink is used throughout the
image.
122
Chapter 3 Layers and Curves
Let Gradients Be Your Guide
Pick any shade of gray from the gradient, and then look
above it to fi gure out how much ink would be used to
create it (Figure 3.70). You can use the grid to help you
calculate the exact amount of ink used (about 23% in
this case). But wouldn’t you rather see what 23% looks
like? Suppose we replace those percentage numbers with
another gradient that shows how bright each area would
be (Figure 3.71). Just to make sure that you don’t con-
fuse the two gradients, read the next two sentences twice:
The bottom gradient represents the shades of gray you’re
changing. The side gradient indicates how bright or dark a
shade will become if you move the line to a certain height
(Figure 3.72).
Figure 3.70 Use the grid to help
determine how much ink is used in
an area.
Figure 3.71 The gradient on the
left indicates how dark an area will
become if the curve is moved to a
certain height.
Figure 3.72 The bottom gradient
scale is what you’re changing. The
left gradient scale shows how you
changed it.
Now you’re ready to graduate from graphs and take fl ight
with the full-fl edged Curves dialog (Figure 3.73). Does
it look familiar? It should. Along the bottom a grayscale
ramp shows all of the original gray tones in the image, and
running vertically along the side is a grayscale ramp show-
ing what each point on the curve will become after you
click OK.
The “curve” is the diagonal line that runs from lower left
to upper right. When you fi rst open the Curves dialog,
the curve is not curvy. As you’ve seen, the curve indicates
Figure 3.73 Photoshop CS4’s Curves
dialog.
123
II: Production Essentials
a correspondence between the original gray tones on the
bottom and the new gray tones on the side. When the
curve is a straight diagonal, all output tones are identical
to the input tones.
Starting with Photoshop CS3, Adobe added a grayed-out
histogram display behind the actual curve. This feature
makes it easier to determine which part of the curve cor-
responds to specifi c tonal regions within the image. It also
makes it easier to remember that you read the curve from
black on the left to white on the right.
Color Modes and Curves
To create the bar graph, we started by measuring how
much light the monitor was using. Then we measured how
much ink we’d use for printing. You can make the same
change in the Curves dialog. If you click the Curve Display
Options button, the Curves dialog displays additional con-
trols (Figure 3.74).
The Show Amount Of setting has two radio buttons, one
for light and the other for pigment/ink percentage. You
can click either of these options to determine whether the
curve reads from light to dark or dark to light. The gray-
scale ramps will reverse, just as in our bar graphs (Figures
3.75 and 3.76).
Figure 3.75 When black is at the
top, you’re using ink. (Remember, up
means more.)
Figure 3.76 When white is at the top,
you’re using light. Again, up is more.
Figure 3.74 Clicking the Curve Display
Options arrow displays additional
controls.
124
Chapter 3 Layers and Curves
The mode of your image determines where you’ll start.
Photoshop assumes that images in grayscale, CMYK, or
LAB mode will be printed, and defaults to using the gradi-
ent that represents ink. Because your monitor displays
everything using red, green, and blue light, images in RGB
mode use the gradient that represents light.
Photoshop doesn’t care which system you use. It can easily
translate between the two, because light is the exact oppo-
site of ink. When you switch from one scale to the other,
not only do the light and dark ends of the gradients get
swapped, but the curve fl ips upside down. Be sure to look
out for which mode is used throughout the examples in
this chapter; otherwise, your result could be the opposite
of what you had in mind.
Remember, the side gradient indicates what you’ll get if
you move a point on the curve to a certain height. You can
always glance at the side to fi nd out how much light or ink
you’re using. Just remember that up means more of some-
thing, and that you can use either light or ink.
Next comes the grid. Remember how we ended up with
one that’s more detailed than the original? You can toggle
between those two grids by Option/Alt-clicking anywhere
within the grid area. It doesn’t affect the result you’ll get
in Curves; it’s just a personal preference (Figure 3.77). You
can also change grids by clicking the grid icons that appear
when you open the Curve Display Options.
Figure 3.77 Option/Alt-click anywhere on the grid to toggle between a 25%
increment grid (left) and a 10% increment grid (right)
125
II: Production Essentials
Taking Curves for a Test Drive
Hopefully you now have a better understanding of how the
Curves dialog works. So let’s try it out—open an image,
choose Image > Adjustments > Curves or press Command/
Ctrl-M, and start messing with the curve. Click anywhere
on the curve to add a point, and then drag it around to
change the shape of the curve. If you want to get rid of a
point, drag it off the edge of the grid. You can also click
a point and then use the arrow keys on your keyboard to
nudge it around the grid. You can even add the Shift key to
the arrow keys to nudge in larger increments.
When you drag, Photoshop displays a set of light gray
crosshairs to help you see exactly how the bottom gray-
scale ramp corresponds to the left ramp. If these cross-
hairs are distracting, turn off the Intersection Line check
box in the Curve Display Options.
Photoshop also leaves a light gray baseline (a copy of the
original fl at curve), so that you can see exactly how much
your new curve deviates from the original (Figure 3.78).
As with the intersection lines, if you prefer working with
a “clean” display, turn off the Baseline check box in the
Curve Display Options.
You should quickly fi nd that it’s pretty easy to screw up
your image when you mess around with Curves. That’s
because we haven’t yet talked about specifi c types of adjust-
ments. Let’s explore that fi nal piece of the Curves puzzle.
Improving Dark Images
Try this: Open any grayscale image that you think is too
dark, like the one shown in Figure 3.79. Next, choose
Image > Adjustments > Curves and add a point by clicking
the middle of the line. Pull the line straight down and see
what happens to the image (Figure 3.80). Compare the
curve with the gradient at the left of the Curves dialog.
The farther you move the curve down, the less ink you use,
and therefore the brighter the image becomes. If part of
the curve bottoms out, the shade represented by that area
becomes pure white because no ink will be used when the
Hold down Option/Alt when choos-
ing Image > Adjustments > Curves
to reapply the last settings used on
an image.
Figure 3.78 The light gray baseline
represents the original line.
You can compare the original and
changed versions of the image by
selecting or deselecting the Preview
check box. As long as the check box
is turned off, you’ll see what the
image looked like before the adjust-
ment. When you click it on, you’ll
see the changes you just made.
126
Chapter 3 Layers and Curves
image is printed. (Because this is a grayscale image, the
Curves dialog is using the ink percentage scale, not light,
so dragging down means lighter.)
Figure 3.79 Start with a dark grayscale
image. (©2008 Dan Ablan.)
Figure 3.80 Move the curve down to
reduce how much ink is used.
Any part of a curve that’s below the original line indicates
an area that’s using less ink, which means that it has been
brightened. Look at the gradient directly below those areas
to determine which shades of the image were brightened
(Figure 3.81). The farther the line is moved down from
its original position, the brighter the image will become
(Figure 3.82).
Increasing Contrast and Detail
So far, you’ve learned that moving the curve up or down
increases or decreases the amount of ink or light used to
make the image. Now let’s look at how changing the angle
of the curve can help your images. What if you have an
image where the brightest area is white and the darkest
area is only 25% gray? Would it be easy to see the detail in
the image? Probably not (Figure 3.83).
Figure 3.81 Comparing the Curve
with the gradients.
Figure 3.82 To figure out how much
ink you’ve removed, look below where
the line used to be.
127
II: Production Essentials
Figure 3.83 You can’t
see much detail in
this image because
the brightness
is limited to 0–25%.
(©2008 Dan Ablan.)
Now think about how that image would change if we
applied the curve shown in Figure 3.84. If you look closely
at this curve, you’ll notice that areas that are white in the
original image wouldn’t change at all and areas that used
to be 25% gray would end up being around 75% gray.
Wouldn’t that make it much easier to see the detail in
the whole image? In an overexposed image like this one,
you have to make the curve steeper in the lighter part of
the curve. (You already learned that in an underexposed
image—refer to Figure 3.79—you have to make the dark
part of the curve steeper to bring out the detail.) You
always have to compare the curve with the original line
to determine how much of a change you’ve made. If you
make the curve just a little steeper than the original, you’ll
add just a little contrast to that area. Anytime you add
contrast, it becomes easier to see the detail in that area
because the difference between the bright and dark parts
becomes more pronounced (Figure 3.85). Remember to
look at the gradient below the graph to fi gure out which
shades of gray you’re changing.
Figure 3.85 After
making the curve
steep, it’s easier to
see the image detail.
Figure 3.84 This curve adds more
contrast, making it easier to see the
detail in the whole image.
128
Chapter 3 Layers and Curves
Figure 3.86 The original image.
(©2008 Dan Ablan.)
Figure 3.87 Find the range you’d like
the change; then move the curve
steeper. In this case, the sky is to be
darkened.
Figure 3.88 The image from Figure
3.86 after making the curve steeper.
Now try this. Open any image and choose Image >
Adjustments > Curves. Move your pointer over the image,
and then click and drag across the area where you want
to exaggerate the detail. A circle appears in the Curves
dialog. Photoshop is simply looking at the bottom gradient
to fi nd the shade of gray under your pointer; it then puts
a circle on the curve directly above that shade. This circle
indicates the area of the curve that needs to be changed to
affect the area across which you’re dragging. Add control
points by clicking either side of this area of the curve.
Next, move the top point you just added up toward the top
of the graph, and move the bottom point down toward the
bottom of the graph. The area you dragged across should
appear to have more contrast (Figures 3.86 to 3.88). As
contrast improves in an image, you should be able to see
more details.
You might also need to fi x the rest of the curve to make
sure that the contrast in those areas doesn’t change radi-
cally. You can do this by adding another point and moving
it so that the majority of the curve looks normal—that is,
diagonal (Figure 3.89).
Decreasing Contrast and Detail
Any part of the curve that’s fl atter (more horizontal) than
the original line indicates an area where the contrast has
been reduced (shades of gray become more similar). Look
at the gradient directly below these areas to determine
Clicking a CMYK image won’t
display a circle. That’s because the
circle’s location is calculated by
averaging the numbers that make
up an area, and black ink throws
off the calculation because it’s
used only in the darkest areas of
an image.
Figure 3.89 Adjust the rest of the
curve so that contrast is not too exag-
gerated in other areas of the image.
129
II: Production Essentials
which shades of the image were changed. The fl atter the
line becomes, the less contrast you’ll see in that area of
the image. When you lower the amount of contrast in an
image, it becomes harder to see detail. This can be useful
if you want detail to be less visible. If the curve becomes
completely horizontal in an area, you’ve lost all detail
there (Figures 3.90 to 3.92). Remember, the curve is a bar
graph—the same height means the same brightness.
Figure 3.90 The original image.
(©2008 Dan Ablan.)
Figure 3.91 Curves used to adjust
strong contrast.
Figure 3.92 The result of using Curves
to reduce apparent contrast in the
image from Figure 3.90.
Analyzing a Curve
Have you ever heard the tip, “Make an S curve”? Let’s
explore exactly what an S curve does (Figure 3.93).
Figure 3.93 A typical S curve.
You can reset the Curves dialog to
the default line by holding down
Option/Alt and clicking the Reset
button. The Cancel button turns
into a Reset button when you hold
down the proper key.
130
Chapter 3 Layers and Curves
Remember, to fi nd out what a curve is doing to your
image, you should compare the curve with the original
line. Look at the areas of the curve that are steeper than
the original line—in this case, the middle of the curve.
The shades represented by these steeper areas will appear
to have more detail. Whenever you pull detail out of one
part of an image, however, you’ll also lose detail in another
part. Therefore, look at either end of the curve, at the
areas of the curve that are fl atter than the original line
(more horizontal). These areas appear to have less detail.
Thus, an S curve attempts to exaggerate detail in the
middle grays of the image. However, it also gives you less
detail in the highlights and shadows.
Checking Ink Ranges
Look at Figure 3.94, paying particular attention to the
gradient on the left side of the Curves dialog. As you know,
this gradient indicates how dark an area will become if
you move the curve to a particular height. Pick a shade of
gray from that gradient (such as 90%); then look directly
to the right of it to determine if you’ll have any areas that
shade of gray. Pick another shade and do the same thing.
If the curve starts in the lower-left corner and ends in the
upper-right corner, each one of the shades should be used
somewhere in the image. However, a few shades might be
used in more than one area of the curve. The adjustment
shown in Figure 3.94 is analogous to using the Output slid-
ers in the Levels dialog. What really helps set these values
is the Input and Output readings within the dialog. You’ll
read more about this in just a few pages.
Inverting an Image
Think of Curves like a stock market graph. As long as the
curve is rising, you’re fi ne; however, if the curve starts to
fall, you should expect unusual results. Look at Figure 3.95
and try to fi gure out what’s happening in the area that’s
going downhill. The dark areas of the image (around
75%) became bright, and the bright areas (around 25%)
Figure 3.94 After this adjustment, this
image won’t contain any areas darker
than 90% or brighter than 18%.