Wireless địa phương vòng - lý thuyết và ứng dụng P7 pps
Bạn đang xem bản rút gọn của tài liệu. Xem và tải ngay bản đầy đủ của tài liệu tại đây (153.14 KB, 21 trang )
7
Traffic Considerations in
Comparing Access Techniques
for WLL
Stefan Mangold, Ingo Forkel, Roger Easo and Bernhard Walke
7.1 Introduction
The focus of interest is the multiple access technology that will be employed in Wireless
Local Loop (WLL) systems, here referred to as Fixed Wireless Access (FWA) networks.
The discussion of whether to employ Code Division Multiple Access (CDMA) or Time
Division Multiple Access (TDMA) has gone on for a long time with no result to be
expected in the near future. In this chapter, a capacity comparison for FWA based on
two access technologies is performed. The TDMA system is analysed with the help of
a simulator in chapter by S. V. Krishnamurthy et al. [8]. With this approach it is possible
to adjust different scenarios and system parameters in order to find the best capacity
utilization of the system. The CDMA system is investigated analytically in this chapter. It
is clear that in performing an analytical calculation certain simplifications and assump-
tions will need to be made.
The structure of this chapter is as follows.
In the next section the FWA network is explained in more detail. Apart from the
technological description of this access scheme, the section will also examine the economic
viability. The impact of the FWA network in developed and developing countries is
investigated and a prognosis is made on the future market possibilities of FWA networks.
Following is a brief overview of multiple access schemes.
A derivation for capacity equations of a CDMA system is contained in the following
section. An analysis is performed for a single cell scenario offering only one service class.
The approach is then adopted for a single radio cell with multiple service classes and
finally for a multiple radio cell environment with multiple service classes.
A comparison of the capacity result for TDMA and CDMA is presented at the end of
this chapter. It is shown how the expected capacity for both technologies can be esti-
mated.
141
Wireless Local Loops: Theory and Applications, Peter Stavroulakis
Copyright # 2001 John Wiley & Sons Ltd
ISBNs: 0±471±49846±7 (Hardback); 0±470±84187±7 (Electronic)
7.2 Fixed Wireless Access Networks
The accessing of telecommunication services such as telephone, fax and Internet is taken
for granted in the developed countries [6,11]. It is therefore surprising to note that the
world average teledensity (number of telephone lines per hundred people) is less than
10 %. In fact, almost half of the world's population has never made a phone call. The
demand for communication is driven not only by business alliances and exchanges but
also through personal relations like friends and relatives that live around the globe. This
revolution in communication requirement is abetted by three major forces. Computing
power increases while the costs of providing this power are reduced through economies of
scale. Secondly the cost of providing transmission of information has fallen by a factor of
10 000 over the last 20 years. Finally the convergence of telecommunications and comput-
ing have pushed the merging of segmented industries into a large information industry.
The world information technology market which includes products such as personal
computers, mobile phones, and communication has grown by 12.2 % between 1985 and
1995. This is a growth five times faster than the average world Gross Domestic Product
(GDP) [19].
It is without a doubt established that delivering telecommunication is akin to delivering
knowledge. For developing countries delivering knowledge can mean fighting illiteracy
and poverty. Therefore, especially these countries need to increase their teledensity. The
International Telecommunications Union (ITU) recommends that the teledensity of a
nation should be at least 20 % so that economic growth is not hampered by the lack of
telecommunications.
Wireless access systems provide a suitable method of providing this access to telecom-
munication services. Currently wireless telephony is experiencing a tremendous growth for
the last 10 years with the number of subscribers globally estimated at 55 million people
until mid 1995 [7]. Most of this usage is for mobile communications.
The prediction of which access technique will have the greatest impact must be based on
the current tariff ideology. The tariff structure of telephone calls does not provide re-
semblance to the real cost involved. The highest costs are incurred in the local loop and is
proportional to the distance of the subscriber to the distribution point. This would mean
that a call coming from a rural area should be more expensive than an urban call. Further,
an international call should be only nominally more expensive than a local call. These
facts are not reflected in the current tariffs. This is partly due to the monopolistic history
of most Public Telephony Operators (PTO). Being regulated by the national governments,
the PTO had the obligation of offering each citizen a connection at a universal price.
The advent of Internet telephony will break the current tariff structure. Allowing
Internet users to perform international calls at the local call rate. This application is a
true reflection of the actual situation. Since operators inflate the cost of international calls
to reduce the loss made on subsidising the local loop, popular Internet telephony will
make its impact. The result will be a restructuring of the tariff system. This so-called voice
over Internet Protocol (IP) is not expected to last very long as the Internet will be flooded
with voice and data movement.
The economic impact of FWA networks will largely depend upon the success of Digital
Subscriber Line (xDSL) technologies. These so-called `killer' technologies have the possib-
ility of rendering all other access techniques obsolete. However, the penetration of xDSL is
questionable as some figures state that only 30 % of all telephone lines can be utilized for
142 Traffic Considerations in Comparing Access Techniques for WLL
xDSL. Another problem of xDSL is that the lines are owned by the PTO. There is a certain
amount of control which a private operator must relinquish when renting a line from the
PTO. It might be that xDSL will need another five years for a breakthrough in the local loop.
However, the success of xDSL will be crucial for the existence of other access technologies.
Despite the generous forecasts that were made for FWA networks, some predictions
were 170 million subscribers by the year 2000, the impact of this technology has been
slow. For 1998, the subscriber count is at best a few million (some say just 1 million).
Companies offering FWA networks in the market have even seen considerable drop-
ping of share value. This is a surprising since wireless access does have a considerable cost
advantage over all the other technologies [17]. However, the introduction of FWA is very
expensive if a wired solution is present. Further, the operation of FWA networks gen-
erally require the acquirement of two licenses, one enabling the offer of telecommunica-
tion services and the other the use of the radio spectrum. The allocation of radio spectrum
is also a problem. To be able to offer high transmission bit rates, sufficient bandwidth
must be allocated. In some cases this allocation has been too low.
Another deciding factor apart from cost will be the subscriber's demand for high-
bandwidth services. Test carried out with Video on Demand (VoD) and home shopping
do not reflect heavy user interest. This is different, however, for teleworkers and business
users who need to work with the company network at comparable Local Area Network
(LAN) schemes.
In summary, it can be said that FWA networks will be a very viable technology for
developing countries and Eastern Europe. The higher risk is clearly bound with the
deployment in the developed countries.
7.3 Multiple Access Technologies
Presented in this section is a brief description of the two major access technologies for
wireless networks. The communication medium for a radio system is a commonly shared
radio channel. Considering the uplink, the link from the Radio Network Terminals (RNT) to
the Radio Base Station (RBS) the system can be classified as a MultiPoint-to-Point (MPP)
system. With multiple access technology it is possible for several users to send their signals
over the radio channel which are then ultimately detected at a corresponding receiver.
For the sake of completeness the Frequency Division Multiple Access (FDMA) method
should be mentioned but is not explained in more detail. For a general overview it can be
referred to B. Walke [16].
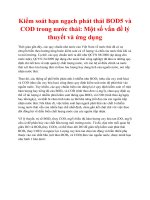
7.3.1 Time Division Multiple Access
With TDMA the radio resource is divided in the time domain into time slots. The time slots
are assigned to users either in a cyclic fashion or upon demand. Within this time slot an
exclusive user is able to transmit across the medium. To avoid collisions the system must be
synchronized and additionally a guard time is inserted between slots. No other conversa-
tions can access an occupied TDMA channel until the channel is vacated. TDMA is a
software intensive protocol so the gathering of results is possible by means of simulations.
Figure 7.1 illustrates the basic principle of TDMA with the alternating transmission
and guard periods.
Multiple Access Technologies 143
Frequency
Time
Guard time
Guard time
Guard time
Slot 1 Slot 2 Slot 3 Slot 4
Figure 7.1 TDMA (Walke, 1999)
TDMA is a common multiple access technique employed in digital cellular systems. Its
standards include North American Digital Cellular, Global System for Mobile Commu-
nications (GSM), and Personal Digital Cellular (PDC).
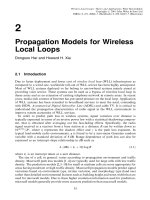
7.3.2 Code Division Multiple Access
CDMA is a form of spread-spectrum, an advanced digital wireless transmission tech-
nique. Instead of using frequencies or time slots, as do traditional technologies, it uses
mathematical codes to transmit and distinguish between multiple wireless conversations
[10]. Its bandwidth is much wider than that required for simple point-to-point commu-
nications at the same data rate because it uses noise-like carrier waves to spread the
information contained in a signal of interest over a much greater bandwidth. However,
because the conversations taking place are distinguished by digital codes, many users can
share the same bandwidth simultaneously, as seen in Figure 7.2.
Although not shown, it is possible for a user to use more than one code, as is foreseen
for third-generation mobile systems. The advanced methods used in commercial CDMA
technology improve capacity, coverage and voice quality, leading to a new generation of
wireless networks.
7.3.3 Interference in Multiple Access Systems
A multiple access scheme must warrant that a user can access the radio channel without
causing interference to the other users. If interference is caused, it is then known as Multiple
Access Interference (MAI), interference caused by the multiple accession to the radio chan-
nel. In the presence of MAI the data symbols of the different users interfere with each other.
144 Traffic Considerations in Comparing Access Techniques for WLL
User N
User 1
User 2
Frequency
Time
Code
Figure 7.2 CDMA (Rappaport, 1996)
If there is multipath propagation on the channel, then the symbols in the signal of a
single user cause interference upon each other, leading to Inter-Symbol Interference (ISI).
ISI takes place if the symbol duration is less than the time dispersion on the channel,
a phenomenon which can take place if the transmission bit rate is very high. Both MAI
and ISI can be grouped together and classified as intra-cell interference, the interference
present in a radio cell. A radio cell in a multicellular environment additionally experi-
ences interference caused by the transmitting stations in neighbouring radio cells. This
interference is known as inter-cell interference.
7.4 CDMA Capacity Analysis
Presented here is an analytical method to determine the capacity of a multiclass multi-
cellular spread sequence (CDMA) systems based on an approach by S. J. Lee et al. [9]. The
basis of the method assumes an a-priori E
b
=I
0
level which must be maintained to assure a
satisfactory performance with respect to the Bit Error Ratio (BER) for a desired service
class. Capacity is defined here as the number of simultaneous connections that can be
admitted into the system for a particular service class so that the quality constraint can
still be guaranteed. The capacity analysis is carried out for the reverse link (RNT to RBS
uplink) since this link is considered to be critical for a CDMA system [8].
7.4.1 CDMA Traffic Model
The aim of a broadband FWA network is to carry different types of service classes, each
requiring a different service bit rate. A survey conducted for integrated services on
CDMA Capacity Analysis 145
wireless multiple access networks has come up with a possible service performance for
these networks [12].
Bit-Energy to Interference Spectral Power The bit-energy to interference spectral power
denoted here as g E
b
=I
0
is the constraining factor for a CDMA system when allocating
capacity to a new connection. The term is mainly dependent on the maximum BER the
service can sustain and the modulation type selected for the transmission.
Spreading Gain The spreading gain G (equalling the spreading factor in a CDMA
system) depends on the service bit rate, the transmission bandwidth and the multirate
transmission technology. For the Single-Code (SC) technology there are different values
of G since different bit rates are realized by different spreading of the data sequence.
Whereas for MultiCode (MC) technology there is only one spreading gain equal for all
codes used, but a number of codes can be multiplexed in order to offer the required
transmission bit rate.
Considering the service bit rates from Table 7.1 and the transmission bandwidth W
112 Mbit/s, a certain spreading gain G for the services could be assigned as proposed in
Table 7.2. The base transmission bit rate R
b
for MC-CDMA was chosen to be the lowest
service bit rate of the system, the bit rate for the voice calls. The spreading gain is the
quotient of transmission bandwidth to service bit rate.
7.4.2 Single-Class Services
This is the most common type of capacity analysis for a Direct Sequence CDMA (DS-
CDMA) system. Generally the service class under scrutiny are voice calls with a service bit
rate of 32 kbit/s. The resulting capacity equation derived here is of little importance for a
FWA network desired to work on a broadband system.
Table 7.1 Service classes for FWA networks
Service Maximum BER Delay Bit rate required g
Class 1 (voice) 10
À3
Sensitive 32 kbit=s 6.8 dB
Class 2 (Packet Data) 10
À4
Insensitive 64 kbit=s 7.0 dB
Class 3 (video) 10
À5
Sensitive 128 kbit=s 9.5 dB
Table 7.2 Spreading gains for different service classes
Service SC-CDMA MC-CDMA Bit rate
Class 1 (voice) G 3500 G 3500; 1 Code 32 kbit=s
Class 2 (Packet Data) G 1750 G 3500; 2 Code 64 kbit=s
Class 3 (video) G 875 G 3500; 4 Code 128 kbit=s
146 Traffic Considerations in Comparing Access Techniques for WLL
However, the approach and the trail of thought will be the same one for the pursuit of
capacity for a multiple service class system.
7.4.2.1 Single-Cell and Single-Class Capacity
The error rate of digital transmission systems only depends on the signal-to-noise ratio.
Respectively the Carrier to Interference Ratio (C/I) expressed by
C
I
intra
S
N
7:1
where S portrays the sending power reception level of a user signal at a receiver and
I
intra
is the total interference power experienced within a single cell (intra-cell inter-
ference).
Assume it is possible to construct a source where the sending signal spectrum is
constant between ÀW=2 f W=2 and disappears outside this interval. Let E
b
be
the energy per bit of this signal and the bit rate be R 1=T. The sending power is now
equal to E
b
R. The term N
0
in Equation (7.2) is the power density of the noise power N
resulting from the effects of thermal noise and spurious interference in the bandwidth. It
can be written that
E
b
S
R
and N
0
N
W
7:2
Now consider a system with n sources, each possessing the before described character-
istic. The ith receiver correlates the received signal with all the other n À 1 signals.
Assuming that the sending signal of all the other sources are uncorrelated, then the ith
receiver regards the other signals as uncorrelated white noise sources. Further, it is
assumed that the received power level of the different sources are all equal at the site of
the receiver (perfectly power controlled). This yields
E
b
I
intra
S
R
n À 1
S
W
W
R
n À 1
7:3
This equation can be modified to include noise effects [4]. These effects are contained in
the term N
0
found in Equation (7.2)
E
b
I
intra
N
0
S
R
n À 1
S
W
N
0
7:4
Extending Equation (7.4) with the term W/S and using the identity for N
0
from Equation
(7.2)
E
b
I
intra
N
0
W
R
n À 1
N
S
7:5
CDMA Capacity Analysis 147
Cancelling the denominator, Equation (7.5) can be rewritten as
E
b
I
0
E
b
I
intra
N
0
1
n À 1=
3
2
G
N
0
E
b
7:6
where I
0
is referred to as the interference power spectral density and G is the spreading
gain defined in the other place. The coefficient 3=2 results from the rectangular chip form
of the spreading code [3].
Using the definition G R
chip
=R whereby R
chip
is the chip rate of the spreading
sequence and modifying Equation (7.6) to remove the term E
b
the quality constraint for
a service finally becomes
E
b
I
0
S
R
n À 1S=
3
2
R
chip
N
0
7:7
Introducing the term g for the required bit energy to interference power spectral density
ratio E
b
=I
0
, the constraint for an acceptable connection (considering the BER as a
connection admission criterion) is
S
R
n À 1S=
3
2
R
chip
N
0
! g 7:8
Hence, the number of simultaneous accepted connections (also called capacity) in a
single cell offering only one service is equal to
n
3
2
G g
g
À
3
2
R
chip
N
0
S
7:9
7.4.3 MultiClass Services
The system is now be extended to include the transmission of different service classes.
These services can be voice calls, Internet services or data transmission for example.
In the system being analysed there are up to K service classes, each service class having
an information bit rate R
k
. For single-code transmission this bit rate is an integer multiple
of the line bit rate R. In the case of MC transmission, the high information bit rate of a
class k connection is defined by R
k
c
k
R. The term c
k
denotes the number of codes
needed for transmitting a class k connection [2].
Further, it is assumed that there are n
k
connections in each service class k. The
connection is linked to the RBS with the least path loss.
Using a similar line of thought as in Equation (7.7) the bit energy to interference power
spectral density ratio for the ith connection is modelled as
E
b
I
0
E
b
I
intra
N
0
7:10
The value E
b
=I
0
is the constraint value for the connection admission and is determined by
the modulation technique of the system and the BER which must be guaranteed for the
connection.
148 Traffic Considerations in Comparing Access Techniques for WLL
In the equations below S
i
denotes the received level of the signal power of the connection
to be accepted. Depending on the transmission scheme, R
i
is the ith terminal's service bit
rate for the SC system whereas R is the line rate of the MC system. The intra-cell interference
is no longer based on the uncorrelated disturber signals but rather on the interference caused
by the different connections with their corresponding received power levels.
E
b
I
0
SC
i
S
i
R
i
P
K
k1
n
k
S
k
À S
i
3
2
R
chip
N
0
7:11
E
b
I
0
MC
i
S
i
R
P
K
k1
c
k
n
k
S
k
À c
i
S
i
3
2
R
chip
N
0
7:12
It is apparent that c
k
in Equation (7.12) is the term for the number of codes necessary to
service one of the n
k
connections of service class k for an MC transmission scheme.
Similarly c
i
is the number of codes needed for the ith connection under consideration
for the analysis. The I
intra
term resulting from the existing connections is also known as
the Co-Channel Interference (CCI) of the cell.
E
b
I
0
E
b
CCI N
0
7:13
This basic interference limited model needs to be modified to include the effects of the
channel in which the spreading sequence is propagated. The behaviour of the channel is
modelled as a Wide Sense Stationary Uncorrelated Scattered (WSSUS) channel. The
multipath propagation induced in this channel leads to interference between the code
sequence symbols, hence known as ISI. The I
intra
is now the sum of both, ISI and CCI
E
b
I
0
E
b
CCI ISI N
0
7:14
Equations (7.11) and (7.12) are extended to consider ISI. This type of interference is
contained in the terms F G
i
or FG [9]. Additionally, a transmission coefficient u
2
describes the ratio of the primary received signal to the multipath signal of the considered
interfering links and acknowledge the effect of multipath propagation for these signal
components as well.
E
b
I
0
SC
i
S
i
R
i
X
K
k1
n
k
S
k
À S
i
!
Á
1 2u
2
3
2
R
chip
S
i
R
i
FG
i
N
0
7:15
E
b
I
0
MC
i
S
i
R
X
K
k1
c
k
n
k
S
k
À c
i
S
i
!
Á
1 2u
2
3
2
R
chip
S
i
R
FGN
0
7:16
CDMA Capacity Analysis 149
These equations are the basic frame work for the more complex investigation which will
follow.
7.4.3.1 Single-Cell and MultiClass Services Capacity
The aim of the capacity analysis is to determine the number of connections that can be
simultaneously admitted into the transmission system. The basic parameter for the con-
nection admission is the E
b
=I
0
value which is inherently determined by the service quality,
e.g. the BER required.
Recalling the identity E
b
=I
0
g and Equation (7.8), the quality constraint condition for
a connection i of a particular service class is
S
i
R
i
X
K
k1
n
k
S
k
À S
i
!
Á
1 2u
2
3
2
R
chip
S
i
R
i
FG
i
N
0
! g
i
j
SC
7:17
S
i
R
X
K
k1
c
k
n
k
S
k
À c
i
S
i
!
Á
1 2u
2
3
2
R
chip
S
i
R
FGN
0
! g
i
j
MC
7:18
Following simple algebra, these equations can be rewritten as
1 2u
2
3
2
G
i
1
g
i
À F G
i
1 2u
2
S
i
!
X
K
k1
n
k
S
k
3
2
N
0
R
chip
1 2u
2
SC
7:19
1 2u
2
c
i
3
2
G
1
g
i
À FG
1 2u
2
S
i
!
X
K
k1
c
k
n
k
S
k
3
2
N
0
R
chip
1 2u
2
MC
7:20
Equations of this form obey the following proposition:
a
i
S
i
!
X
K
k1
n
k
S
k
b exists if and only if
X
K
k1
1
1 À "
Á
n
k
a
k
1 7:21
when
" max
iPf1; ;K g
b
a
i
S
i
7:22
Applying this proposition for the SC calculations, Equation (7.19) yields
X
K
i1
1
1 À "
Á
1 2u
2
1 2u
2
3
2
G
i
1
g
i
À FG
i
n
i
1
SC
7:23
150 Traffic Considerations in Comparing Access Techniques for WLL
where
" max
iPf1; ;K g
1
1 2u
2
3
2
G
i
1
g
i
À FG
i
Á
3
2
N
0
R
chip
S
i
8
<
:
9
=
;
SC
7:24
Similarly, Equation (7.20) for the MC transmission will be transferred to
X
K
i1
1
1 À "
Á
1 2u
2
c
i
1 2u
2
c
i
3
2
G
1
g
i
À FG
n
i
1
MC
7:25
with its associated
" max
iPf1; ;K g
1
1 2u
2
c
i
3
2
G
1
g
i
À FG
Á
3
2
N
0
R
chip
S
i
8
<
:
9
=
;
MC
7:26
As can be seen, Equations (7.23) and (7.25) are in the form
X
K
k1
a
k
n
k
1 7:27
Recalling that n
k
is the number of existing connections of the service class k in the
system, the term a
k
becomes the bandwidth allocated to each connection of this service
class. More correctly, a
k
is the bandwidth allocated to a single connection of service class
k with k 1, , K normalized to the entire bandwidth W of the system. The inverse of
this term denotes the number of connections which can be allocated in the entire band-
width of the system for a predetermined quality E
b
=I
0
of the connection. Hence, it can
be written as
a
k
W
k
W
7:28
where W
k
is the bandwidth of the respective single connection of service class k. The
system capacity with respect to connections that can be established is then derived from
the inverse of a
k
like that the total number of connections of service class k which can be
carried by the system is 1=a
k
.
Comparing Equation (7.27) with Equation (7.23) the normalized bandwidth for SC
transmission systems is
a
i
j
SC
1
1 À "
Á
1 2u
2
1 2u
2
3
2
G
i
1
g
i
À FG
i
7:29
CDMA Capacity Analysis 151
The normalized bandwidth for MC transmission systems is calculated from Equations
(7.27) and (7.25)
a
i
j
MC
1
1 À "
Á
1 2u
2
c
i
1 2u
2
c
i
3
2
G
1
g
i
À FG
7:30
7.4.3.2 MultiCells and MultiClass Services Capacity
In order to analyse the capacity of a CDMA system for a multicellular layout the
interference at the radio cell site caused by the neighbouring radio cells must be calcu-
lated. Until now only ISI and CCI resulting from the connections established in one cell
has been considered. Returning to the basic quality constraint model, Equation (7.10) is
now modified to include the interference from adjacent radio cells, also known as inter-
cell interference I
inter
.
E
b
I
0
E
b
I
intra
I
inter
N
0
7:31
Similarly to the approach for the single cell scenario the primary equations for the
capacity calculation in a multicellular system are
S
i
R
i
P
K
k1
n
k
S
k
À S
i
1 2u
2
I
inter
3
2
R
chip
S
i
R
i
FG
i
N
0
! g
i
j
SC
7:32
for the SC transmission and for MC transmission
S
i
R
P
K
k1
c
k
n
k
S
k
À c
i
S
i
1 2u
2
I
inter
3
2
R
chip
S
i
R
FGN
0
! g
i
j
MC
7:33
These equations can also be rewritten in order to reach equations in a form similar to
Equations (7.19) and (7.20) in the form
1 2u
2
3
2
G
i
1
g
i
À FG
i
1 2u
2
S
i
!
X
K
k1
n
k
S
k
I
inter
3
2
N
0
R
chip
1 2u
2
SC
7:34
1 2u
2
c
i
3
2
G
1
g
i
À FG
1 2u
2
S
i
!
X
K
k1
c
k
n
k
S
k
I
inter
3
2
N
0
R
chip
1 2u
2
MC
7:35
152 Traffic Considerations in Comparing Access Techniques for WLL
Applying the proposition from Equation (7.21), leads to the following expression for
SC systems, from which the normalized bandwidth can be inferred
X
K
i1
1
1 À z
Á
1 2u
2
1 2u
2
3
2
G
i
1
g
i
À FG
i
n
i
1
SC
7:36
where z plays the role of the previous term "
z max
iPf1; ;K g
1
1 2u
2
3
2
G
i
1
g
i
À FG
i
Á
I
inter
3
2
N
0
R
chip
S
i
8
<
:
9
=
;
SC
7:37
Likewise Equation (7.35) for MC systems in a multicellular environment can be trans-
ferred to the form
X
K
i1
1
1 À z
Á
1 2u
2
c
i
1 2u
2
c
i
3
2
G
1
g
i
À FG
n
i
1
MC
38
with
z max
iPf1; ;K g
1
1 2u
2
c
i
3
2
G
1
g
i
À FG
Á
I
inter
3
2
N
0
R
chip
S
i
8
<
:
9
=
;
MC
7:39
These capacity equations can now be used to determine the normalized bandwidth for a
single class k connection. Looking at Equation (7.36) which is in the form of Equation
(7.27) the bandwidth necessary for a SC connection is equal to
a
i
j
SC
1
1 À z
Á
1 2u
2
1 2u
2
3
2
G
i
1
g
i
À FG
i
: 7:40
Correspondingly, comparing Equations (7.38) and (7.27) for MC systems
a
i
j
MC
1
1 À z
Á
1 2u
2
c
i
1 2u
2
c
i
3
2
G
1
g
i
À FG
7:41
It is now possible to calculate the system capacity of a CDMA system servicing multiple
service classes in a multicellular environment. In order to be able to perform the calcula-
tions for system capacity the following system parameters must be known.
CDMA Capacity Analysis 153
Table 7.3 Parameters for CDMA capacity analysis
Parameter Description
W Transmission bandwidth
S
i
received signal power
R
i
service bit-rate
E
b
=I
0
bit-energy to interference spectral power density
7.4.4 Analytical Results of CDMA in FWA Networks
Using the information gathered in the sections before, the actual capacity calculation for
DS-CDMA in a FWA network can now be carried out.
7.4.4.1 Ideal CDMA System
First a CDMA system with ideal properties is analysed. Ideal in this case means the
absence of inter-cell interference and ISI. This means that the multipath propagation
coefficient u
2
and I
intra
are equal to 0. Remaining is only the intra-cell interference I
intra
.
For the sake of completeness it is mentioned that receiver technologies based on joint
detection might eliminate this kind of interference when the number of codes used in the
cell is sufficiently low. However, in this study such improved reception methods are not
considered. For SC transmission with the presence of I
intra
in this case Equation (7.40) is
simplified to
a
i
j
SC
1
1 À z
Á
1
1
3
2
G
i
1
g
i
7:42
with
z max
iPf1; ;Kg
1
1
3
2
G
i
1
g
i
Á
3
2
N
0
R
chip
S
i
()
SC
7:43
where z approximately takes the value 1. A similar function can be developed from
Equation (7.41) for the MC scheme. The number of connections that can be carried is
calculated through the inverse of the normalized bandwidth a
i
. Table 7.4 gives an over-
view of the number of connections that can be held in such an ideal system.
For class 1 services both, SC and MC offer the same number of connections. This is
because for this service both schemes have the same spreading gain. While for SC the
spreading gain decreases as the service bit rate increases, MC still offers a high spreading
gain thereby being able to allocate slightly more calls. Nevertheless, the MC transmission
scheme looses performance by the increased number of codes used for transmission and
with that higher interference.
154 Traffic Considerations in Comparing Access Techniques for WLL
Table 7.4 Maximum number of possible connections for
different service classes in an ideal CDMA system
Service SC-Connections MC-Connections
Class 1 1082 1082
Class 2 347 358
Class 3 124 140
Table 7.5 Maximum number of possible connections for different
service classes in a CDMA system with inter-cell interference
Service SC-Connections MC-Connections
class 1 1079 1079
class 2 344 356
class 3 124 139
7.4.4.2 CDMA System with Inter-Cell Interference
The effect of inter-cell interference on a CDMA system can be seen if this characteristic is
considered in the ideal system described before. Since there is no ISI, the equations need
to be computed for the case that there is no multipath propagation, therefore u
2
is also
equal to 0. Table 7.5 shows the connection parameters of the different service classes if the
omni-directional scenario is analysed.
Similar results are achieved for the analysis performed for the scenarios with directional
antennas for the RNTs and sectored RBSs. A CDMA system with sectoring shows a
maximum increase of 3 connections which can be additionally carried.
7.4.4.3 CDMA System with Inter-Symbol Interference
The CDMA system is degraded if ISI is introduced into the system. However, the Rake
receiver technology which benefits from multipath propagation is left out of consideration
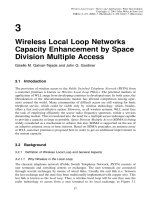
here. For connections based on an SC technology, Figures 7.3, 7.4 and 7.5 describe the
capacity result for class 1, class 2, and class 3 services, respectively.
Shown in the figures is the amount of bandwidth a single connection requires for a
certain channel quality and a transmission quality based on the multipath characteristic
of the Rice fading channel. The axis denoted with F(G) takes the value 0 for
FWA networks according to the explanation for the ISI earlier in this chapter. However,
to be fair a certain degrading quality of the channel should be considered. Using Equation
(7.54) it can be seen that F(G)orFG
i
is not allowed to be larger than the inverse of the
bit energy to spectral interference density ratio. To recapture, F(G) models the ISI
between two adjacent bits dependent on the spreading gain G. If no ISI takes place,
this function is 0. The transmission coefficient u
2
describes the ratio of the primary signal
to the multipath signal. At F(G) equalling 0, there is no multipath propagation and
CDMA Capacity Analysis 155
n
2
= 0.8
n
2
=1.0
n
2
= 0.7
n
2
= 0.1
n
2
= 0.2
n
2
= 0.3
n
2
= 0.4
n
2
= 0.5
n
2
= 0.6
n
2
= 0.9
Normalized bandwidth
Channel behaviour [F(G)]
0.005
0.01
0.015
0.02
0.025
0.03
0.035
0.04
0.18 0.2
0
0.16
0.06
0.08 0.1 0.12 0.14
Figure 7.3 32 kbit/s (voice) connection capacity
n
2
= 0.8
n
2
= 1.0
n
2
= 0.7
n
2
= 0.1
n
2
= 0.2
n
2
= 0.3
n
2
= 0.4
n
2
= 0.5
n
2
= 0.6
n
2
= 0.9
Normalized bandwidth
Channel behaviour [F(G)]
0.005
0.01
0.015
0.02
0.025
0.03
0.035
0.04
0
0.05
0.055
0.02 0.04 0.06 0.08 0.1 0.12
0.045
Figure 7.4 64 kbit/s (packet data) connection capacity
hence, u
2
is also 0. The capacity degrades as both F(G) and u
2
rise. In other words, the
worse a channel gets, the more bandwidth is required to offer an obligatory E
b
=I
0
value.
The class 1 service shows the lowest bandwidth utilization in the CDMA system. This is
due to the relatively shallow service bit rate and the low quality constraint required for
this class. The range of F(G) here lies in the interval [0 . . 0.2] the limits being determined
by the quality constraint. The bandwidth utilization of this service is 0.0009 % making a
total of 1079 simultaneous voice connections in one radio cell possible. A radio channel of
the worst quality can only offer 27 connections.
156 Traffic Considerations in Comparing Access Techniques for WLL
n
2
= 0.8
n
2
= 1.0
n
2
= 0.7
n
2
= 0.1
n
2
= 0.2
n
2
= 0.3
n
2
= 0.4
n
2
= 0.5
n
2
= 0.6
n
2
= 0.9
Normalized bandwidth
Channel behaviour [F(G)]
0.05 0.06
0.01
0.02
0.015
0.030.020.01
0.035
0.06
0.055
0.05
0.045
0.04
0.025
0.04
0.03
Figure 7.5 128 kbit/s (video) connection capacity
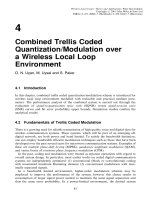
The bandwidth utilization increases with higher service bit rates and more stringent
quality demands. This can be seen in Figure 7.4. There is a rise in the bandwidth
requirement of the class 2 connections. Now the FWA channel can handle 344 connec-
tions, each requiring 0.3 % of the total bandwidth on offer. Due to the effects of multipath
propagation causing an increased ISI and I
inter
in the radio cell, only 19 class 2 connec-
tions are possible in such a worst case scenario.
The class 3 video connections show the highest bandwidth utilization. Only 124 simul-
taneous connections can be offered in one radio cell. The maximum number of connec-
tions under the influence of a channel with severe multipath propagation is 17.
The capacity calculations are carried out for both, SC and MC transmission tech-
nologies. The trend for MC transmissions is similar to the one for SC with the exception
that the utilized bandwidths for service classes 2 and 3 are slightly less. Obviously the
differences can only be seen for these services since both technologies have the same
spreading gain and number of used codes for the class 1 service. It can be concluded that
MC transmission with a high spreading gain would offer more capacity than an SC
transmission with variable spreading gains dependent on the bit rates of the services.
Moreover, MC transmission offers more flexibility for time-varying traffic in realistic
scenarios.
Interesting is the number of connections that can be held of each service in a realistic
CDMA system. In [9] the following values collected in Table 7.6 are presented for the
channel parameters u
2
and F(G).
Based on these values it is now possible to present the different number of connections
for the three service classes in systems of different qualities.
In a WLL performance study carried out by Deutsche Telekom AG, a maximum of
64 users with a bit rate of 32 kbit/s could be served with a BER less than 10
À3
[15].
The DS-CDMA system under study had a bandwidth of 3.5 MHz at a carrier frequency of
3.5 GHz. Only 16 users could be provided with Integrated Services Digital Network
(ISDN) services with a BER of 10
À6
, giving rise to 8 ISDN-B channels. Extrapolating
these results with respect to the 16 fold increased offered bandwidth of 56 MHz in the
CDMA Capacity Analysis 157
Table 7.6 Literature based values for realistic CDMA channels
Service u
2
F(G)
class 1 0.2 0.009
class 2 0.2 0.010
class 3 0.2 0.012
Table 7.7 Comparison of capacity in terms of number of connections for different
service classes in different CDMA systems
Transmission Mode Service only I
intra
plus I
inter
plus multipath
class 1 1082 1079 471
SC class 2 347 344 227
class 3 124 124 77
class 1 1082 1079 471
MC class 2 358 356 236
class 3 140 139 90
FWA network, a number of 1024 32 kbit/s connections seem possible. This capacity is
similar to the presented CDMA calculation results over good conditioned channels of
1079 simultaneous connections.
7.5 Comparison of TDMA and CDMA Results
A comparison of TDMA and CDMA technology is not directly possible. It must be stated
here that the capacity analysis for TDMA is performed by means of simulations whereas
the capacity analysis of CDMA is carried out on an analytical basis. Due to these two
different approaches there are technology specific assumptions and simplifications which
have to be made. However, a capacity comparison on a system level can be drawn. To
make the comparison fair, both systems are given similar features. The details of the
physical layer that means, transmission bandwidth, background noise, etc. are the same
for both systems. The system scenario and the transmission power levels of the radio
stations are also equal for both systems.
The FWA network employing TDMA with dynamic channel allocation is simulated
with different capacity enhancing schemes. It is shown what steps can be taken to raise the
amount of traffic that can be carried by one RBS, Chapter 8. The system configuration
with power control and directional antennas at the RNT applied corresponds closest to
the scenario for the analytical CDMA capacity calculation.
The capacity, e.g. the maximum number of connections that can be carried by the
CDMA system is calculated using an analytical method. In this model, perfect power
158 Traffic Considerations in Comparing Access Techniques for WLL
control was assumed. The maximum capacity is attained for a CDMA channel which is
assumed to be ideal. An ideal channel in this case is characterized by the fact that no
interference from other cells and no multipath propagation is present. Allowing inter-
ference will diminish the number of possible connections as the quality of the radio
channel degrades. Thereby, the effect of inter-cell interference is negligible since direc-
tional antennas at the RNT sides are assumed and rather less interference is emitted to the
other cell's receiving RBS. But the multipath component in radio propagation has a
severe impact on the number of connections that can be established with a sufficient
quality.
The capacity comparison is performed for connections with properties of the class 1
service which are voice calls with a service bit rate of 32 kbit/s.
For the ideal CDMA system a maximum of 1082 class 1 connections can be carried.
This number is reduced to 1079 if inter-cell interference is considered.
A value for the number of class 1 connections in a corresponding TDMA system can
also be calculated. Simulations are performed for an FWA network with a maximum
data rate of 35 000 slots/s. The TDMA system with the level-based power control and the
application of narrowbeam RNT antennas can carry 60 % of this maximum traffic. Now
the following calculation can be done. Having set the length of a slot to 800 bit, a total of
16.8 Mbit/s can be carried by the multicellular TDMA system. Dividing this bit rate by the
class 1 service bit rate of 32 kbit/s, the number of class 1 connections can be obtained as
that 525 class 1 connections can be simultaneously carried. Comparing this value the
capacity of CDMA would mean that TDMA can only offer half of the CDMA capacity.
However, this is not quite correct. In the analytical approach to estimate the CDMA
capacity, a heavy influence of multipath propagation causing ISI and increased inter-cell
interference has been seen. The number of class 1 connections per cell in a multicellular
environment with realistic CDMA transmission channels is reduced to 471. Now the
capacity of both systems is in an equivalent range.
Furthermore, in the TDMA scenario the entire bandwidth was divided into sub-bands
and every RBS was only able to transmit on one frequency at a time. For the CDMA the
whole frequency range was considered in the calculations.
Considering interference characteristics, the primarily comparison of TDMA with
an ideal CDMA system is valid. The effects of multipath propagation which are neglected
for ideal CDMA are not included in the simulative TDMA study either. But, since smaller
frequency sub-bands and with that lower transmission bit rates are proposed, the effect of
ISI is not expected to have such a significant impact as for CDMA transmission. There-
fore, the ideal transmission channel should not be assumed in the analytical approach. A
little surprising is the result that inter-cell interference plays a very small role in reducing
capacity in a CDMA system. This can be explained, however, through the very high
spreading gain that can be employed in the CDMA network and due to the high
directional subscriber antennas.
The results of this comparison are conform to other studies that were carried out. In [8],
for example, a comparative study between CDMA and TDMA has been done for a single
class service. Here, the capacity of each system depends on the Quality of Service (QoS)
stipulated for the service. CDMA performs better when the QoS metrics are strict because
of its good tolerance to interference.
TDMA on the other hand is susceptible to interference and thus performs better for
services with low QoS demands. In general, however, the number of users that are allowed
into the system are the same for both technologies.
Comparison of TDMA and CDMA Results 159
A study presented in (Wilson, N. D. and Ganesh, R. and Joseph, K. and Raychaudhuri,
D., 1993) [18], shows that CDMA has a 2:1 capacity advantage over TDMA. The TDMA
system here, however, is employed without dynamic channel allocation or any other
capacity enhancing techniques. The study shows that CDMA performs better than
TDMA for short data messages but worse for longer messages, which may be encountered
during file transfer for example.
List of Abbreviations
BER Bit Error Ratio
BRAN Broadband Radio Access Network
C/I Carrier to Interference ratio
CCI Co-Channel Interference
CDMA Code Division Multiple Access
ETSI European Telecommunications Standardisation Institute
FWA Fixed Wireless Access
GDP Gross Domestic Product
GSM Global System for Mobile Communications
IP Internet Protocol
ISDN Integrated Services Digital Network
ISI Inter-Symbol Interference
ITU International Telecommunications Union
LAN Local Area Network
MADCAT Mobile ATM Dynamic Channel Allocation simulaTor
MAI Multiple Access Interference
MC MultiCode
MPP MultiPoint-to-Point
PDC Personal Digital Cellular
PTO Public Telephony Operator
QoS Quality of Service
RBS Radio Base Station
RNT Radio Network Terminal
SC Single Code
TDMA Time Division Multiple Access
VoD Video on Demand
WLL Wireless Local Loop
WSSUS Wide Sense Stationary Uncorrelated Scattering
xDSL x(generic) Digital Subscriber Line
References
[1] F. Adachi, M. Sawahashi and H. Suda, `Wideband DS-CDMA for Next-Generation Mobile
Communications Systems,' IEEE Commun. Mag., pp. 56±69, Sep. 1998.
[2] J. S. Evans and D. Everitt, `Effective Bandwidth-Based Admission Control for Multiservice
CDMA Cellular Networks,' IEEE Trans. Vehicular Technology, vol. 48, pp. 36±46, 1999.
160 Traffic Considerations in Comparing Access Techniques for WLL
[3] E. Geraniotis and B. Ghaffari, `Analysis of Direct-Sequence Spread-Spectrum Multiple-Access
Communication over Rician Fading Channels,' IEEE Trans.Commun., vol. 39, pp. 713±724,1991.
[4] K. S. Gilhousen, I. M. Jacobs, R. Padovani, A. J. Viterbi, L. A. Weaver and C. E. Wheatley
III, `On the Capacity of a Cellular CDMA System,' IEEE Trans. Vehicular Technology, vol. 40,
pp. 303±311, 1991.
[5] J. Haine, `HIPERACCESS: an Access System for the Information Age,' Electronics Commun.
Engineering J., vol. 10, pp. 229±235, Oct. 1998.
[6] C. Hart, `Fixed Wireless Access: a Market and System Overview,' Electronics Commun. Engin-
eering J., vol. 10, pp. 213±220, Oct. 1998.
[7] ITU Radiocommunication Bureau, Wireless Access Local Loop, Geneva, 1997.
[8] S. V. Krishnamurthy, A. S. Acampora and M. Zorzi, `On the Capacity of TDMA and CDMA
for Broadband Wireless Packet Access,' in The Ninth IEEE International Symposium on
Personal, Indoor and Mobile Radio Communications, vol. 1, pp. 724±744, 1998.
[9] S. J. Lee, H. W. Lee and D. K. Sung, `Capacities of Single-Code and Multicode DS-CDMA
Systems Accommodating Multiclass Services,' IEEE Trans. Vehicular Technology, vol. 48,
pp. 376±384, Mar. 1999.
[10] W. C. Y. Lee, `Overview of Cellular CDMA,' IEEE Personal Commun., pp. 49±54, Feb. 1998.
[11] A. May, `Wireless Local Loop: Why the Slow Take Up?' Electronics Commun. Engineering J.,
vol. 10, pp. 236±238, Oct. 1998.
[12] P. Mermelstein, A. Jalali and H. Leib, H. `Integrated Services on Wireless Multiple Access
Networks,' in IEEE Proceedings Vehicular Technology Conference, vol. 2, pp. 863±867, 1996.
[13] T. S. Rappaport, Wireless Communications: Principles and Practice, Prentice Hall PTR, Upper
Saddle River, NJ, 1996.
[14] J. E. Smee and H. C. Huang, `Mitigating Interference in Wireless Local Loop DS-CDMA
Systems,' in The Ninth IEEE International Symposium on Personal, Indoor and Mobile Radio
Communications, vol. 1, pp. 724±744, Sep. 1998.
[15] B. Steiner and P. Kuhlmann, `Downlink Performance of a DS-CDMA Wireless Local Loop
System,' in IEEE Proceedings Vehicular Technology Conference, vol. 4, pp. 1331±1335, 1999.
[16] B. Walke, Mobile Radio Networks, John Wiley & Sons, Chichester, UK, 1999.
[17] W. Webb, `A Comparison of WLL with Competing Access Technologies,' Electronics
Commun. Engineering J., vol. 10, pp. 205±212, Oct. 1998.
[18] N. D. Wilson, R. Ganesh, K. Joseph and D. Raychaudhuri, `Packet CDMA Versus Dynamic
TDMA for Multiple Access in an Integrated Voice/Data PCN,' IEEE J. Selected Areas
Commun., vol. 11, pp. 870±884, 1993.
[19] World Bank, Knowledge for Development, Oxford University Press, New York, 1999.
References 161