Điện thoại di động vô tuyến điện - Tuyên truyền Channel P7 potx
Bạn đang xem bản rút gọn của tài liệu. Xem và tải ngay bản đầy đủ của tài liệu tại đây (308.99 KB, 31 trang )
Chapter 7
Other Mobile Radio Channels
7.1 INTRODUCTION
A great deal of attention has been given to propagation in built-up areas, in
particular to the situation where the mobile is located in the streets, i.e. when it is
outside the buildings. It is apparent, however, that other important scenarios exist.
For example, hand-portable equipment can be taken inside buildings, and in recent
years there has been a substantial increase in the use of this type of equipment. As a
result, interest in characterising the radio communication channel between a base
station and a mobile located inside a building has become a priority. Propagation
totally within buildings is also of interest for applications such as cordless
telephones, paging, cordless PABX systems and wireless local area networks. In
city areas there are tunnels and underpasses in which radio coverage is needed, and
away from cities there are suburban and rural areas where the losses due to buildings
are not necessarily the dominant feature.
Before dealing with such channels, it is worth pausing to clarify a few points and
to identify the ways in which the characteristics of the various channels dier. We
wish to distinguish between dierences which are merely those of scale and more
fundamental dierences of statistical character relating to the signal or the
interference. Dierences of scale are exempli®ed by the urban radio channel. This
is characterised by Rayleigh plus lognormal fading and is the same whether the
mobile is vehicle-borne or hand-portable. The dierences are apparent because the
fading rate experienced by a moving vehicle is generally much greater than the fading
rate experienced by a hand-portable. Although these dierences do not represent a
fundamental change in the statistical nature of the channel, they may not be trivial as
far as system designers are concerned. For vehicles moving at a reasonable speed, it
is often adequate to determine the system performance averaged over the (Rayleigh)
fading. For a hand-portable it may be more meaningful to determine the maximum
error rate over a speci®ed large percentage of locations. Changes of statistical
character are exempli®ed by indoor radio channels where the interference
environment diers markedly in magnitude and nature from that outside, and the
rural channel where the signal statistics are not well described by the Rayleigh
model.
The Mobile Radio Propagation Channel. Second Edition. J. D. Parsons
Copyright & 2000 John Wiley & Sons Ltd
Print ISBN 0-471-98857-X Online ISBN 0-470-84152-4
7.2 RADIO PROPAGATION INTO BUILDINGS
During recent years there has been a marked increase in the use of hand-portable
equipment, i.e. transceivers carried by the person rather than installed in a vehicle.
Such equipment is particularly useful in cellular and personal radio systems and now
completely dominates the market. It is essential for radio engineers to plan systems
that encompass this need, and a knowledge of the path losses between base stations
and transceivers located inside buildings is a vital factor that needs to be evaluated.
The problem of modelling radio wave penetration into buildings diers from the
more familiar vehicular case in several respects. In particular:
. The problem is truly three-dimensional because at a ®xed distance from the base
station the mobile can be at a number of heights depending on the ¯oor of the
building where it is located. In an urban environment this may result in there being
an LOS path to the upper ¯oors of many buildings, whereas this is a relatively rare
occurrence in city streets.
. The local environment within a building consists of a large number of obstructions.
These are constructed of a variety of materials, they are in close proximity to the
mobile, and their nature and number can change over quite short distances.
There have been several investigations of radio wave penetration into buildings,
particularly in the frequency bands used in cellular systems [1±7]. They can be
divided into two main categories:
. Those that consider base station antenna heights in the range 3.0±9.0 m and
mobiles mainly operating in one- or two-storey suburban houses.
. Those which consider the problem for base station antenna heights similar to
those used in cellular systems and mobiles operating in multi-storey oce buildings.
Investigations in the ®rst category all originated in connection with the design of a
proposed Universal Portable Radio Telephone System [8]. Because such a system
would need to cater for large numbers of very low-power portables, it is based on a
very small cell size (<1.0 km radius). Moreover, in such a system it is considered that
coverage within multi-storey oce buildings will be provided by a number of cells
within the building. It is for these reasons that the studies have used low base station
antenna heights, base-to-mobile distances less than 1 km, and have concentrated on
taking measurements in buildings the size of suburban houses.
In existing cellular systems, base stations for macrocells are typically located on the
roof of a tall building which may be 100 m or more above the local terrain, and base-to-
mobile distances of 1 km or more are of interest. Consequently, it is dicult to use the
results directly in the design of current-generation systems. However, these studies
have shown that the signal in small areas within buildings is approximately Rayleigh
distributed with the scatter of the medians being approximately lognormally distributed.
In other words, the signal statistics within a building can be modelled as superimposed
small-scale (Rayleigh) and large-scale (lognormal) processes ± the model used for
radio propagation outside buildings in urban areas. The variation of signal level with
antenna height is consistent with the presence of a re¯ecting ground plane.
Cox et al. investigated the power±range law by ®tting results to an equation of the form
L
50
S 10n log
10
d 7:1
Other Mobile Radio Channels 191
where S is a constant and d is the distance between transmitter and receiver. The
experiments were conducted using a ®xed receiver and a hand-held transmitter which
was moved around in areas of 4 ft
2
(0.37 m
2
) throughout the building. The values of
n were found to be 4.5, 3.9, 3.0 and 2.5 for measurements outside the building, on the
®rst ¯oor, on the second ¯oor and in the basement, respectively.
With one exception [6], studies in the second category have been concerned with
the statistical characterisation (median or mean, variance and CPD) of the `building
loss', a term ®rst introduced by Rice [9], to denote the dierence between the median
signal on a given ¯oor of a building and the median signal level outside, in the streets
immediately adjacent to the building. However, in reading the literature there is a
need for some care; this de®nition has been interpreted in dierent ways. There are
two obvious possibilities, either to take a number of measurements in the streets that
surround the building to produce an average external measurement as suggested by
Rice, or alternatively to use the signal level at a point immediately outside the
building in line with the centre of the building and the transmitter location [2].
The second method has merit when an LOS path exists between the transmitter
and the building concerned, but generally when this is not the case, and energy enters
the building via a number of scattered paths, the ®rst method seems more realistic.
The method of data analysis also diers, although in almost all investigations the
signal has been sampled at ®xed intervals of time or distance. In general the
dierent methods of data analysis do not signi®cantly aect the measured value of
mean building penetration loss, but calculations of the signal variability can be
aected depending upon whether this is described in terms of a standard deviation or
as a statistical distribution function.
For these reasons it is sometimes dicult to compare the results from the dierent
investigations. The penetration loss depends on a number of factors, central among
them being the carrier frequency, the propagation conditions along the path and the
height of the receiver within the building. However, there are several other
in¯uencing factors which include the orientation of the building with respect to the
base station, the building construction (the construction materials and the number
and size of windows) and the internal building layout. Their in¯uence and relative
importance will become apparent later. Almost all models for predicting signal
strength in buildings have used the technique proposed by Rice, i.e. ®rstly predict the
median signal level in the neighbouring streets using one of the known methods and
then add the building penetration loss.
An investigation by Barry and Williamson in New Zealand [10] concentrated originally
on buildings where the majority of ¯oors had a line-of-sight path to the base station. By
using criteria similar to those for the vehicular environment, i.e. that the best statistical
descriptor was one which adequately predicted values near the tails, it was found that the
signal on any ¯oor was best ®tted by Suzuki statistics and at 900 MHz the standard
deviation of the lognormal part of the distribution was 6.7 dB. It was also suggested that
mirror-glass windows could introduce an additional loss of the order of 10 dB.
A series of experiments in the UK at frequencies of 441, 896.5 and 1400 MHz [11]
produced general conclusions about signal variability similar to those from previous
investigations, and they also provided an insight into the eects of transmission conditions
and carrier frequency. The transmission conditions appear to have a strong eect on the
value of the standard deviation and on the departure of the distribution from lognormal.
192 The Mobile Radio Propagation Channel
Table 7.1 shows the penetration loss for three dierent frequencies (441, 896.5 and
1400 MHz) for a receiver located in a modern six-storey building. The penetration
loss decreases by around 1.5 dB as the frequency is increased from 441 to 896.5 MHz
and by a further 4.3 dB when the frequency is raised to 1400 MHz. These results (the
decrease in penetration loss at higher frequencies) are consistent with the conclusions
drawn by Rice [9] and Mino [12].
A dierent series of measurements using a number of large buildings has produced
ground-¯oor penetration loss values of 14.2, 13.4 and 12.8 dB at 900, 1800 and
2300 MHz respectively. It can be argued that for system designers, the penetration
loss at ground-¯oor level is the most important because if a system is designed to give
adequate service to mobiles at ground-¯oor level, then service on higher ¯oors within
a building will almost certainly be as good if not better.
It is worth re-emphasising that the total loss between the base station and the
mobile has been split into two parts: the loss from the base station to points in the
streets surrounding the building concerned and the additional penetration loss from
the street into the building itself. This has the advantage that established methods
can be used to estimate the ®rst component, and the penetration loss then becomes
an additional factor. Although the penetration loss, as de®ned, decreases with
frequency in the range considered above, the path loss from the base station to the
streets outside will increase. This factor dominates, so the total path loss between
transmitter and receiver will always increase as the frequency is raised.
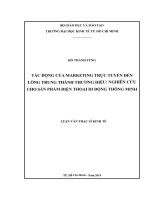
The transmission conditions have a strong in¯uence on the value of the standard
deviation and also on the departure of the distribution from lognormal. Figure 7.1
shows that when no LOS path exists, the large-scale signal variations exactly ®t a
lognormal distribution and that the standard deviation is about 4 dB. In other
circumstances where there is an LOS path to the whole building or part of the
building, the large-scale signal variations depart somewhat from the lognormal and
have a higher standard deviation. For complete LOS the standard deviation is 6±
7 dB. These values are very close to those reported by Cox [2].
Two building construction eects have been noted. First, the standard deviation of
the large-scale variations is related to the ¯oor area of the building concerned;
smaller ¯oor areas lead to lower values of standard deviation and vice versa.
Secondly, the penetration loss generally reduces as the receiver is moved higher
Other Mobile Radio Channels 193
Table 7.1 Mean penetration loss on various ¯oors of a six-storey building
a
Floor level Penetration loss (dB)
441.0 MHz 896.5 MHz 1400.0 MHz
Ground 16.37 11.61 7.56
1 8.11 8.05 4.85
2 12.76 12.50 7.98
3 13.76 11.18 9.11
4 11.09 8.95 6.04
5 5.42 5.98 3.31
6 4.20 2.53 2.54
a
Figures are relative to the signal measured outside the building in the adjacent streets.
within a building; indeed there may be an LOS path to the higher ¯oors of a building
when no such path exists to the streets outside or to lower ¯oors of the building.
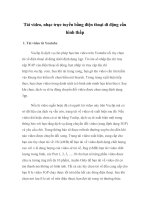
Occasionally, however, it has been found that the penetration loss increases at high
levels within a building. A result of this kind was reported without discussion by
Walker [7], where the penetration loss increased from À1:4 dB at ¯oor 9 to 15.3 dB at
¯oor 12 of the same building. It seems likely that such increases result from the
speci®c propagation conditions existing between the transmitter and receiver
locations. Figure 7.2 [11] shows a change of about 2 dB per ¯oor, and this agrees
very closely with the ®ndings of other workers [4,7,13].
In summary, when the transmitter is outside, the signal within a building can be
characterised as follows:
. The small-scale signal variation is Rayleigh distributed.
. The large-scale signal variation is lognormally distributed with a standard
deviation related to the condition of transmission and the area of the ¯oor.
. The building penetration loss, as de®ned, decreases at higher frequencies.
. When no line-of-sight path exists between the transmitter and the building
concerned (i.e. scattering is the predominant mechanism) the standard deviation of
the local mean values is approximately 4 dB. When partial or complete line-of-sight
conditions exist, the standard deviation rises to 6±9 dB.
. The rate of change of penetration loss with height within the building is about 2 dB
per ¯oor.
Finally we comment brie¯y on the matter of modelling. Most of the outdoor
propagation models in Chapter 4 were developed and optimised for macrocells, and
without further validation they are not necessarily reliable for microcellular
propagation where the antenna height is low. In addition, predicting ®rst the
194 The Mobile Radio Propagation Channel
Figure 7.1 Cumulative distribution of the large-scale variations of the signal at 900 MHz
within a building when no line-of-sight path exists: (
Ð
) measured, (± ± ±) theoretical
lognormal distribution with standard deviation 4 dB.
average signal level in the streets surrounding a building using a method which has
limited accuracy and then adding a building penetration loss, itself subject to
statistical variation, inevitably leads to a reduction in accuracy. It seems clear that
the prediction of path loss from an external transmitter to a receiver located within a
building will be more accurate if it is undertaken directly and not merely as an
extension of outdoor modelling. Indeed, Barry and Williamson [14] suggested
combining factors associated with propagation into buildings with factors associated
with propagation inside buildings to produce a comprehensive model.
Toledo et al. [15] undertook a multiple regression analysis of a large database and
investigated the relationships between a number of variables. The best results were
obtained by including three variables in the regression equations, the distance d
between transmitter and receiver, the ¯oor area A
f
of the building concerned and a
factor S
Q
which represents the number of sides of the building which have an LOS
path to the receiver. The models at 900 and 1800 MHz respectively are
L
50
À37:7 40 log
10
d 17:6 log
10
A
f
À 27:5S
Q
L
50
À27:9 40 log
10
d 23:3 log
10
A
f
À 20:9S
Q
7:2
The root mean square errors between these equations and the measurements from
which they were derived are 2.4 and 2.2 dB respectively, slightly lower than those
obtained by Barry and Williamson from their measurements in Auckland [14].
7.3 PROPAGATION INSIDE BUILDINGS
In cordless telephone systems the indoor portion of the subscriber line is replaced by
a radio link so that the telephone handset can be carried about freely within a limited
Other Mobile Radio Channels 195
Figure 7.2 Building penetration loss as a function of height within the building: Â are
experimental points.
area, calls being initiated and received in the usual way. The demand for such systems
has prompted research into the propagation characteristics of radio signals where
both the transmitter and receiver are within a building. The possibility of cordless
telephone exchanges and the general interest in indoor radio systems of various kinds
are added factors that have given impetus to this topic. There have been several
investigations over a wide range of frequencies; we will only be able to present a rather
brief review. However, let us begin by noting that propagation within buildings is very
strongly in¯uenced by the local features, i.e. the layout of the particular building
under consideration and the building construction materials used for the walls, ¯oors
and ceilings. It is conceivable that radio communication inside buildings could be
aided by the use of leaky-feeder systems, but that topic will not be considered here.
Indoor radio diers from normal mobile radio in two important respects: the
interference environment and the fading rate. The interference environment is often
caused by spurious emissions from electronic equipment such as computers, and the
level can sometimes be much greater than that measured outside. Moreover, there are
substantial variations in signal strength from place to place within a building. The
signal can be highly attenuated after propagating a few metres through walls, ceilings
and ¯oors or may still be very strong after propagating several hundred metres along a
corridor. The signal-to-interference ratio is unpredictable and highly variable.
The slow fading rate makes it inappropriate to calculate system performance by
averaging over the fading; it is more appropriate to envisage two possibilities as
follows. First if the user of, say, a cordless telephone is moving around slowly during
the conversation then the antenna will pass through several fades, albeit rather
slowly. This situation can best be described in terms of the percentage of time for
which the signal-to-interference ratio falls below an acceptable threshold or, in a
digital system, the percentage of time for which the error rate exceeds a given value.
However, because of secondary eects (e.g. motion of other people, doors being
opened and closed), these probabilities will change slowly with time. Survey papers
exist [16,17] which discuss the literature available at the time of writing.
Unsatisfactory performance in wideband systems can also be caused by
intersymbol interference due to delay spread, and this limits the data rate. Thus,
in narrowband systems, multipath and shadow fading limit the coverage, whereas
interference causes major problems even within the intended coverage area.
Interference, discussed in Chapter 9, can be natural or man-made noise or it can
come from other users in a multi-user system. It limits the number of users that can
be accommodated within the coverage area. Techniques such as dynamic channel
assignment, power control and diversity [18] can help used to reduce the problems.
7.3.1 Propagation characteristics
Several investigations have been undertaken to determine radio propagation
characteristics in houses [3,19±21], oce buildings [22±24] and factories [25]. One
early investigation, prompted by the proposed introduction of a cordless telephone
system in Japan, was concerned with the 250 MHz and 400 MHz bands [19]. As a
result of measurements made using a low-power (10 mW) transmitter, it was
concluded that the median path loss follows the free space law for very short
distances (up to 10 m), it then increases almost in proportion to distance. If the
196 The Mobile Radio Propagation Channel
propagation path was blocked by furniture of various kinds, the characteristics were
aected in dierent ways and no general statements were made. The short-term
variations in signal about the median value were closely represented by a Rayleigh
distribution as a result of scattering from walls, ¯oors, ceilings and furniture.
A law relating path loss to distance from the transmitter can be used to predict
signal strength in a building of a given structure, but it is dicult to make general
statements. The best approximations to straight-line characteristics are most likely to
occur where rooms are of a similar size, uniformly arranged, with walls of uniform
attenuation between each room [20]. The exponent n in the power law varies from
approximately 2 (free space) along hallways and corridors to nearly 6 over highly
cluttered paths.
Motley and Keenan [26] reported the results of experiments in a multi-storey oce
block at 900 and 1700 MHz. A portable transmitter was moved around selected
rooms in the building while a stationary receiver, located near the centre of the oce
block monitored the received signal levels. The conventional power±distance law was
expressed in the form of equation (7.1) as
P P
H
kF S 10n log
10
d
where F represents the attenuation provided by each ¯oor of the building and k is the
number of ¯oors traversed. When P
H
was plotted against distance d, on a logarithmic
scale, the experimental points lay very close to a straight line. Table 7.2 summarises
the values of the measured parameters. Notice that n is similar at both frequencies
but F and S are respectively 6 dB and 5 dB greater at 1700 MHz. These results were
con®rmed by tests in another multi-storey building with metal partitioning. Overall
the measured path loss at 1700 MHz was 5.5 dB more than at 900 MHz, which agrees
well with theoretical predictions based on reduced eective antenna aperture.
Other workers [27] have obtained a loss of 3±4 dB through a double plasterboard
wall and a loss of 7±8 dB through a breeze block or brick wall. These values are less
than through a ¯oor, probably because ¯oors often have metal beams and
reinforcing meshes which are not present in the walls. It seems that at 1700 MHz
there is a greater tendency for RF energy to be channelled via stairwells and lift
shafts than at 900 MHz. It has been reported that the losses between ¯oors are
in¯uenced by the construction materials used for the external walls, the number and
size of windows and the type of glass [28].
The external surroundings also have to be considered since there is evidence
[29,30] that energy can propagate outwards from a building, be re¯ected and
scattered from adjacent buildings and re-enter the building at a higher and/or lower
level depending upon the location of the antenna and its polar pattern. Experiments
have also shown that the attenuation between adjacent ¯oors is greater than the
Other Mobile Radio Channels 197
Table 7.2 Propagation parameters within buildings
F (dB) S (dB) n
Frequency 900 MHz 10 16 4
Frequency 1700 MHz 16 21 3.5
incremental attenuation caused by each additional ¯oor and that after ®ve or six
¯oors there is little further attenuation. Several workers [2,31] have published
information about signal losses caused by propagation through various building
materials over a wide range of frequencies.
It appears that propagation totally within buildings is more dependent on building
layout and construction in the 1700 MHz band than it is at 900 MHz. The lower
band (860 MHz) is already used for the Digital European Cordless Telephone
(DECT) system, which is designed for domestic and business environments. It oers
good quality speech and other services for voice and data applications, and it
provides local mobility to users of portable equipment in conjunction with an in-
building exchange. Although propagation losses increase with frequency, the
1700 MHz band may also be viable for an in-building cordless telephone system
where, in any case, the number of base stations is dictated by capacity and
performance requirements rather than by the limitations of signal coverage.
Experiments reported by Bultitude [24] give an indication of signal variability
within buildings at 900 MHz. Although it might be anticipated that for locations
where there is no line-of-sight path, the data would be well represented by a Rayleigh
distribution as reported at lower frequencies [19], this did not prove to be the case.
Data representing such locations was generally found to be Rician distributed with a
specular/random power ratio K of approximately 2 dB. Exceptional locations were
found where Rayleigh statistics ®tted well. For any ®xed location having these
Rician statistics there is a 90% probability that the signal is greater than À7 dB but
less than 4 dB with respect to that determined by losses along the transmitter±
receiver path. Temporal variations in the received signal envelope are also apparent
as a result of movement of people and equipment. These variations are slow and
have characteristics that depend upon the ¯oor plan of the building.
In buildings which are divided into individual rooms, fading is likely to occur in
bursts lasting several seconds with a dynamic range of about 30 dB. In open oce
environments fading is more continuous with a smaller dynamic range, typically
17 dB. These temporal envelope variations are Rician with a value of K between 6
and 12 dB. The value of K is a function of the extent to which motion within the
building alters the multipath structure near the receiver location. Terminal motion
also causes fading due to movement through the spatially varying ®eld. This is
adequately described, as above, by a Rician distribution with K % 2 dB.
There have been several attempts to model indoor radio propagation using an
extension of eqn. (7.1):
L
50
S 10n log
10
d X
s
7:3
where X
s
is a lognormal variable (normally in dB) with standard deviation s.
Anderson et al. [32] give typical values of n and s for a variety of buildings over a
range of frequencies, n lying in the range 1.6±3.3 and s being between 3.0 and 14 dB.
Seidel [28] also gave values for a variety of situations in dierent buildings, derived
from measurements in a large number of locations. These values were used to model
propagation using an equation of the form
L
50
S 10n
SF
log
10
d F 7:4
198 The Mobile Radio Propagation Channel
where n
SF
represents the value of the exponent for measurements on the same ¯oor.
Assuming that a good estimate of n
SF
exists, the path loss on a dierent ¯oor can be
found by adding an appropriate value of the ¯oor attenuation factor F.
Alternatively, in eqn. (7.4) F can be removed by using an exponent n
MF
which
already includes the eect of multiple-¯oor separation. The propagation equation
then becomes
L
50
S 10n
MF
log
10
d 7:5
Devasirvatham [33] found that the in-building path loss could be modelled as the free
space loss plus an additional loss that increased exponentially with distance, thus
implying that the total loss could be expressed by a modi®cation of eqn. (7.4):
L
50
S 10n
SF
log
10
d ad F 7:6
where a is a suitable attenuation constant in decibels per metre (dB/m). This model
and others are summarised by Rappaport [34]. Finally, using the basic equation (7.1)
as a reference, Toledo and Turkmani [35,36] undertook a multiple regression
analysis using a number of other factors, in order to establish those which were most
in¯uential. Their ®nal equations for predicting the path loss, at 900 and 1800 MHz
respectively, from a transmitter to a given room in a multi-storey building were
L
50
18:8 39:0 log
10
d 5:6k
f
13:0S
win
À 11:0G À 0:024A
f
L
50
24:5 33:8 log
10
d 4:0k
f
16:6S
win
À 9:8G À 0:017A
f
7:7
In these equations k
f
is the number of ¯oors separating the transmitter and receiver;
S
win
is a factor representing the amount of energy which leaves and re-enters the
building (it takes into account the position of the transmitter relative to the external
walls of the building); G represents the observed tendency for the signal to be
stronger on the lowest two ¯oor of the building; and A
f
is the ¯oor area of the room
containing the receiver. S
win
is given a value between 0 and 1 depending on the
relative location of the radio terminals.
For rooms on the same side of the building as the transmitter, S
win
1; for rooms
on the opposite side S
win
0:25; and for those on the two sides perpendicular to the
side where the transmitter is located, S
win
0:5. For internal rooms with no external
windows S
win
0. Some judgement is needed to assign values to rooms close to the
transmitter, to corridors and to areas separated from the transmitter only by, say, a
single wooden door which may or may not be open at any time.
The factor G was set equal to 1 on the lower two ¯oors and it was 0 elsewhere.
Although it may be dicult to predict the path loss accurately for receiver locations
close to the transmitter, this is of academic interest only since the signal is likely to be
high, providing good communication. The best signal coverage of any building is
usually achieved by locating the transmitter in a large room as near as possible to the
centre of the building [30]
7.3.2 Wideband measurements
In addition to narrowband measurements designed to determine how median signal
strength varies with distance and to evaluate signal variability, there have also been
several investigations of the wideband characteristics of propagation within
buildings.
Other Mobile Radio Channels 199
Measurements of time-delay spread in oce buildings and residences have been
reported by Devasirvatham [37±39] using equipment operating at 850 MHz with a
time-delay resolution capability of 25 ns (i.e. paths diering in length by 7.5 m or
more can be resolved). It appears that the detailed shape of the individual power±
delay pro®les have little impact on the performance of a radio system [40,41], so
eort was concentrated on evaluating the average delay and the RMS delay spread.
In general, the delays and delay spreads are smaller than corresponding values
measured outside buildings. The averaged time-delay pro®le in Figure 7.3 represents
data collected in a large, six-storey building and has an RMS time-delay spread of
247 ns. Figure 7.4 shows the cumulative distribution of time-delay spread for this oce
building and a smaller two-level building. A portable communications system would
have to work under worst-case delay spread, which for both these oce buildings is
about 250 ns. Larger delay spreads, in the range 300±420 ns, were measured at
residential locations, particularly on inside-to-outside paths, but the limited number of
locations that were used makes general conclusions rather dicult to draw. Note,
however, that whenever a line-of-sight path exists between transmitter and receiver, the
RMS delay spread is signi®cantly reduced, typically to less than 100 ns.
Bultitude et al. [42] compared indoor characteristics at 900 MHz and 1.75 GHz
using equipment with parameters the same as Devasirvatham's. Measurements were
made in a four-storey brick building and in a modern building of reinforced concrete
blocks, both in Ottawa, Canada. There were perceivable dierences in the measured
characteristics, but these seemed to be more a function of the location than a
function of the transmission frequency. In one building, RMS delay spreads were
slightly greater at 1.75 GHz for over 90% of locations (28 ns compared with 26 ns),
whereas in the other building the reverse was true for about 70% of locations.
Although the results indicated that coverage would be less uniform in both buildings
at 1.75 GHz, they also showed that coverage would be less uniform in one of the
buildings than in the other, regardless of the transmission frequency. It seems
dicult, on the basis of this work, to conclude anything except that there is little
dierence between the wideband frequency correlation statistics in the two frequency
bands.
A statistical model for indoor multipath propagation has been presented by Salah
and Valenzuela [43] based on measurements at 1.5 GHz using 10 ns radar-like pulses
in a medium-sized oce building. Their results showed that the indoor channel is
quasi-static, i.e. it varies very slowly, principally as a result of people moving around.
The nature and statistics of the channel impulse response are sensibly independent of
the polarisation of the transmitter and receiver provided that no line-of-sight path
exists. The maximum delay spread observed was 100±200 ns within rooms, but
occasionally values greater than 300 ns were measured in hallways. It is very
interesting to note that the measured RMS delay spread within rooms had a median
value of 25 ns and a worst-case value of 50 ns, ®ve times smaller than
Devasirvatham's results from a much larger building.
A simple statistical model was proposed in which the rays that make up the
received signal arrive in clusters. The ray amplitudes are independent Rayleigh
random variables with variances that decay exponentially with cluster delay as well
as with ray delay within a cluster. The corresponding phase angles are independent
random variables uniformly distributed in the range (0, 2 p). The clusters, and the
200 The Mobile Radio Propagation Channel
rays within a cluster, form Poisson arrival processes with dierent but ®xed rates,
and the clusters and the rays have exponentially distributed interarrival times. The
formation of the clusters is determined by the building structure and the rays within
a cluster are formed by multiple re¯ections from objects in the vicinity of the
transmitter and receiver. Both discrete and continuous versions of the model are
possible. However, it has been suggested [44] that the discrepancies actually arise as a
result of the Poisson arrival assumption and that a modi®ed Poisson process is more
representative. Furthermore, the path amplitudes have been shown to follow a
lognormal distribution rather than a Rayleigh distribution.
Finally, Rappaport et al. [25,45,46], again using similar equipment, have studied
multipath propagation in factory buildings at 1300 MHz. Substantial physical
dierences exist between such buildings and oces or residential houses in respect of
construction techniques, contents and placement of walls and partitions. It might be
Other Mobile Radio Channels 201
Figure 7.3 Measured time-delay pro®le within a large six-storey building (after
Devasirvatham).
Figure 7.4 Cumulative distribution of time-delay spread within two oce buildings.
expected, therefore, that propagation characteristics would also be dierent. In fact,
it was found that the path loss exponent n was approximately 2.2 and that Rician
fading was the norm. The RMS delay spread ranged between 30 and 300 ns, the
median values being 96 ns for line-of-sight paths along aisles and 105 ns for
obstructed paths across aisles. The worst-case measured value was 300 ns. These
values are comparable with those measured in large oce buildings [38].
Table 7.3 brings together some of the in-building ®gures that have been reported.
De®nitive conclusions are not easy because the propagation conditions are so variable. It
seems that where line-of-sight paths exist, the propagation law exponent is usually near 2,
indicating that a free space mode is dominant, and this is accompanied by Rician rather
than Rayleigh fading. For obstructed paths the exponent rises to 4 or more, and although
in many cases the fading is still characterised by Rician statistics, Rayleigh characteristics
have also been reported. It is likely that Rician channels will support higher data rates.
Wideband measurements have been made at frequencies in the range 850±1750 MHz but
there are no obvious eects that can be attributed to changes in the carrier frequency.
There is no evidence to suggest that the scattering and re¯ecting properties of the
materials used for construction change appreciably over this frequency range, as the
delay spreads do not exhibit any signi®cant statistical dierence.
It might be expected that delay spread would decrease with frequency due to
increased attenuation by the structural materials, but this is certainly not apparent
below 2 GHz. On the other hand, there is some evidence [21,47] that at 60 GHz the
propagation mechanism is dierent since the radio waves are eectively screened by
any metal partitions. Although at this frequency there is some leakage through doors
and windows, this is insucient to give room-to-room coupling except where a line-
of-sight path exists. At this frequency the transmission, re¯ection and absorption
202 The Mobile Radio Propagation Channel
Table 7.3 Measured parameters from propagation experiments inside buildings
Investigators Frequency Environ- RMS delay spread (ns) Worst Propagation
ment
Median
value
Standard
deviation
case
(ns)
law
exponent n
Bultitude
et al.
910 MHz
1.75 GHz
Within brick
and concrete
oce
buildings
26±30
28±29
8±11
17±22
Saleh and
Valenzuela
1.5 GHz Within
oce
buildings
25±50 100±200 3±4
Devasirvatham
and Murphy
850 MHz
1.7 GHz
Within
oce
buildings
In the range
50±150
400
Rappaport 1.3 GHz In factory
buildings
96 (LOS)
105 (NLOS)
300 2.2
LOS line-of-sight.
NLOS non-line-of-sight.
properties of materials commonly used for building construction vary very widely.
However, no wideband measurements have been reported.
7.4 RAY TRACING: A DETERMINISTIC APPROACH
In Chapter 3 we noted that the availability of high-resolution databases makes it
more attractive to move towards deterministic propagation methods. We can never
hope for 100% accuracy of course because databases are rarely completely up to
date, and there are always factors such as moving vehicles, trees in or out of leaf and,
inside buildings, changes of furniture location, which introduce uncertainties.
Nevertheless, propagation methods based on ray theory have been the subject of
many investigations in recent years. They have been used for both indoor and
outdoor environments, and in theory they have enormous potential. If a number of
rays can be traced from a given transmitter location to a given receiver location, the
electrical lengths of the various ray paths give the amplitudes and phases of the
component waves and they can be used to calculate the signal strength. In this
context, due account must be taken of changes in amplitude and phase caused by
propagation through, or re¯ection from, obstacles along the ray path. Moreover, the
physical lengths of the ray paths allow calculation of the propagation times along
those paths, thus permitting evaluation of delay spread and other similar parameters.
The characteristics of the antennas used at both ends of the link can be built into
the prediction algorithm, so methods based on ray theory have the potential to
provide a complete channel characterisation as far as propagation is concerned. This
can be in two or three dimensions depending upon the nature of the available
databases. In outdoor environments, sophisticated processing techniques can be used
to convert aerial or satellite photographs into 3D databases; in indoor environments,
architectural drawings and other layout information can serve the same purpose.
However, the extent to which any given ray will penetrate, be re¯ected from, or be
diracted around a given obstacle depends crucially on the electrical properties of
the material or materials from which the obstacle is constructed as well as on its
geometrical shape.
The equations in Section 2.3.1 show that the re¯ection coecient of a plane
surface depends on the polarisation of the incident wave, the angle of incidence and
very importantly on the dielectric constant and conductivity of the material. Precise
values of conductivities and dielectric constants are needed if accurate predictions
are to be obtained. Re¯ection from a curved surface, surface roughness and
diraction were all discussed in Chapter 2 and have a part to play in prediction
methods based on ray theory.
The propagation model normally recognises that when an obstacle exists in the
path of a ray, the ray can be specularly re¯ected, scattered, transmitted (and partially
absorbed in the process) or in some cases diracted around the edge of the obstacle.
Specular re¯ection is characterised by the incident and re¯ected rays making equal
angles with the normal to the surface, transmission obeys Snell's law of refraction,
and diraction eects can be estimated using any of the methods discussed in
Chapter 3, e.g. UTD. Scattering is not so easy to deal with and is often neglected on
the basis that the vast majority of the energy is contained in the specularly re¯ected
component. Whether this is justi®ed or not, depends on the particular propagation
Other Mobile Radio Channels 203
scenario. Re¯ected and transmitted rays have an inverse square law power
dependence (cf. free space propagation) depending on the total distance travelled.
Care is necessary in applying the re¯ection coecients given by eqns (2.9) and
(2.10); for smooth surfaces, conservation of energy dictates that the transmission
coecient is (1 À re¯ection coecient). The proper re¯ection coecient must be used
depending on the polarisation of the ray relative to the obstacle concerned. For
example, in an indoor environment, when a vertically polarised ray launched from a
transmitter meets the ¯oor or ceiling, the E-®eld is normal to the surface and eqn
(2.10) applies. On the other hand, the E-®eld is parallel to walls, so eqn (2.9) should
be used. Oblique incidence can be treated by resolving the incident ray into two
orthogonal components and proceeding appropriately.
Two basic methods appear in the literature, the ray launching or `brute force'
method [48] and ray tracing [49]. Reciprocity applies as far as each individual
propagation path is concerned, but it is customary and more intuitive to trace rays
assuming that they start at the transmitter, since the single-transmitter/multiple-
receiver scenario is by far the most common. This is particularly relevant in the ray
launching method which works as follows.
A software program checks for an LOS between the speci®ed transmitter and
receiver locations. Next it launches and traces a ray away from the transmitter in a
speci®ed direction and detects whether it intersects an obstruction speci®ed on the
database. If it does not, the process stops and a new source ray in a dierent
direction is launched. If an intersection is found, the program determines whether the
re¯ected ray from the intersection point has an unobstructed path to the receiver,
and the re¯ected and transmitted rays are then traced to the receiver or to another
obstruction. This recursive process ± launching a ray at a given angle and tracing its
path ± continues for each ray until the ray reaches the receiver, until a speci®ed
number of intersections is exceeded, until the ray energy falls below a speci®ed
threshold (e.g. rays which pass through obstructions such as walls) or until no
further intersections occur. Of course, rays launched in certain directions will never
reach the receiver because the geometry is such that no path exists.
To determine all possible rays that propagate between the transmitter and
receiver, it is necessary to consider all possible angles of launch from the transmitter
and arrival at the receiver. One way of doing this is to consider a large number of
rays, each separated from its neighbouring rays by a small but constant angle in 3D
space. It appears that an acceptable trade-o between coverage and computation
time is attained with an angular separation of about 18 [50]. It is also necessary to
decide whether any ray has reached the receiver, by applying a minimum distance
test. Since it would be unrealistic to regard the receiving location as being
in®nitesimally small, an imaginary sphere of small radius is constructed around the
receiving point and any ray which intersects this sphere is considered to have been
received. The signal strength calculated from the phasor addition of all received rays
is considered to be the mean signal over the area de®ned by the sphere.
Image-based ray tracing diers from ray launching and appears to have some
advantages. Instead of using the `brute force' approach of launching many rays
(often up to 40 000) at very similar angles, the technique considers all obstructions as
potential re¯ectors and calculates their eect using the method of images. This is a
strictly analytical approach which does not require the use of a receiving sphere,
204 The Mobile Radio Propagation Channel
paths are neither duplicated or missed out and in simple environments the
computation time is much less because only paths which actually exist between the
transmitter and receiver are considered.
A database is used and the transmitter and receiver locations are speci®ed using a
3D coordinate system. As in ray launching methods, the strengths of re¯ected and
transmitted rays are computed using geometrical optics, and diracted rays are
treated using one of the standard techniques; UTD is very popular in current
approaches [51]. The existence, or not, of an LOS path is established then virtual
source or `image' data is generated by re¯ecting the source to the opposite side of all
relevant obstacles.
To make this process more manageable, a wall sequence diagram is created.
Figure 7.5(b) is a partial wall sequence diagram (which resembles a tree structure) for
the simple layout in Figure 7.5(a). There are four obstructions, wall 1 is the ®rst
re¯ector, and paths with up to three re¯ections are considered. Consecutive
re¯ections from the same wall are not possible and they do not exist in the diagram.
Figure 7.5(b) shows there are a total of 13 possible paths with wall 1 as the ®rst
re¯ector (1 single re¯ection, 3 double re¯ections and 9 triple re¯ections). Similar
diagrams can be drawn with walls 2, 3 and 4 as the ®rst re¯ector, so 52 possible paths
exist (plus the LOS path) in this simple scenario if up to three re¯ections are
considered. The wall sequence diagram only identi®es the possibilities; it does not
imply that all these paths actually exist.
Other Mobile Radio Channels 205
Figure 7.5 (a) Simple indoor propagation scenario; (b) partial wall sequence diagram for part
(a).
(b)
Figure 7.6 gives a partial example which illustrates the process of image generation
in an indoor environment. I
1
w
1
is the ®rst-order image of Tx in wall 1. Two second-
order images, i.e. images of I
1
w
1
, are created in wall 2 (extended) and wall 3
(extended) and they are designated I
2
w
2
and I
2
w
3
. Higher-order images are
generated as appropriate. A more complete picture would also show ®rst-order
images of Tx in walls 2 and 3, together with appropriate higher-order images.
Having calculated the image locations, the software then tests to see whether each
image is capable of providing a path. It does this starting from the highest-order
images and working back towards the transmitter (this gives it the name `backward
method'). Images which do not provide any paths are eliminated from the stored
data before any propagation calculations are made.
To illustrate the conditions that have to be met, Figure 7.7(a) shows a simple two-
wall situation. I
1
w
1
is the ®rst-order image of Tx in wall 1 and I
2
w
2
is the second-
order image, i.e. image of I
1
w
1
, in wall 2. We draw a line joining I
2
w
2
and the
receiver to establish the proper refection point on wall 2. Clearly the point P
2
does
not coincide with any physical point on wall 2, so the double re¯ection path Tx±w
1
±
w
2
±Rx does not exist in practice. It is clear from Figure 7.7(a) that a necessary
condition for the path to exist is that the re¯ection point P
2
coincides with a physical
location on wall 2 and that this is only possible if Rx lies in the illuminated area
de®ned by I
2
w
2
and wall 2. But this condition, although necessary, is not sucient.
Figure 7.7(b) shows Rx within the illuminated area, thus ensuring that the
necessary re¯ection point on wall 2 physically exists. In this case the necessary
re¯ection point on wall 1 is outside the physical limits of that wall, so again the
path does not actually exist. Now, however, it is easy to see what is necessary. We
have established that the re¯ection point P
2
on wall 2 exists physically, provided
206 The Mobile Radio Propagation Channel
Figure 7.6 The process of image generation.
Rx lies within the illuminated area shown. It follows that the necessary re¯ection
point P
1
on wall 1 also exists provided P
2
lies within the illuminated area de®ned
by I
1
w
1
and wall 1. Figure 7.7(c) illustrates this.
For the path to exist a necessary and sucient condition is that P
2
lies on that part
of wall 2 which lies within the illuminated area de®ned by I
2
w
2
and wall 2 and the
illuminated area de®ned by I
1
w
1
and wall 1. This is the shaded area in Figure 7.7(c).
It follows that if no part of wall 2 falls within the illuminated area de®ned by I
1
w
1
and wall 1 then the path being considered does not exist for any position of Rx within
the given illuminated area. In general, the above process can be applied recursively,
starting from Rx and working back towards Tx, to establish whether each of the
necessary re¯ection points physically exists along any multiple-re¯ection path.
One further idea is illustrated in Figure 7.7(d). Here both re¯ection points exist
and meet the above criteria, but Rx is on the `wrong' side of wall 2. This is a
Other Mobile Radio Channels 207
Figure 7.7 (a) The required re¯ection point P
2
on wall 2 does not exist; (b) the required
re¯ection point on wall 1 does not exist.
(a)
(b)
I
1
w
1
I
1
w
1
I
2
w
2
I
2
w
2
reminder that the images are virtual sources which can be used to compute the
re¯ected paths, but the de®ned illuminated area only exists on the side of the wall
remote from the image (the shaded area). Of course, in Figure 7.7(d) there is a single-
re¯ection path from Tx to Rx via wall 1, and for a dierent position of Rx within the
sector there could be a single re¯ection from wall 1 and subsequent transmission
through wall 2, but the path illustrated does not exist.
208 The Mobile Radio Propagation Channel
(c)
I
1
w
1
I
2
w
2
Figure 7.7 (c) Both re¯ection points exist, so the path is valid; (d) the receiver is not in the
illuminated area.
(d)
I
1
w
1
I
2
w
2
As an example we can return to Figure 7.6. In this case walls 1 and 2 meet all the
necessary conditions. Wall 3 does not produce a ray path, however, because
although the whole of wall 3 lies within the illuminated area of I
1
w
1
, the line
connecting I
2
w
3
and Rx is not in the illuminated area projected from I
2
w
3
.
To improve computational eciency in practice, prespeci®ed conditions are
introduced; for example, no rays which undergo more than n re¯ections or have a
strength more than X dB below that of the strongest path will be considered. As far
as the strength condition is concerned, rays can be attenuated by normal spreading
loss, by re¯ection, and by transmission through obstacles. However, as a very simple
example we consider a two-path situation comprising a direct ray and a single-
re¯ected ray and we impose the condition that the re¯ected ray will only be
considered if the power it produces at the receiver is greater than À30 dB relative to
the power of the direct ray. This gives
10 log
10
P
refl
P
dir
> À30 7:8
Since P G 1=d
2
, this can be expressed as
d
refl
< jrj
1000
p
d
dir
7:9
which means that a re¯ected ray path with a length less than jrj
1000
p
Â(the length
of the direct path) will be taken into account in the computation. The above
equation can be generalised for any order of re¯ection as
d
n
refl
< jrj
n
10
t
p
d
dir
7:10
where n is the order of re¯ection and t is the threshold index evaluated from
X dB 10
x=10
10
t
. It is a matter of judgment as to what threshold level is
appropriate in any given situation. Clearly if it is set too high then many weak paths
will be included and computation time will become quite high. On the other hand, if
it is set too low, accuracy will suer.
In summary, the last decade has seen the emergence of ray tracing as an important
technique for modelling microcell and indoor picocell propagation. Accuracy
depends crucially on the availability of up-to-date high-resolution databases and the
availability of computational techniques for extracting relevant information quickly
and in an appropriate form. The electrical properties of natural and man-made
materials that are used to construct walls, doors, windows, etc., also need to be
known with some accuracy. There have been investigations of the accuracy and
sensitivity of such methods [52±54] and comparisons with measurements [55]. Where
LOS paths exist, they are dominant and only strong low-order re¯ected paths need
to be considered. If there is no LOS path then it is necessary to consider multi-
re¯ected and diracted rays.
Diraction is a very important mechanism in some cases since despite the
complexity that it adds to the models, without it they would often fail completely in
non-LOS areas. Good accuracy has been reported with up to 7 orders of re¯ection
and 2 orders of diraction, although if computation time is important, 5 re¯ections
with 1 diraction appears a reasonable compromise for a coverage study. Default
Other Mobile Radio Channels 209
values of 10
À3
S/m for conductivity and 5 for relative permittivity gave reasonable
results (RMS prediction error $ 4 dB ) in a typical suburban area.
7.5 RADIO PROPAGATION IN TUNNELS
There have been some investigations of radio propagation in tunnels at frequencies
of interest for mobile communications. In the VHF band the attenuation is very high
[56] and it is only the use of highly directional antennas that makes communication
possible within tunnels over distances exceeding a few tens of metres. It is well
known that a car radio tuned to a normal FM broadcast station loses signal very
rapidly when the vehicle enters a tunnel. At higher frequencies there is some
improvement, although severe problems remain.
Propagation in tunnels is exempli®ed by an experiment conducted by Reudink [57]
in New York. He reports work undertaken in the Lincoln Tunnel that connects
Manhattan to New Jersey under the Hudson River. The tunnel has a rectangular
cross section of dimensions approximately 4 m67.5 m and is about 2425 m in length.
Propagation tests were made at seven frequencies between 153 MHz and 11.2 GHz
using transmitters located within the tunnel, about 300 m from the entrance. Figure
7.8 shows some of the results plotted on a logarithmic scale. Attenuation is very high
at VHF but decreases as the frequency is increased. Signal attenuation that follows a
simple d
n
law appears as a straight line with a slope that depends on the value of n.
Figure 7.8 shows that n is approximately 4 at 900 MHz, reducing to 2 at 2400 MHz.
Above this frequency the loss is less than the free space path loss, indicating that
some kind of guiding mechanism exists. At frequencies above 2.4 GHz the
attenuation is quite low, making it much more feasible to design a working
system. Theories of radio propagation in tunnels and similar structures have been
published [58,59].
210 The Mobile Radio Propagation Channel
Figure 7.8 Path loss within a tunnel at several dierent transmission frequencies (after Jakes).
In modern cities it is not uncommon to ®nd an underpass where major roads cross each
other. It has been reported [60, Ch. 2] that at 900 MHz a 10±15 dB drop in signal level can
be expected in these circumstances and radio communication systems can be severely
aected. In general, at frequencies used for mobile radio systems, propagation problems
in tunnels and underpasses are very severe and reliable communication cannot be
guaranteed. The best solution may involve the use of leaky feeders or rebroadcasting the
signal into the tunnel (maybe from both ends) using highly directional antennas.
7.6 PROPAGATION IN RURAL AREAS
7.6.1 Introduction
Multipath fading models of the type described by Aulin and Clarke have proved
adequate for the urban mobile radio channel. They predict that the statistical
distribution of the ®eld strength values follows a Rayleigh distribution, reaching
this conclusion by arguments based on superimposing a large number of
components having similar magnitudes scattered from dierent re¯ecting and
diracting obstacles in the immediate vicinity of the mobile. In practice this
situation does not always exist; we have seen (Section 7.3.1) that the fading
characteristics within buildings sometimes have Rician statistics.
In a rural area the number of scatterers may be quite small and the magnitudes of
the individual scattered components can vary, with line-of-sight paths being
common. The eect of these conditions is to cause the fast fading signal statistics
to be non-Rayleigh, and if system planners were to use the Rayleigh model then they
would overestimate the severity of the signal fading. The resultant design would
therefore be based on pessimistic modelling, so the transmitter power would be
unnecessarily high, possibly leading to interference problems.
Some general observations may be made from Figure 7.9, a recording of the fast
fading signal envelope measured at 900 MHz along a rural route. This represents
Other Mobile Radio Channels 211
Figure 7.9 Normalised recording of the signal received at a mobile moving along a rural
route and passing through a village.
data collected as the mobile travelled along a major road in the direction of the
transmitter and passed through a village.
There is an obvious change in the statistics of the received signal for the relatively
`open aspect' areas either side of the village. Referring to the arguments above, a
strong direct component may be received in these locations, and this will cause the
envelope statistics to dier from those in the surrounding areas. It would be
misleading simply to use the complete 2 km section of data shown here to estimate
the characteristics of the fast fading, since this route covers dierent types of terrain,
in each of which there may be a dierent signal distribution. A detailed investigation
is necessary to analyse the variations of the signal statistics along routes such as this.
Data extracted from Figure 7.9 reveals that there are large sections of rural routes
where the signal statistics do not conform to the Rayleigh distribution. A distinct
feature is that the topography of the area immediately surrounding the mobile has a
prominent in¯uence on the signal variability. In many relatively open areas, between
towns and villages, the Rayleigh model does not appear to be a good approximation
to the received signal statistics, whereas in built-up areas the statistics tend to
conform more readily to Rayleigh. This is a signi®cant conclusion as it means that, in
order to determine the eectiveness of the Rayleigh model within rural areas, the
eciency of the model should be investigated within discrete terrain environments.
Thus, small-scale signal variations have to be analysed within typical `small-area'
locations, such as towns, villages, rural lanes and woodland.
There is a noticeable correlation between the mean signal values and the signal
variability. For example, in locations where there is an increase in the mean signal
strength, there is a corresponding decrease in the standard deviation of the fast
fading envelope, and the measured CDF does not conform to Rayleigh statistics.
This is reasonable, because whenever a dominant signal component is received, there
is a reduction in the signal fading, accompanied by an increase in the local mean
signal value.
7.6.2 Signal statistics
Data collected in rural areas at 900 MHz [61] has been analysed in 200±300 m
sections to produce the cumulative distribution functions in Figure 7.10. These
distributions are plotted on Rayleigh-scaled paper with the theoretical Rayleigh
distribution shown as a broken line. Although some of the measured distributions
are well described by Rayleigh statistics, a signi®cant number are not; this
characteristic has also been observed by Suzuki [62] and Davis [63].
This discovery prompted a further investigation to establish the statistical
distribution which best described the signal envelope measured in rural areas. In
addition to the Rayleigh distribution, the Rice, Nakagami and Weibull distributions
were also considered because of their previous success in describing mobile radio
signals [64].
In order to compare the goodness-of-®t among the four distribution functions, a
minimum chi-squared (w
2
) analysis was made between the hypothesised and
experimental PDFs. The w
2
-distribution provides a non-parametic or distribution-
free test (i.e. the results do not depend on the shape or parameters of the underlying
distribution) for the goodness-of-®t of theoretical models. Comparisons between
212 The Mobile Radio Propagation Channel
theoretical populations and actual data are made by computing the w
2
-statistic,
de®ned as
w
2
X
observed frequency Àtheoretical frequency
2
theoretical frequency
7:11
To estimate the dierence between measured and theoretical PDFs, eqn. (7.11) can
be rewritten as
w
2
X
i
N
pw
i
Àpw
i
2
pw
i
7:12
where p(
.
) denotes the theoretical PDF,
p(
.
) denotes the estimated PDF, and N is the
total number of data samples.
In a minimum w
2
goodness-of-®t analysis the value of the w
2
-statistic not only
indicates the best theoretical model for the measured data, but also provides a
quantitative estimate of the goodness-of-®t for any hypothesised distribution
through reference to a w
2
-distribution table for the appropriate number of degrees
of freedom [65].
In the tests described above, the measured and theoretical PDFs of the logarithmic
signal strength values were compared by calculating the number of samples of the
fast fading signal within each 1 dB interval from À30 dB to 10 dB, i.e.
Other Mobile Radio Channels 213
Figure 7.10 Cumulative distributions of the normalised fast fading signal received in several
dierent rural environments: (
Ð
) measured results, (- - - -) Rayleigh distribution.
i À30, :::, 10 in eqn. (7.12). This technique, which essentially gives equal
importance to all measured values of signal strength, was used because the dynamic
range of the fast fading can be greater than 30 dB and an excessively large number of
points would have to be used to describe the four distribution functions accurately
on a linear scale. Also, since the signal strength is often measured in logarithmic
units, it is far simpler to calculate the experimental distributions in these units rather
than in linear units.
It is worth pausing for a very brief discussion about the validity of giving equal
weighting to all signal strength values. In previous research work [66] (Chapter 4) it
was suggested that reliable estimation of the quantiles near the tails of the
distribution is of greatest importance in practical planning situations. Thus, it was
argued that the most suitable model is the one which will predict, with the least error,
the quantiles between 1% and 20% at one end, and between 80% and 99% at the
other.
In the analysis, equal weighting was given to all values of the fast fading signal,
and therefore no emphasis was given to the tails of the distributions. However, in
preliminary w
2
goodness-of-®t tests, weighting factors were applied to both the tails
of the distributions and to values close to the mean signal level. This analysis
produced results, for dierent weighting factors, which were very close to those
obtained for equal weighting, and therefore indicated that little was to be gained by
emphasising particular sections of the distribution.
As the PDF of the received signal envelope was determined in terms of logarithmic
units, it was necessary to translate the theoretical distributions onto a logarithmic
scale. This transformation is given in Appendix C for the Rayleigh and Rician
distributions, and results can be obtained using the same method for the other two
distributions [62].
The PDF for a Rayleigh variable, expressed in decibels, is given by equation (C.6):
py
1
Ms
2
exp
2y
M
À
1
2s
2
exp
2y
M
7:13
If r has a Rician distribution, the PDF is expressed in terms of the parameter K by
eqn. (5.61). Alternatively, the PDF of y 20 log r) can be expressed by equation
(C.11):
py
1
Ms
2
n
exp
2y
M
À
1
2s
2
n
r
2
s
exp
2y
M
I
0
r
s
s
2
n
exp
y
M
7:14
If there is no dominant signal component then r
s
0, the Rician distribution reduces
to the Rayleigh distribution and eqn. (7.14) reduces to eqn (7.13).
If r has a Nakagami distribution then the PDF of y can be written as
py
2m
m
MÀm
"
u
m
exp
2my
M
À
m
"
u
exp
2y
M
7:15
where
"
u is the mean square value of r, with r expy=M. The parameter m is a
measure of the signal variability. If m 1 then eqn. (7.15) reduces to eqn. (7.13), i.e.
the PDF for a Rayleigh variable expressed in decibels.
Finally, the PDF for a Weibull variable, expressed in decibels, be written as:
214 The Mobile Radio Propagation Channel