Crystal structure, optical properties and biological imaging of two curcumin derivatives
Bạn đang xem bản rút gọn của tài liệu. Xem và tải ngay bản đầy đủ của tài liệu tại đây (848.57 KB, 6 trang )
Crystal structure, optical properties and biological imaging of two
curcumin derivatives
Guoyong Xu
a
, Dong Wei
b
, Jiafeng Wang
b
, Bo Jiang
b
, Mahong Wang
a
, Xuan Xue
b
,
Shuangsheng Zhou
a
,
b
,
*
, Baoxing Wu
b
,
c
, Minghua Jiang
c
a
Center of Modern Experimental Technology, Anhui University, Hefei 230039, PR China
b
Department of Pharmacy, Anhui College of Traditional Chinese Medicine, Hefei 230031, PR China
c
State Key Laboratory of Crystal Materials, Shandong University, Jinan 502100, PR China
article info
Article history:
Received 13 August 2013
Accepted 18 September 2013
Available online 9 October 2013
Keywords:
Curcumin derivative
Crystal structure
Optical property
Two-photon absorption cross-section
Photostability
Biological imaging
abstract
Two new curcumin derivatives, 1,7-bis(4-ethyloxy-3-methoxy-phenyl)-1,6-heptadiene-3,5-dione and
1,7-bis(4-butyloxy-3-methoxy-phenyl)-1,6-heptadiene-3,5-dione, are conveniently synthesized. Single
and two-photon fluorescence of two compounds have been investigated. The two-photon absorption
cross-sections (
s
) of the two compounds were calculated by quantum chemical method, which are as
high as 386 and 418 Â 10
À50
cm
4
s photon
À1
in dimethyl formamide (DMF), as well as up to 475 and
563 Â 10
À50
cm
4
s photon
À1
in dichloromethane, respectively. Furthermore, cellular imaging results
demonstrate that the as-prepared compounds have high photostability, strong fluorescence in the red
region and are nontoxic up to 40
m
mol/L, which are suitable for long-term and high-specificity immu-
nofluorescent cellular labeling.
Ó 2013 Elsevier Ltd. All rights reserved.
1. Introduction
Organic molecules with large two-photon absorption (TPA)
cross-section (
s
) have come to occupy a particularly practical po-
sition due to their applications in photodynamic cancer therapy
[1,2], lighting devices [3,4], microscopy [5,6], luminescent probes
for bio-analyses and live cell imaging and sensing [7e9]. Various
design strategies have been put forward to synthesize organic
molecules with large TPA cross-section, such as donor-
p
-bridge-
donor(D-
p
-D)-type molecules, donor-
p
-bridge-acceptor(D-
p
-A)-
type molecules, donoreacceptoredonor(DeAeD)-type molecules,
polymers, multibranched molecules and metal complexes. More-
over, their structureeproperty relationships were also studied [10e
13]. These investigated results demonstrate that D/A strength,
p
-
conjugation length, and molecular symmetry are important factors
responsible for the increasement of TPA cross-section.
For cell bioimagery application, it is necessary that TPA mate-
rials must be low toxic, long-term stable and remain highly fluo-
rescent in strongly polar solvents. Most of TPA materials, however,
are unstable, hydrophobic and their fluorescence quenches in polar
solvents. Therefore, molecular designs of TPA materials possessing
stable and strong fluorescence in polar solvents bring us a serious
challenge in real biosystem research.
Curcumin is a natural pigment with low toxicity and good sta-
bility obtained from the rhizomes of turmeric (Curcuma longa
Linn.), and it is a common ingredient used in spices, cosmetics, and
traditional chinese medicines in Asian countries [14,15]. In addi-
tion, curcumin exhibits good optical and electrical properties owing
to a highly
p
-electron delocalized system and symmetric structure
[16e19]. Considering the above-mentioned factors and design
strategies, in this article, we connect two types of electron-
donating end groups, ethyl and butyl, to the 4,4
0
-positions of cur-
cumin respectively, and then obtain two new donor-
p
-bridge-
donor(D-
p
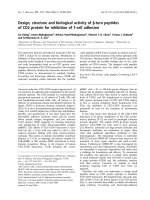
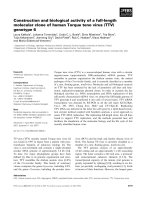
-D)-type curcumin derivatives A and B (Fig.1). It was
expected to improve the fluorescence properties and increase TPA
cross-section by means of such D-
p
-D-type molecular structures.
2. Experimental
2.1. General
Fourier transform infrared (FT-IR) spectra were recorded on
SHIMADZU IR Prestige-21 spectrophotometer with samples pre-
pared as KBr pellets.
1
H NMR spectra were recorded with Bruker
AV400 NMR spectrometer. The mass spectra were obtained on
FINNIGAN LCQ Advantage MAX LC/MS (Thermo Finnigan,
*
Corresponding author. Center of Modern Experimental Technology, Anhui
University, Hefei 230039, PR China. Tel.: þ86 551 65169291; fax: þ86 551 65169222.
E-mail address: (S. Zhou).
Contents lists available at ScienceDirect
Dyes and Pigments
journal homepage: www.elsevier.com/locate/dyepig
0143-7208/$ e see front matter Ó 2013 Elsevier Ltd. All rights reserved.
/>Dyes and Pigments 101 (2014) 312e31 7
American). Elemental analyses were performed on PerkineElmer
240C analyzer. X-ray power diffraction (XRD) measurements were
performed on Japan Rigaku DMax-
g
A rotation anode X-ray
diffractometer equipped with graphite monochromatize Cu KR
radiation (
l
¼ 0.71073
A) (shown in Table 1). Unit cell dimensions
were obtained with least-square refinements, and all structures
were solved by the direct method as SHELXL-97 [20]. The final
refinement was performed by full-matrix least-square methods
with anisotropic thermal parameters for non-hydrogen atoms on
F
2
. Ultravioletevisible (UVevis) absorption spectra were obtained
through SHIMADZU UV-3600 UVeviseNIR spectrophotometer.
Single-photon excited fluorescence (SPEF) spectra were recorded
on PerkinElmer LS55 fluorescence spectrometer equipped with a
450 W Xe lamp. The two-photon emission fluorescence (TPEF)
spectra were measured using a mode-locked Ti: sapphire laser(-
Coherent Mira 900F) as pump source with a pulse width of 200 fs, a
repetition rate of 76 MHz, and a single-scan streak camera
(Hamamatsu, model: C5680-01) together with a monochrometer as
the recorder. A Zeiss LSM510 two-photon microscope equipped
with a 63Â or 100Â oil-immersion objective was used to obtain
bright field transmission and two-photon images. The excitation
light was provided by a mode-locked Ti: sapphire laser (Mai Tai,
Spectra-Physics Inc., USA) tuned to 800 nm, and a broadband pass
filter (450e600 nm) was used as emission filter. The microscope
stage was outfitted with CTI-3700 incubator, which maintained
samples at 37
C and 5% CO
2
.
2.2. Preparation
The curcumin derivative A was prepared as follows: dime-
thylfomamide (20 mL) and curcumin (1.0 g, 2.7 mmol) were placed
into a 50 mL flask. After the curcumin was completely dissolved,
anhydrous potassium carbonate (1.2 g, 0.87 mmol) was added. The
mixture was stirred at 40
C, and then bromoethane (2 mL) was
slowly added dropwise to the above solution. Then the reaction
mixture was stirred for 5 h at 80
C. After completion of the reaction
(monitored by TLC), the mixture was dispersed and stirred in cold
water (50 mL). The yellow solid was obtained by filtration. The
product was purified by chromatography on a silica gel column
with ethyl acetate/petroleum ether mixture (v/v: 2/3) as the eluent,
then light yellow microcrystals were obtained, yield 54.4%. MS, m/z
(%): 424.47 (M
þ
, 100). Anal. Calcd for C
25
H
28
O
6
: C, 70.74; H, 6.65;
found: C, 70.58; H, 6.76.
The preparation of curcumin derivative B: curcumin (1.1 g,
3 mmol) was dissolved in methanol (30 mL), and anhydrous po-
tassium carbonate (0.88 g, 6.4 mmol) and redistilled bromobutane
(1.04 g, 6.2 mmol) were added into it. The reaction solution was
refluxed for 4 h under vigorous stirring. After the mixture was
cooled to room temperature, the reaction solution was added to
10 mL of water. The yellow solid was obtained by filtration. The
product was purified by chromatography on a silica gel column
with ethyl acetate/petroleum ether mixture (v/v: 1/3) as the eluent
and then the target compound was obtained, yield: 47.2%. MS, m/z
(%): 480.58 (M
þ
, 100). Anal. Calcd for C
29
H
36
O
6
: C, 72.47; H, 7.55;
found: C, 72.63; H, 7.74.
3. Results and discussion
3.1. Structural features
The single crystals of A and B, suitable for the X-ray analysis,
were obtained by slow evaporation of ethyl acetate at room tem-
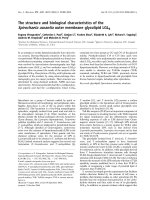
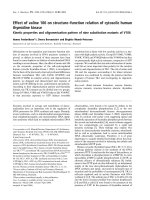
perature several days later. The structures of A and B are shown in
Fig. 2, which revealed that the molecular structures of A and B are
similar and also symmetric to our satisfaction. Selected bond
lengths (
A) and bond angles (
) listed in Table 2. For example, in the
molecular structure of A, the least-square plane calculation shows
that the dihedral angle between the two benzene rings is 8.2,
indicating that they are nearly coplanar. The sum of the three CeCe
C bond angles is 359.9
, which take carbon atom (C5) as center
(C6eC5eC7,118.7(3)
;C6eC5eC4,118.5(3)
;C4eC5eC7, 122.7(3)
).
This result demonstrates that the carbon atom (C7) is practically
coplanar with the benzene ring. In addition, the bond lengths of
C5eC7 (1.47.1(4)) and C8eC9 (1.455(7)) are longer than that of C7e
C8 (1.320(4)) and O3eC9 (1.304(4)), or the bond lengths of C14e
C13 (1.457(4)) and C12eC11 (1.449(4)) are longer than that of C12e
C13 (1.338(4)) and O4eC11 (1.301(3)), which confirm the formation
of
p
-conjugated system with the adjacent phenyl ring. It can be
seen from Table 2 that all the bond lengths of CeC are located
between the normal C]C double bond (1.32
A) and CeC single
bond (1.53
A), which demonstrates that it is a
p
-electron highly
delocalized system for the compound molecule A. That is necessary
condition for the compound to bear a large TPA cross-section
s
[21,22]. Furthermore, it can also be seen from Fig. 2 that the com-
pound A exists in the enol form in solid state.
Fig. 1. The molecular structure of the curcumin derivatives A and B.
Table 1
Crystal data collection and structure refinement.
Compound AB
Formula C
25
H
28
O
6
C
29
H
36
O
6
Formula weight 424.47 480.58
Crystal system Monoclinic Monoclinic
Space group P2(1)/n P2(1)/c
Temperature/K 298(2) 298(2)
Radiation/
A (MoKa) 0.71069 0.71069
Absorption coefficient (mm
À1
) 0.086 0.083
a (
A) 22.689(5) 25.387(5)
b (
A) 4.913(5) 4.999(5)
c (
A) 23.224(5) 22.849(5)
b
(
) 115.744(5) 114.022(5)
V/
A 2332(2) 2649(3)
Z 44
D (calc)/g cm
À3
1.209 1.205
F (000) 904 1032
q
(
) 1.05e25 0.88e25
Reflections/unique 15081/4099 17721/4637
R(int) 0.0461 0.0253
Data/restraints/parameters 40996/0/285 4637/0/321
Final R indices [I > 2
s
(I)] R1 ¼ 0.0503,
wR2 ¼ 0.1368
R1 ¼ 0.0611,
wR2 ¼ 0.1701
Gof on F
2
1.001 1.028
G. Xu et al. / Dyes and Pigments 101 (2014) 312e317 313
3.2. Linear absorption spectra and single-photon excited
fluorescence (SPEF)
The photophysical data of the two new curcumin derivative
chromophores in four different solvents are summarized in Table 3
(corresponding figures are given in the Supplementary Fig. S3 and
Fig. S4). We observe that all chromophores display an intense ab-
sorption in the near UVeVis region. Their absorption and emission
range were changed with variation of the nature of the end-groups
and polarity of the solvents. All chromophores exhibit high fluo-
rescence quantum yields in the different polar solvents. In addition,
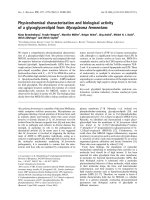
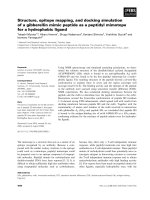
the linear absorption spectra of the compound A and B in DMF
(c ¼ 1.0 Â 10
À5
mol/L) were shown in Fig. 3a. From Fig. 3a, we can
see that the maximum absorption wavelength is located at 419 nm
for A (with the corresponding mole absorption coefficient
3
¼ 2.54 Â 10
4
) and 418 nm for B (with the corresponding mole
absorption coefficient
3
¼ 2.92 Â 10
4
), which is attributed to
p
e
p
*
transition of each compound, respectively [23,24]. There is no
linear absorption in the spectral range from 500 to 800 nm. The
single-photon excited fluorescence spectra of the compound A and
B were shown in Fig. 3b, which were measured at the same con-
centration in DMF as that of the linear absorption spectra. It shows
that the maximum emission wavelength of the two compounds is
about 510 nm in DMF solution.
3.3. Two-photon excited fluorescence (TPEF) and TPA cross-section
The TPEF spectra of the compound A and B in DMF
(c ¼ 1.0 Â 10
À5
mol/L) are shown in Fig.3c. From the previous linear
absorption spectra, we know that there was no linear absorption in
the range of 500e800 nm for two initiators. It suggested that there
were no molecular energy levels corresponding to this spectral
range, which should be obviously attributed to two-photon-excited
fluorescence (TPEF) mechanism. As shown in Fig. 3b and c, the
fluorescence spectra excited by SPA and TPA locate in the same
spectral region and have almost identical shapes, which confi rm
that the emitting states are the same for both processes. Thus, it can
Fig. 2. Molecular structure of A and B showing 50% probability displacement.
Table 2
Selected bond lengths (
A) and angles (
) of the compound A and B.
AB
Bond length
C5eC7 1.471(4) 1.450(3)
C7eC8 1.320(4) 1.329(4)
C8eC9 1.475(4) 1.457(4)
O3eC9 1.304(4) 1.278(3)
C9eC10 1.386(4) 1.399(4)
C10eC11 1.404(4) 1.384(4)
O4eC11 1.301(3) 1.293(3)
C11eC12 1.449(4) 1.447(4)
C12eC13 1.338(4) 1.323(3)
C13eC14 1.457(4) 1.453(4)
Bond angle
C6eC5eC4 118.5(3) 118.0(2)
C6eC5eC7 118.7(3) 123.0(2)
C4eC5eC7 122.7(3) 119.0(2)
C19eC14eC15 117.6(2) 117.5(2)
C19eC14eC13 120.0(2) 122.5(2)
C15eC14eC13 122.3(2) 120.0(2)
Table 3
The photophysical properties of the two curcumin derivative chromophores in
different solvents.
Comd. Solvent
l
max
abs
/nm
3
/10
4
l
max
1f
/nm
F
a
Dn
b
s
c
A CH
2
Cl
2
415 4.73 503 0.23 4219 475
CH
3
Cl 422 4.02 516 0.25 4320 427
DMF 419 2.54 512 0.21 4379 386
DMSO 423 2.13 521 0.27 4407 364
B CH
2
Cl
2
414 5.21 496 0.19 3939 563
CH
3
Cl 415 4.18 505 0.22 4298 502
DMF 418 2.92 508 0.25 4415 418
DMSO 422 2.37 521 0.26 4506 382
l
max
abs
and
l
max
1f
represent the maximum wavelength of linear absorption and single-
photon fluorescence, respectively. It is filtered through a 0.2 mm Gelman acrodisc
CR filter.
a
Quantum yield (
F
) at room temperature was determined with coumarin
(
F
r ¼ 0.21 in ethanol) as a reference.
b
Stokes shift in cm
À1
.
c
Two-photon absorption cross-section in GM
(1 GM ¼ 10
À50
cm
4
s photon
À1
molecule
À1
).
G. Xu et al. / Dyes and Pigments 101 (2014) 312e317314
be assumed that the fluorescence quantum yield does not change
whether SPA or TPA is applied. Furthermore, the TPEF positions of
the compounds in the same solvent show little red shift relative to
their corresponding SPEF positions at the same concentration. The
TPA cross-section
s
was measured by comparing the TPEF intensity
of the sample with that of a reference compound by the following
equations [25,26]:
F
S
¼
F
r
A
r
ð
l
r
Þ
A
s
ð
l
s
Þ
Ið
l
r
Þ
Ið
l
s
Þ
n
2
s
n
2
r
Z
F
s
Z
F
r
s
s
¼
F
s
*
F
r
*C
r
*n
r
F
r
*
F
s
*C
s
*n
s
s
r
Here, where V is the quantum yield, n is the refractive index, I(
l
)
is the relative intensity of the exciting light, A(
l
) is the absorbance
of the solution at the exciting wavelength
l
,
R
F is the integrated
area under the corrected emission spectrum. F stands for the in-
tegral intensity of the TPEF peak. C is the concentration of the so-
lution in mol L
À1
. Subscripts s and r refer to the sample and
reference solutions, respectively. The value of
s
r
was taken from the
literature [27,28]. The experimental errors are estimated to be Æ10%
originating from sample concentrations and instruments.
The experimental results showed that the optimal excitation
wavelengths of the compounds locate at 740 nm in DMF (Fig. 3d),
which are suitable for bioimaging in the near IR range. The highest
cross-section values of
s
of the compounds A and B are 386 and
418 GM (1 GM ¼ 10
À50
cm
4
s photon
À1
molecule
À1
) in DMF solu-
tion, respectively.
3.4. Cytotoxicity assay and biological images of two-photon
microscopy
Cytotoxicity is a potential side effect that must be controlled
when dealing with living cells or tissues. So cytotoxicity assays
were investigated in MCF-7 cells (human breast cancer cell line) by
the MTT assay (Table 4). The results suggested that the compound A
and B at low-micromolar concentrations did not cause significant
reduction in cell viability over a period of at least 24 h and should
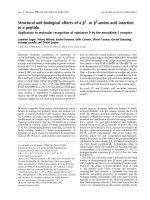
be safe for further biological studies. As two curcumin derivatives
have relatively low toxicity toward living cells, the fluorescent
images of MCF-7 cells labeled with two compounds were captured
by two-photon microscopy (TPM), respectively. In order to mini-
mize the side effect of organic solvents toward live cells, both A and
B were dissolved in DMSO at a high concentration (0.2 mM) and
diluted with PBS (phosphate buffer solution) to a working con-
centration (5.0
m
M). MCF-7 cells were stained with A and B,
respectively, and cultured in growth media at 37
C, 5% CO
2
for 2 h,
then washed by PBS and directly moved to confocal laser scanning
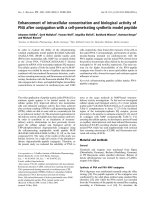
microscopy without fixation. TPM images (Fig. 4a and b) of MCF-7
cells were successfully taken, which clearly display the cytoplasmic
distribution.
To further clearly verify their fluorescence stability as fluores-
cent cellular probes, MCF-7 cells were labeled with both the com-
pound A and a nuclear dye propidiumiodide (PI, a commercially
available organic dye) simultaneously. It (Fig. 4c.) displays the
bright green colored compound A outside the nuclei and the red-
colored dye PI inside the nuclei, respectively. The fluorescence of
A and PI in the same cells were monitored under the same
Fig. 3. Linear absorption (a), SPEF (b) and TPEF (c) spectra of the compounds in DMF. (d) TPA cross-section of the compounds in DMF versus excitation wavelengths of identical
energy of 0.380 W.
Table 4
Data of MCF-7 cell survival% (24 h).
Compd. Concen. (
m
M)
10 20 40 80
A 98.6 90.4 80.3 61.8
B 98.2 88.7 74.4 56.3
G. Xu et al. / Dyes and Pigments 101 (2014) 312e317 315
continuous light exposure (480 nm). It can be seen from Fig. 4c that
the green fluorescent signals of the compound A were very stable
against photobleaching throughout the imaging period of 240 s,
while the red fluorescence signals of PI disappeared in 90 s. The
results further confirmed the stability of the compound.
4. Conclusions
Two novel curcumin derivative chromophores have been syn-
thesized and characterized. To our satisfaction, the obtained com-
pounds dissolved in high polar solvents have good luminescence in
the near-infrared (NIR) region (bio-safety window). Additionally,
the fluorescent images of two-photon microscopy of MCF-7 cells
labeled with the compound A and B indicated that the as-prepared
compounds are better candidates for the TPM images because of
their larger TPA cross-section
s
, high photostability and low toxicity
to the living cells. Our results in this paper provided a valuable
reference for curcuminoid compounds to use in biological imaging
or optical fields.
Acknowledgments
This work was supported by a grant for the National Natural
Science Foundation of China (21071001), Department of Education
Committee ofAnhui Province (KJ2010A222), andthe Natural Science
Foundation of Anhui Province (1208085MH273,11040606Q03), and
the Natural Science Foundation of Anhui Unversity of Traditional
Chinese Medicine (2011zr005A).
Appendix A. Supplementary data
Supplementary data related to this article can be found at http://
dx.doi.org/10.1016/j.dyepig.2013.09.034.
References
[1] Beverina L, Crippa M, Landenna M, Ruffo R, Pagani G. One- and two-photon
singlet oxygen photosensitizers: design, synthesis, and characterization.
J Am Chem Soc 2008;30:1894e902.
[2] El-Sayed IH, Huang XH, El-Sayed MA. Surface plasmon resonance scattering
and absorption of anti-EGFR antibody conjugated gold nanoparticles in cancer
diagnostics: applications in oral cancer. Nano Lett 2005;5(5):8298e301.
[3] He GS, Tan LS, Zheng QD, Prasad PN. Multiphoton absorbing materials: mo-
lecular designs, characterizations, and applications. Chem Rev 2008;108:
1245e55.
[4] Pawlic ki M, Collins HA, Denning RG, Anderson HL. Two-photon absorp-
tion and the desi gn of two -photon dyes. Angew Chem Int Ed 2009;48:
3244e66.
[5] Helmchen F, Denk W. Deep tissue two-photon microscopy. Nat Methods
2005;2:932e40.
[6] Yelin D, Oron D, Thiberge S, Moses E, Silberberg Y. Multiphoton plasmon-
resonance microscopy. Opt Express 2003;11(12):185e91.
[7] Lee JH, Lim CS, Tian YS, Han JH, Cho BR. A two-photon fluorescent probe for
thiols in live cells and tissues. J Am Chem Soc 2010;132:1216e7.
[8] JiangYH,WangYC,HuaJL,TangJ,LiB,QianSX,etal.Multibranchedtri-
arylamine end-capped triazines with aggregation induced emission and
large two-photon absorption cross-sections. Chem Commun 2010;46:
4689e91.
[9] Wang B, Wang YC, Hua JL, Jiang YH, Huang JH, Qian SX, et al. Starburst tri-
arylamine donoreacceptoredonor quadrupolar derivatives based on cyano-
substituted diphenylaminestyrylbenzene: tunable aggregation-induced
emission colors and large two-photon absorption cross sections. Chem Eur J
2011;17:2647e55.
[10] Zhou X, Ai-Min Ren AM, Feng JK, Liu XJ, Zhang JX, Liu JZ. One- and two-photon
absorption properties of novel multi-branched molecules. Phys Chem Chem
Phys 2002;4:4346e52.
[11] Chung SJ, Kim KS, Lin TC, He GC, Swiatkiewitz J, Prasad PN. Cooperative
enhancement of two-photon absorption in multi-branched structures. J Phys
Chem B 1999;103:10741e5.
[12] Luo Y, Normal P, Macak P, Agren H. Solvent-induced two-photon absorption
of a pushepull molecule. J Phys Chem A 2000;104:4718e22.
[13] Ehrlich JE, Wu XL, Lee IYS, Hu ZY, Röckel H, Marder SR, Perry JW. Two-photon
absorption and broadband optical limiting with bis-donor stilbenes. Opt Lett
1997;22:1843e5.
[14] Sneharani AH, Karakkat JV, Singh SA, Appurao AG. Interaction of curcumin
with
b
-lactoglobulin; stability, spectroscopic analysis, and molecular
modeling of the complex. J Agric Food Chem 2010;58:11130e9.
[15] Safavy A, Raisch KP, Mantena S, Sanford LL, Sham SW, Krishna NR, et al. Design
and development of water-soluble curcumin conjugates as potential anti-
cancer agents. J Med Chem 2007;50:6284e8.
[16] Liu K, Guo TL, Chojnacki J, Lee HG, Siedlak SL, Zhang SJ. Bivalent ligand con-
taining curcumin and cholesterol as a fluorescence probe for A
b
plaques in
Alzheimer’s disease. ACS Chem Neurosci 2012;3(2):141e6.
[17 ] Sa gnou M, Benaki D, Triantis C, Pelecanou M. Curcumin as the O, O
bid enta te ligand in “2 þ 1” complexes with the [M(CO)3]
þ
(M ¼ Re,
99m
Tc)
tricarbonyl core for radiodiagnostic applications. Inorg Chem 2011 ;50:
1295e303.
[18] Began G, Sudharshan E, Sankar KU, Rao AGA. Interaction of curcumin with
phosphatidylcholine: a spectrofluorometric study. J Agric Food Chem
1999;47:4992e7.
[19] Chen ZG, Zhu L, Song TH, Chen JH, Guo ZM. A novel curcumin assay
with the metal io n Cu (II) as a simple probe by resonanc e light sc at-
tering technique. Spectrochim Acta A Mol Biomol Spectrosc 2009;72(3):
518e22.
[20] Sheldrick GM. SHELXS97 and SHELXS-97. Göttingen: University of Göttingen;
1997.
[21] Zhou HP, Li DM, Zhang JZ, Zhu YM, Wu JY, Hu ZJ, et al. Crystal structures,
optical properties and theoretical calculation of novel two-photon polymer-
ization initiators. Chem Phys 2006;322:459e70.
[22] Tian YP, Li L, Zhang JZ, Yang JX, Zhou HP, Wu JY. Investigations and facile
synthesis of a series of novel multi-functional two-photon absorption mate-
rials. J Mater Chem 2007;17:3646e54.
Fig. 4. (a) TPM image of MCF-7 cells incubated with 5
m
M A (left) and overlap (right). (b) TPM image of the same cells containing 5
m
M B (left) and overlap (right). (c) The fluorescent
imaging of the MCF-7 cells labeled with the compound A (green) and PI (red) at different times under continuous light exposure (all the scale bars represent 10
m
M). (For
interpretation of the references to color in this figure legend, the reader is referred to the web version of this article.)
G. Xu et al. / Dyes and Pigments 101 (2014) 312e317316
[23] Li L, Tian YP, Yang JX, Sun PP, Wu JY, Zhou HP. Facile synthesis and systematic
investigations of a series of novel bent-shaped two-photon absorption chro-
mophores based on pyrimidine. Chem Asian J 2009;4:668e80.
[24] Zhou ShuangSheng, Xue Xuan, Wang Jia Feng, Dong Yi, Jia Yong. Synthesis,
optical properties and biological imaging of the rare earth complexes with
curcumin and pyridine. J Mater Chem 2012;22:22774e80.
[25] Demas JN, Crosby GA. The measurement of photoluminescence quantum
yields. J Phys Chem 1971;75:991e1024.
[26] Albota MA, XuC, WebbWW. Two-photon fluorescence excitation crosssections
of biomolecular probes from 690 to 960 nm. Appl Opt 1998;37:7352e6.
[27] Zhou SS, Zhang Q, Tian XH, Hu GJ, Hao FY, Wu JY, et al. Synthesis, crystal
structure, optical properties, DNA-binding and cell imaging of an organic
chromophore. Dyes Pigment 2011;92:689 e 95.
[28] Wang XC, Tian XH, Zhang Q, Sun PP, Wu JY, Zhou PP, et al. Assembly, two-
photon absorption, and bioimaging of living cells of a cuprous cluster. Chem
Mater 2012;24:954e61.
G. Xu et al. / Dyes and Pigments 101 (2014) 312e317 317

![Báo cáo khoa học: Properties and significance of apoFNR as a second form of air-inactivated [4Fe-4S]ÆFNR of Escherichia coli pot](https://media.store123doc.com/images/document/14/rc/at/medium_ata1395562826.jpg)