Thông tin thiết kế mạch P6 doc
Bạn đang xem bản rút gọn của tài liệu. Xem và tải ngay bản đầy đủ của tài liệu tại đây (435.12 KB, 26 trang )
6
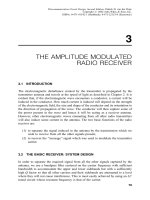
THE TELEVISION TRANSMITTER
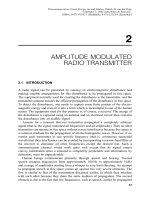
6.1 INTRODUCTION
The transmission of video images depends on a scanning device that can break up
the image into a grid and measure the brightness of each element of the grid. This
information can be sent serially or in parallel to a distant point and used to reproduce
the image. It is evident that the smaller the size of the grid element, the better the
definition of the image.
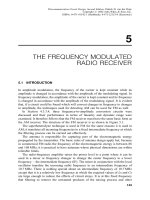
One of the simplest devices which can measure the brightness of light is the
phototube. It consists of a cathode which is coated with a material which gives off
electrons when light is shone on it and an anode which can collect the emitted
electrons when a suitable voltage is applied to it. The cathode and anode are
enclosed in an evacuated glass envelope. The number of electrons emitted by the
cathode is proportional to the intensity of the light impinging on it. Assuming
complete collection of the electrons, the current in the resistor R shown in Figure 6.1
will be proportional to the light intensity and so will the voltage across R.
A primitive video signal can be generated by using a 3 Â 3 matrix made up of
phototubes as shown in Figure 6.2.
For simplicity we assume that the tree is black and its background is white. A
suitable lens focuses the image of the tree onto the matrix of phototubes. It is clear
that the voltage output from phototubes (1,1), (1,3), (3,1) and (3,3) will be high; all
others will be low. The voltages so obtained can be transmitted and used to control
the brightness of a corresponding 3 Â 3 matrix of lights at a distant point giving a
vague idea of what the tree looks like! The picture detail can be improved by
increasing the number of elements in the matrix so that each element corresponds to
the smallest area possible. The assumption of a black tree on a white background is
no longer necessary since, with increasing detail, different shades of grey can be
accommodated.
The information may be sent along individual wires linking the phototube to the
light matrix (parallel transmission) but this would be very expensive and impractical
161
Telecommunication Circuit Design, Second Edition. Patrick D. van der Puije
Copyright # 2002 John Wiley & Sons, Inc.
ISBNs: 0-471-41542-1 (Hardback); 0-471-22153-8 (Electronic)
for any system other than the simple one described here. A better system would be
one in which the voltage from each phototube is scanned in some given order and the
voltage and position of each phototube are sent on a single wire to the receiving end
for reconstruction (serial transmission). The price to be paid for reducing the number
of wires is the increased complexity introduced by the scanner and a system for
coding and decoding the voltage and position information at the transmitter and
receiver, respectively.
6.2 SYSTEM DESIGN
Figure 6.3 shows the basic components of a television transmitter. A system of
lenses focus the image onto a camera tube which collects and codes the information
about the brightness and position of each element of the matrix forming the picture
by scanning the matrix. A pulse generator supplies pulses to the camera to control
the scanning process. The output from the camera goes to a video amplifier for
amplification and the addition of extra pulses to be used at the receiver for decoding
purposes.
Figure 6.2. Generation of a primitive video signal using a 3 Â 3 matrix of phototubes.
Figure 6.1. The phototube with its added circuitry to convert light intensity to voltage.
162 THE TELEVISION TRANSMITTER
A microphone picks up the sound associated with the picture and after
amplification the signal is fed to the audio terminal of a frequency modulator. The
carrier signal supplied to the modulator is a 4.5 MHz signal, generated by a crystal-
controlled oscillator at a lower frequency and multiplied by an appropriate factor.
The FM signal carrying the audio information is added to the video signal. The
output of the video amplifier consisting of the video signal, receiver control pulses,
and the frequency modulated signal is fed to the amplitude modulator. The carrier of
the amplitude modulator is supplied by a second crystal oscillator and associated
multiplier which produce a signal of frequency which lies within the band 54–
88 MHz (VHF). The radiofrequency power amplifier boosts the power to the legally
determined value and the vestigial sideband filter removes most of the lower
sideband signal before it goes to the antenna for radiation.
6.3 COMPONENT DESIGN
6.3.1 Camera Tube
6.3.1.1 Iconoscope. The first practical video camera tube invented by the
American scientist Vladimir Zworykin [4,5] is best viewed as a progression from
the primitive phototube arrangement discussed earlier. In Zworykin’s iconoscope he
Figure 6.3. A block diagram of the television transmitter.
6.3 COMPONENT DESIGN 163
replaced the matrix of phototubes with what he called the mosaic. This was made up
of a very large number of droplets of photosensitive material on one side of a sheet
of mica. The other side of the mica sheet was covered with a very thin layer of
graphite – the signal plate. A cross-section of the iconoscope is shown in Figure 6.4.
The mosaic and the signal plate constitute a large number of tiny capacitors which
share one common plate. When the image is projected onto the mosaic, each
individual droplet of photosensitive material emits electrons proportional to the light
intensity. These electrons are collected by an anode placed close to the mosaic. The
mosaic is now a picture ‘‘painted with electric charge’’. The transformation of the
charge into a voltage output is carried out by the electron gun and the associated
circuitry.
The electron gun produces a very narrow beam of electrons focussed on the
mosaic. The arrival of these new electrons have the effect of ‘‘discharging’’ the tiny
capacitor on which they fall. Since the number of electrons required to discharge the
capacitor is proportional to the charge induced by the light intensity, the electron gun
current is a function of the charge present and hence of the light intensity. The
electron gun current is then proportional to the voltage which appears across the
resistor R.
In order to transform the picture into a video signal, it is necessary to make the
beam of electrons sweep across the mosaic in a series of orderly lines. The electron
gun has two deflection systems for scanning the picture. The first moves the electron
beam at a constant speed along a horizontal straight line and returns it very quickly
to the start ready for the next sweep (horizontal trace). The second system controls
Figure 6.4. A cross-sectional view of the iconoscope. The two parts of the anode are cylinders
formed on the inner wall of the tube and neck. Reprinted with permission from H. Pender and
K. McIlwain (Eds) Electrical Engineers Handbook, 4th Ed., Wiley, 1967, pp. 15–21.
164 THE TELEVISION TRANSMITTER
the vertical position of the beam and ensures that each line is swept before returning
the beam to the top of the picture ready for the next frame (vertical trace).
Two major disadvantages of the iconoscope are the high light intensity required to
obtain acceptable quality images and the production of secondary electrons from the
photosensitive material during the scanning process. The secondary electrons cause
noise (false information) in the video signal. In due course, the iconoscope was
replaced by the image orthicon, another invention of Zworykin.
6.3.1.2 The Image Orthicon. In the image orthicon [6] the two functions of the
mosaic in the iconoscope, which are (a) the production of the image in terms of
charge and (b) the target for the electron beam scan, are separated. Figure 6.5 shows
a cross-section through the image orthicon.
The camera lens focusses the image onto the photocathode. Every small segment
of the photocathode emits electrons proportional to the amount of light falling on it.
The electrons are attracted to the target by the positive voltage applied to it. The
focus coil creates a magnetic field which ensures that the electrons travel to the target
in straight parallel paths. The target is a very thin sheet of glass which has a high
conductivity through its thickness but low conductivity across points on its surface.
The electrons striking the target dislodge secondary electrons from the photocathode
side of it and are immediately captured by the very fine wire mesh, called the target
screen, which has a relatively low positive voltage on it. This leaves a positive charge
on the photocathode side of the target. Due to the high conductivity through the
thickness of the target an identical pattern of positive charge is produced on the other
side of it.
The electron gun positioned at the other end of the evacuated tube produces a
narrow stream of electrons which are accelerated towards the target by the high
positive voltage on the accelerator anode. The accelerator anode is a graphite
coating on the inside of the neck of the tube. If the electrons were allowed to strike
the target without any control of their speed, it is clear that they will produce
secondary electrons. To control the speed of the electrons on arrival at the target, a
second ring of graphite coating, called the decelerator grid, is provided. By adjusting
the voltages on the accelerator anode and the decelerator grid, the speed of the
electron stream at the target can be controlled to ensure that no secondary electrons
are emitted. The electron stream striking an elemental area of the target uses up some
of the electrons to neutralize the positive charge left there by the image. The
remaining electrons are attracted in a backward direction by the accelerating anode
but they take a different path. By placing an electron collector in the appropriate
position in the neck of the tube, the returning electrons can be collected and
amplified by an electron multiplier. The output of the electron multiplier is converted
into a voltage inversely proportional to the amount of light impinging on the
elemental area of the photocathode. By using a scanning system in conjunction with
the electron gun (deflection coil), the complete image can be produced at the output
in the form of a varying voltage which is a function of the brightness of all the
elements of the image projected on the photocathode.
6.3 COMPONENT DESIGN 165
Figure 6.5. A cross-sectional view of the image orthicon. Reprinted with permission from V. K.
Zworykin and G. Morton, Television, 2nd Ed., RCA, 1954, p. 367.
166
6.3.1.3 Vidicon. The vidicon is not as sensitive as the image orthicon but it is
generally smaller in size and therefore well adapted to field applications such as
surveillance, where high resolution is not critical. Its principle of operation is
different from both the image orthicon and the earlier iconoscope since it relies on a
change of photoconductivity as a function of light intensity. An electron scanning
system is used to extract the video information.
6.3.2 Scanning System
In Section 6.3.1, the role of the electron beam scanning system in the production of
the video signal was discussed. A series of pulses are generated which control the
initiation of the horizontal sweep of the electron beam across the target (horizontal
trace) from the left-hand side to the right. A blanking pulse is used to cut off the
beam while it is returned to the left-hand side ready for the next sweep (harmonic
retrace). During this period, the vertical trace circuit moves the beam down just the
right distance for the second line to be swept. When the whole frame has been
scanned, a reset pulse returns the beam to the top left-hand corner ready to repeat the
process. The beam is blanked during the reset. All the control pulses are added to the
video signal and used at the receiver to synchronize the receiver to the transmitter.
All the pulses are derived from the 60 Hz power supply or from a 31.5 kHz crystal
controlled oscillator and divided down to the appropriate frequency.
Black-and-white television in North America uses 525 horizontal lines of scan to
cover the image. If the lines were scanned sequentially, the persistence of the
phosphor on the first line would have faded before the last line would have been
scanned. This would lead to an annoying flicker on the picture tube, especially at
high levels of brightness. The scan is therefore interlaced, that is, all odd numbered
lines are scanned first from 1 to 525 and then the beam is returned to line 2 and all
even numbered lines are then scanned. So each frame has 525=2 lines and they are
scanned 60 times per second. This means that there are 262:5 Â60 lines scanned per
second. The horizontal scan therefore operates at 15.75 kHz. It must be pointed out
that not all the 525 lines are used for picture production; some are used for vertical
retrace and other controls as well as equalization and synchronizing purposes.
The period for the horizontal scan is 63 ms and it is divided up into 56 ms for the
trace and 7 ms for the retrace. The beam deflection system is therefore required to
move the beam from the left of the picture to the right in 56 ms and return it in 7 ms.
The mechanism for deflecting the electron beam relies on the fact that, when a
current-carrying conductor is placed in a magnetic field, the conductor experiences a
force mutually orthogonal to the field and the direction of the current. Motion will
occur if the conductor is free to move. In the camera tube, the electron gun and its
associated components produce a stream of electrons. Each of these electrons carries
a charge and a moving charge is a current. The electron beam therefore experiences a
force on it and, since it is free to move, it will be deflected from its original path.
Figure 6.6(b) illustrates the situation.
Consider the current in the conductor (the electron beam) to be flowing into the
plane of the page. The ‘‘right-hand rule’’ gives the direction of the magnetic flux B
i
6.3 COMPONENT DESIGN
167
associated with the current in the conductor as concentric circles in a clockwise
direction. Assuming the conductor is placed in a magnetic flux B
f
which is in the
vertical upward direction, the two fluxes will interact to produce the distorted field
shown in Figure 6.6(b). The flux on the left of the conductor is strengthened while
that on the right is weakened; the conductor therefore moves to the right. When
trying to determine the direction of electron deflection, it is necessary to remember
that electron flow is opposite to current flow.
The deflection of the electron beam therefore depends on designing a circuit to
supply the appropriate current to the horizontal deflection coil so that it produces a
magnetic field which is a linear ramp with respect to time. The vertical deflection
system also has to be supplied with a current which produces a linear ramp magnetic
field and its operation has to be synchronized to the horizontal trace so that it repeats
the process after 262.5 cycles.
The video signal, the control pulses, and the output of the FM modulator are
combined in the video amplifier. A typical composite video signal is shown in Figure
6.7. Note the following:
(1) Only horizontal synchronizing pulses are shown ($5 ms); vertical synchro-
nization pulses ($190 ms) are distinguished from the horizontal ones by the
difference in their width.
(2) The blanking pulse starts before and ends after the horizontal synchronization
pulse.
(3) The video signal contains the radio-frequency carrier of 4.5 MHz frequency
modulated by the audio signal.
Figure 6.6. (a) The magnetic field, B
i
due to a current, i flowing perpendicular to the page
superimposed on a uniform magnetic field, B
f
, with no interaction. (b) The combined effect of the
two magnetic fields generates a force mutually at right angles to the conductor and magnetic
field.
168 THE TELEVISION TRANSMITTER
The spectrum of the composite signal at the output of the video amplifier is
shown in Figure 6.8.
6.3.3 Audio Frequency and FM Circuits
Various audio frequency amplifiers were discussed in Section 2.7. The design of the
crystal oscillator was discussed in Section 2.4.7 and the frequency multiplier in
Section 2.5. Design details for the FM modulator can be found in Section 4.4.
Figure 6.8. The spectrum of the composite video showing the FM carrier used for the
transmission of the audio signal.
Figure 6.7. A typical composite video signal with blanking and horizontal synchronization
pulses.
6.3 COMPONENT DESIGN 169
6.3.4 Video Amplifier
6.3.4.1 Calculation of Bandwidth. Ideally, a video signal consists of frequen-
cies from zero (dc) to some high frequency. The dc response is required when large
areas of black, white or other intermediate shades have to be transmitted. The limit
of the high-frequency response is determined by the resolution required for a single
vertical black line on a white background or vice versa. The minimum visible
horizontal line has a height (width) equal to the width of the horizontal trace. To
keep the same resolution for the horizontal as for the vertical line, the video signal
must go from white to black in
56=525 ms ¼ 0:11 ms:
The lowest frequency that can change from peak positive to peak negative is a
sinusoid as depicted in Figure 6.9. Note that the period of the sinusoid is 2 Â 0:11 ms
or 0.22 ms.
It has been determined from psychological experiments that a picture that has a
ratio of horizontal-to-vertical dimension less than 4 : 3 is not pleasing to look at. This
ratio has been adopted as standard for all video equipment. It is referred to as the
aspect ratio. Taking the aspect ratio into account, one cycle of the sinusoid shown in
Figure 6.9 must take 0:22 Â 3=4 ms, (i.e., the period T ¼ 0:16 ms). The lowest
frequency that must be present in the video signal for it to be able to reproduce the
vertical black line on a white background with the same resolution as a horizontal
black line on a white background is given by
f ¼
1
T
¼ 6:25 MHz: ð6:3:1Þ
This means that all the video circuits in the system must have bandwidths equal to or
greater than 6.25 MHz. Note that the bandwidths of the sub-circuits must be greater
than 6.25 MHz because cascading reduces the system bandwidth compared to that of
the individual sub-circuit.
Figure 6.9. The sine wave shown represents the highest frequency required to follow the
transition from black to white level in 0.11 ms.
170 THE TELEVISION TRANSMITTER
6.3.4.2 Video Amplifier Design. Because the video signal contains frequen-
cies from zero to some high frequency, a video amplifier must be designed to have a
flat response from dc to the high frequency in question. Ideally, all circuits in the
video chain must be directly coupled. In practice, an amplifier with a bandwidth
from approximately 30 Hz to approximately 4.0 MHz is considered to be a video
amplifier.
Consider a FET video amplifier [1] in which the FET is modelled in the common-
source mode as shown in Figure 6.10.
Since r
d
) R
L
and jX
Cds
j)r
d
, both r
d
and C
ds
can be neglected as shown in
Figure 6.11.
From Figure 6.11
I
1
¼ joC
gs
V
gs
ð6:3:2Þ
I
2
¼ joC
gd
ðV
gs
À V
o
Þð6:3:3Þ
I
3
¼ I
1
þ I
2
¼ joV
gs
½C
gs
þð1 À
V
o
V
gs
ÞC
gd
: ð6:3:4Þ
Figure 6.10. The equivalent circuit of a common-source FET.
Figure 6.11. A simplified equivalent circuit of the FET with r
d
and C
ds
excluded.
6.3 COMPONENT DESIGN 171
Now I
1
) I
2
, therefore
V
o
¼Àg
m
V
gs
R
L
: ð6:3:5Þ
Substituting into Equation (6.1.4),
I
3
¼ joV
gs
½C
gs
þð1 þ g
m
R
L
ÞC
gd
ð6:3:6Þ
V
gs
I
3
¼
1
jo½C
gs
þð1 þ g
m
R
L
ÞC
gd
: ð6:3:7Þ
The FET can now be the represented by the equivalent circuit shown in Figure 6.12
in which
C
g
¼½C
gs
þð1 þ g
m
R
L
ÞC
gd
: ð6:3:8Þ
Consider the two-stage video amplifier shown in Figure 6.13.
Figure 6.12. A modified form of the FET shown in Figure 6.11.
Figure 6.13. A two-stage video FET amplifier showing C
g
for both devices.
172 THE TELEVISION TRANSMITTER
The resistor R
1
is used to bias the gate of Q
1
and it is usually very large (MOs).
The time-constant C
g
R
1
is therefore very large compared to C
g
R
D
.Toafirst
approximation, the time-constant C
g
R
D
determines the high-frequency response of
the amplifier. The À3 dB frequency is
o
2
%
1
R
D
C
g
: ð6:3:9Þ
The bandwidth o
2
can be increased by connecting an inductance in series with the
drain resistance R
D
as shown in Figure 6.14.
The equivalent circuit is shown in Figure 6.15.
The load is
Z
L
¼
1
ðR
D
þ sLÞ
À1
þ sC
g
ð6:3:10Þ
Figure 6.14. The amplifier of Figure 6.13 with the inductor L connected in series with R
D
.
Figure 6.15. A simplified equivalent circuit of the first stage of the FET amplifier with the C
g
of
the second stage connected across the output.
6.3 COMPONENT DESIGN 173
where
s ¼ s þ jo ð6:3:11Þ
and
V
o
¼Àg
m
V
gs
Z
L
: ð6:3:12Þ
The gain is
A ¼
V
o
V
gs
¼Àg
m
Z
L
ð6:3:13Þ
A ¼
V
o
V
gs
¼À
g
m
C
g
s þ
R
D
L
s
2
þ s
R
D
L
þ o
2
o
ð6:3:14Þ
where
o
2
o
¼
1
LC
g
: ð6:3:15Þ
The gain function has two poles at
s
1
; s
2
¼À
R
D
2L
Æ
ffiffiffiffiffiffiffiffiffiffiffiffiffiffiffiffiffiffiffi
R
2
D
4L
2
À o
2
o
r
: ð6:3:16Þ
When
o
2
o
¼
R
2
D
4L
2
ð6:3:17Þ
the gain function poles are conjugate on the imaginary axis of the s plane and these
increase the gain at the resonant frequency o
o
.
The critical value of L is
L
crit
¼
R
2
D
C
g
4
: ð6:3:18Þ
The response is then as shown in Figure 6.16.
174 THE TELEVISION TRANSMITTER
The shape of the gain response can be controlled by varying the Q factor of the
circuit. Let
q ¼
o
2
L
R
D
¼
L
R
2
D
C
g
¼
L
4L
crit
: ð6:3:19Þ
Substituting q and s ¼ jo into Equation (6.1.14) gives
jAj¼
AA
ffiffiffiffiffiffiffiffiffiffiffiffiffiffiffiffiffiffiffiffiffiffiffiffiffiffiffiffiffiffiffiffiffiffiffiffiffiffiffiffiffiffiffiffiffiffiffiffiffiffiffiffiffiffiffiffiffiffiffiffiffiffi
1 þ q
2
o
o
2
2
1 þð1 À2qÞ
o
o
2
2
þ q
2
o
o
2
4
v
u
u
u
u
u
u
t
: ð6:3:20Þ
The gain response can, in general, be represented by the ratio of two polynomials in
o
2
:
HðoÞ¼
1 þ a
1
o
2
þ a
2
o
4
þÁÁÁ
1 þ b
1
o
2
þ b
2
o
4
þÁÁÁ
ð6:3:21Þ
which gives a flat gain–frequency response when a
1
¼ b
1
and a
2
¼ b
2
and so on.
Equating the coefficients of ðo=o
2
Þ
2
in Equation (6.3.21) gives
q ¼Æ
ffiffiffi
2
p
À 1 ¼ 0:414 or À 2:414: ð6:3:22Þ
Figure 6.16. The frequency response of the amplifier after the addition of the inductor. Note
that the resonant effect increases the gain at high frequency, thereby increasing the bandwidth.
6.3 COMPONENT DESIGN 175
The negative value has no physical meaning and it is neglected. Substituting into
Equation (6.3.19), we get
q ¼ 0:414 ¼
L
4L
crit
¼
L
R
2
D
C
g
ð6:3:23Þ
and
L ¼ 1:656L
crit
¼ 0:414R
2
D
C
g
: ð6:3:24Þ
The frequency response for three values of q are shown in Figure 6.17.
The new À3 dB frequency is
o
0
2
¼ 1:72 o
2
: ð6:3:25Þ
Example 6.3.1 Video Amplifier. A video amplifier uses FETs and has two stages
as shown in Figure 6.18.
Figure 6.17. The frequency response of the amplifier for various values of q.
Figure 6.18. The video amplifier used in Example 6.3.1.
176 THE TELEVISION TRANSMITTER
The FETs have the following parameters:
g
m
¼ 0:004 S; C
gs
¼ 1:0pF; C
gd
¼ 1:5pF:
Assuming that only the Miller effect capacitance affects the high-frequency
response, calculate the À3 dB frequency of the amplifier when the gain is 15.
Calculate the value of an inductance which, when connected in series with R
D
, will
extend the À3 dB cut-off frequency as high as possible while keeping the gain
response flat. Calculate the new cut-off frequency.
Solution. Neglecting all capacitance effects, the equivalent circuit of the amplifier is
shown in Figure 6.19, where
V
o
¼Àg
m
V
gs
R
D
ð6:3:26Þ
and the voltage gain is
A ¼
V
o
V
gs
¼Àg
m
R
D
¼ 15: ð6:3:27Þ
Therefore
R
D
¼
15
0:004
¼ 3750 O: ð6:3:28Þ
The voltage gain
A ¼
V
o
V
gs
%
R
D
R
s
¼ 15: ð6:3:29Þ
Therefore
R
s
¼ 250 O: ð6:3:30Þ
Figure 6.19. The equivalent circuit of stage 1 of the amplifier when all capacitances have been
neglected.
6.3 COMPONENT DESIGN 177
R
g
can be made arbitrarily large since no current flows in it. The Miller effect
capacitance of Q
1
will have negligible effect on the frequency response, especially if
the internal resistance of the driving source is small. The Miller effect capacitance of
Q
2
will appear across R
D
as shown in Figure 6.20 where
C
g
¼ C
gs
þð1 þ g
m
R
D
ÞC
gd
¼ 1:0 þð1 þ 15Þ1:5 ¼ 25 pF: ð6:3:31Þ
The À3 dB frequency o
2
is determined by
o
2
t ¼ 1 ð6:3:32Þ
where
t ¼ R
D
C
g
ð6:3:33Þ
and
f
2
¼
1
2pR
D
C
g
¼ 1:67 MHz: ð6:3:34Þ
When the inductance L is connected in series with R
D
and L has the critical value,
L ¼ 4qL
crit
¼ qR
2
D
C
g
: ð6:3:35Þ
When q ¼ 0:414,
L ¼ 145:5 mH: ð6:3:36Þ
The new À3 dB cut-off frequency is
f
0
2
¼ 1:72f
2
¼ 2:87 MHz: ð6:3:37Þ
Figure 6.20. The equivalent circuit of stage 1 of the amplifier with the C
g
of stage 2 included.
178 THE TELEVISION TRANSMITTER
6.3.5 Radio-Frequency Circuits
The composite video signal from the output of the video amplifier is used to
amplitude modulate the radio-frequency carrier obtained at a lower frequency from a
crystal oscillator and multiplied by a suitable factor by a frequency multiplier.
Amplitude modulators are discussed in Section 2.6, frequency multipliers in Section
2.5, and crystal-controlled oscillators in Sections 2.3 and 2.4.
6.3.6 Vestigial Sideband Filter
From Figure 6.8, it can be seen that the composite signal occupies a bandwidth of
approximately 0–4.5 MHz. If both sidebands were transmitted, it would require a
bandwidth of just over 9.0 MHz. Not only would that consume scarce bandwidth but
it is also unnecessary because the information in the upper and lower sidebands are
the same. Single-sideband (SSB) transmission could be used but the filter needed to
remove one of the sidebands is fairly sophisticated and the demodulation equipment
is complex and difficult to maintain. A compromise is to remove most of the lower
sideband using a bandpass filter. As shown in Section 7.2.4, a simple envelope
detector is adequate for the demodulation of such an AM signal if the index of
modulation is low. The frequency spectrum at the output of the vestigial sideband
filter is shown in Figure 6.21.
6.3.7 Antenna
Television broadcast frequencies are either in the very-high-frequency (VHF) band
which is from 30 to 300 MHz or in the ultra-high-frequency (UHF) band which is
from 300 to 3000 MHz. At these frequencies, antennas have highly directional
properties. To get the circular radiation pattern in the horizontal plane normally used
for broadcasting television signals, several arrangements of antenna arrays can be
Figure 6.21. The spectrum of the video signal after amplitude modulation and vestigial
sideband filtering. Note that the AM carrier signal occupies the zero frequency position after
modulation.
6.3 COMPONENT DESIGN 179
used. The most popular is the turnstile array. The basic principle is that, when two or
more radiating elements such as dipoles are placed in close proximity to each other,
they interact to produce a radiation pattern that is the vector addition of the
individual elements. By varying the relative physical positions of the elements
and the phase angle of the signal, it is possible to use the interactive properties to
create a radiation pattern which is approximately circular in the horizontal plane.
6.3.8 Color Television
The transmission of video signals in color is a subject which can take up several
volumes. However, because color television is so common, a simplified explanation
of how it works is now offered.
The first step is to discuss some of the properties of color and the results of
mixing them. There are three primary colors: red, blue and green, and by using
appropriate proportions of these, all other colors perceived by the human eye can be
obtained. A simple framework which makes it easy to understand the properties of
color, the color triangle [2,3], is shown in Figure 6.22.
The primary colors occupy the apices of the triangle. A mixture of equal
proportions of red and blue produces the color magenta; that of red and green
produces yellow, and finally blue and green produce cyan. These fit into the scheme
as shown. The center of the triangle represents white since equal proportions of red,
blue, and green produces white. Two pieces of information are required in order to
code a video signal in color. The first is brightness; the better technical term is
Figure 6.22. The color triangle with the I and Q axes.
180 THE TELEVISION TRANSMITTER
luminance, which is a measure of the energy in the light. Luminance is the only
information required for monochromatic (black-and-white) television. The second is
chrominance, or simply color. Chrominance is best represented on the diagram by a
polar coordinate scheme whose origin is at the center (white) of the triangle. When
one moves along a straight line from the origin towards the red apex one sees at first
white light followed by a slowly increasing presence of red (pink). At the apex (pure
red light) the color red is said to have reached saturation. The distance from the
center of the triangle (the magnitude of the complex number) is then a measure of
the saturation of the particular color. The angle of the complex number, with respect
to some arbitrary reference line, is called the hue of the light. The combination of
chrominance and luminance will produce a cylindrical coordinate system in which
luminance will be on the axis of the cylinder. In this scheme, the coding of color
must have three coordinates: luminance, saturation, and hue.
The above scheme does not take into account the sensitivity of the human eye
across the color spectrum and it needs to be modified since the human eye is the final
arbiter (detector) of the video signals transmitted. The response of the human eye is
shown in Figure 6.23.
A mixture of equal proportions of the primary colors is therefore perceived by the
human eye as a greenish-yellow color. In fact, to obtain white light the mixture has
to contain 59% green, 30% red, and only 11% blue.
The simplest system for coding video information for television transmission is
simply to scan the picture for the three primary colors and process each one as if it
were monochromatic. Some multiplex system could then be worked out to
accommodate all three signals. Such a scheme was tried in the United States in
the late 1940s and early 1950s but was found to be incompatible with the black-and-
white system then in existence.
In 1953, a scheme proposed by the National Television System Committee
(NTSC) was accepted by the Federal Communications Commission (FCC) and it has
since been adopted as a standard by television broadcasting authorities in many
Figure 6.23. The relative sensitivity of the human eye to the wavelength of light.
6.3 COMPONENT DESIGN 181
countries. The NTSC scheme separates the signal into chrominance and luminance
(the chrominance information is further separated indirectly into I and Q compo-
nents, which correspond approximately to hue and saturation). This will be
explained later. The actual system acquires the luminance information by taking
the weighted sum of the three primary colors to obtain white light as perceived by
the human eye as:
L
w
¼ 0:59L
g
þ 0:30L
r
þ 0:11L
b
: ð6:4:1Þ
L
w
then contains all the information for black-and-white picture transmission. For
color pictures, the three signals L
w
; ðL
r
À L
w
Þ and ðL
b
À L
w
Þ are sent. The third
possible signal ðL
g
À L
w
Þ is not used because it is the smallest of the three difference
signals and therefore more likely to be corrupted by noise. The two difference
signals ðL
r
À L
w
Þ and ðL
b
À L
w
Þ are quadrature multiplexed, a form of DSB-SC
modulation, with the color sub-carrier of frequency o
o
. The two difference signals
have the form:
ðL
b
À L
w
Þcos o
o
t þðL
r
À L
w
Þsin o
o
t: ð6:4:2Þ
The signal
L
w
þðL
b
À L
w
Þcos o
o
t þðL
r
À L
w
Þsin o
o
t ð6:4:3Þ
is used to amplitude modulate a suitable carrier in the usual vestigial sideband
scheme.
At the receiving end, the two difference signals are de-multiplexed by multiplying
them by the output of a local oscillator which is synchronized to the color sub-carrier
of frequency o
o
in the transmitter. The color sub-carrier signal is sent in ‘‘bursts’’
during the trailing portion of the horizontal blanking pulse called the back porch.
This is shown in Figure 6.24.
The demodulation system is shown in Figure 6.25.
The recovered signals L
w
; ðL
b
À L
w
Þ and ðL
r
À L
w
Þ are used to reconstruct the
missing difference signal ðL
g
À L
w
Þ as follows:
ðL
g
À L
w
޼0:30
0:59
ðL
r
À L
w
ÞÀ
0:11
0:59
ðL
b
À L
w
Þ: ð6:4:4Þ
The four signals are used to control the appropriate grids on the picture tube to
reproduce the original scene.
In the above discussion, the bandwidth requirements of the three signals
L
w
; ðL
b
À L
w
Þ and ðL
r
À L
w
Þ were assumed to be the same. This is, in fact, not
true. The human eye has a higher resolution in black-and-white than it does in color.
It is adequate to present the uniform, large areas of the picture (low frequency) in
color; the fine details (high frequency) can be presented in black-and-white. The
luminance information L
w
must have the whole bandwidth available. The difference
signal containing the chrominance information requires much less bandwidth.
182 THE TELEVISION TRANSMITTER
Further advantage can be taken of the greater sensitivity of the human eye to
green-yellow light by de-emphasizing the green-yellow component by using a
smaller bandwidth for transmitting that part of the spectrum. This is called the Q
signal. The blues and the reds, to which the human eye is less sensitive, are given a
relatively larger bandwidth. This is called the I signal. The comparative spectra for
the luminance, Q and I signals are shown in Figure 6.26.
Because the Q signal occupies a total bandwidth of 1 MHz, and it fits within the
overall bandwidth limits of the signal, both sidebands are transmitted. The upper
sideband of the I signal lies outside the overall bandwidth and part of the upper
sideband is removed by a vestigial sideband filter.
Figure 6.24. A modified back porch of the blanking pulse used to transmit the color subcarrier.
Figure 6.25. A scheme for demultiplexing the color information.
6.3 COMPONENT DESIGN 183
REFERENCES
1. Ryder, J. D., Electronic Fundamentals and Applications: Integrated and Discrete Systems,
5th Ed., Prentice-Hall, Englewood Cliffs, NJ, 1976.
2. Lambert, J. H., (a) Beschreibungen einer Farbenpyramide, Berlin, 1772. (b) ‘‘Me
´
moire sur
la Partie Photometrique de l’Art de Peinture’’, Preussiche Akademie der Wissenschaften,
Berlin; Histoire de l’Acad. Royal des Science et Belles Lettres, 24, 80–108, 1768.
3. Maxwell, J. C., ‘‘On the Theory of Three Primary Colours’’ in Niven, W. D. (Ed), The
Scientific Papers of James Clerk Maxwell, Cambridge University Press, Cambridge,
England, 1890.
4. Zworykin, V. K., Morton, G. A. and Flory, L. E., ‘‘Theory and Performance of the
Iconoscope’’, Proc. IRE, 25(8), 1071–1092, 1937.
5. Zworykin, V. K. and Morton, G., Television, 2nd Ed., John Wiley, New York, 1954.
6. Rose, A., Weimer, P. K. and Law, H. B., ‘‘The Image Orthicon – A Sensitive Television
Pickup Tube’’, Proc. IRE, 34(7), 424–432, 1946.
BIBLIOGRAPHY
1. Shure, A., Basic Television, J. F. Rider Publisher Inc., New York, 1958.
2. Fink, D. G. and Christiansen, D., Electronics Engineers’ Handbook, 2nd Ed., McGraw-Hill,
New York, 1982.
3. Stover, W. A. (Ed), Circuit Design for Audio, AM=FM and TV, McGraw-Hill, New York,
1967.
4. Fink, D. G., Television Engineering Handbook, McGraw-Hill, New York, 1957.
5. Stremler, F. G., Introduction to Communication System, 3rd Ed., Addison-Wesley, Reading,
MA, 1990.
Figure 6.26. The full spectrum of the color TV signal. Note that zero frequency corresponds to
the AM (video) carrier frequency.
184 THE TELEVISION TRANSMITTER
PROBLEMS
6.1 What is a video signal? Explain why a video amplifier has to be used in
conjunction with a television camera tube.
Explain with the help of a block diagram the configuration and function of
each block of a typical television transmitter. Indicate the type of signal you
expect at the output of each block in terms of waveform, frequency, and
bandwidth.
6.2 Explain with the help of a suitable diagram the operation of the iconoscope.
What conditions have to be met for it to operate optimally?
6.3 Explain with the help of a suitable diagram the operation of the image
orthicon. Discuss its performance relative to the iconoscope.
6.4 A television system has the following features:
(1) 625 lines per frame with interlacing,
(2) 25 frames per second,
(3) 5% of the trace period is used for the retrace,
(4) the aspect ratio is 4 : 3.
Assuming equal resolution on the vertical and horizontal axes of the picture
tube, calculate the bandwidth required to handle the signal.
6.5 The voltage applied to the anode of a picture tube accelerates an electron to a
velocity of 10 Â 10
6
m=s along the axis of the tube (x axis). The electron then
passes between two parallel (deflection) plates of length 2.5 cm (in the x
direction). The distance between the plates in the y direction is 2.0 cm and a dc
voltage of 270 V is maintained between them. Assuming that the electrostatic
field is uniform and confined to the space between the plates, calculate the
following:
(1) the velocity of the electron in the y direction as it emerges from the
electrostatic field,
(2) the displacement of the electron in the y direction when it hits a target
placed 5 cm away from the end of the deflection plates.
You may assume the following:
(a) the force (in newtons) on the electron due to the electrostatic field is given
by
F ¼ eE
where e is the charge (coulombs) on the electron and E is the electric field
intensity (in volts per meter),
PROBLEMS 185