Urban Transportation, Land Use, and the Environment in Latin America: A Case Study Approach pptx
Bạn đang xem bản rút gọn của tài liệu. Xem và tải ngay bản đầy đủ của tài liệu tại đây (595.49 KB, 60 trang )
Urban Transportation, Land Use, and
Urban Transportation, Land Use, and
the Environment in Latin America:
the Environment in Latin America:
A Case Study Approach
A Case Study Approach
Lecture 11:
Lecture 11:
The Santiago Metropolitan Area
The Santiago Metropolitan Area
2
Transport System: Brief History
Transport System: Brief History
z Horse trams and steam trains (to San Bernardo and
Puente Alto) by turn of Century
z By 1930s, city has one of most extensive electric
tram networks in South America
– 220 kms, 210 passengers/year
– Dismantling begun in 1945
z By 1960s (first land regulatory plan)
– Plans also laid for Metro system
– Construction begun on ring road (Vespucio), Avenida
Kennedy (East to Las Condes) and the PanAmerican
Highway
3
Policy Context
Policy Context
z Urban Policy
– Strongly influenced at national level
z Specific policy interests fluctuating in time with politics
– 1993 policy-formulation process recs:
z Goals: decentralization; environment and quality of life; equity in
access to goods and services; economic growth and modernization;
more a balanced distribution of population and economic activity
across the country (CED, et al., 1994).
z Measures: capacity building; institutional improvement;
strengthened role of local governments (Municipalities);
improvement in regional planning instruments and processes;
improvements in urban information systems; internalization of
external costs, promoting the use of non-motorized transportation
and shorter trips, densification and mixing of land uses, “sub-
centers”)
z “Ideal” rhetoric, but, nothing formal still written…policy vacuum
prevails
4
Policy Context
Policy Context
z Urban Transport Policy
– Strongly influenced at national level
z For long time, an ad hoc amalgam of activities at different
government levels
– Santiago reaches crisis by the 1970s, early 1980s SECTU,
later SECTRA, is born
z Develops, formalizes evaluation techniques, data collection, etc.
z Technical, demand- and system-management perspective
(engineering approach); little consideration to land use alternatives as
management option
– No formal “policy” exists, “rational” rhetoric disarticulated
by different apparent “schools of thought” prevailing among
institutions
z The “infrastructure camp” v/s the “management camp”
z Ultimately determined by who has the money?
5
Today’s Transport Modes &
Today’s Transport Modes &
Infrastructure
Infrastructure
z Cars, Buses (Micros), Trucks Taxis, fixed route taxis
(colectivos), Metro, Suburban Rail, Walk, Bike
z Approx. 4,700 kms of roadways
– Plus, Vespucio Ring Road and the Pan American Highway
z Two Segregated Busways
– 5 km segment and ~10 km stretch
z Differentiated and (in city center)
segregated bus stops
z 3 Metro Lines: 40 kms, 51 stations, 68
trains, built at $1.6 billion (US$1999)
z Suburban Rail: 9 stations, 85 kms south to
Rancagua
6
NMT Facilities
NMT Facilities
z Wide sidewalks and well-
signaled pedestrian facilities
increasingly common (especially
in heavy commercial areas)
z Few bicycle facilities
7
Major Recent Projects in
Major Recent Projects in
Greater Santiago
Greater Santiago
z Upgrade of Ring Road (Vespucio) in North,
Northwest
z Overpass/underpass on Kennedy Highway
to the East (Las Condes)
z Major Road upgrades in Southeastern
suburbs
z Completion of Metro Line 5 to city center
9
Major Recent Projects in RM
Major Recent Projects in RM
z Completion of Route
78 (Autopista del Sol)
to Port of San Antonio
z upgrade of Route 57
north to Los Andes
(road to Argentina)
z upgrade of Route 68
west to Valparaiso
10
System Management
System Management
z UOCT (Operative Traffic Control Unit)
– Traffic Light Operations (1600 intersections)
z 80% on pre-established timing (traffic-count based); 16% dynamic
control (SCOOT); 4% sensor-activated
z One-way streets during peak periods
z La Restriccion – vehicle restriction, similar to Hoy no
Circula, in place since late 1980s.
– Odd-even scheme implemented during pollution months
– Initially, aimed to reduce on-street fleet by 20%
– In 1993, cars with catalysts exempted
– Currently in force 4 March to 31 December
z Includes private cars, trucks, school buses, taxis, buses & trucks
(during off peak periods) w/out advanced pollution control techs.
z Currently reduces approx. 8% of cars on any given day
z With higher pollution days, can be expanded.
11
System Management
System Management
z Using pollution as a force for
“immediate actions” March –
December:
– 9 “vias exclusivas” for public transport
z During AM Peak (7:30 – 10:00)
z Three additional lanes and PM
Peak added during pollution
episodes
– “Reversible Lanes” for
Private Transport
z Primarily during AM peak
12
Bus System History
Bus System History
z 1970s: Strong state intervention
– Private operators, but all key variables (frequency, routes, fares)
under government control
z 1979-1982: Complete deregulation
– Part of government neo-liberal reforms
– Fares, routes, operations
– Problems already evidenced
z 1982-1988: Partial re-regulation
– Over routes (particularly in the center city) and vehicle age
z 1988: Complete deregulation, again
– Only controls over vehicle quality via inspections
13
Bus System by 1990
Bus System by 1990
z Results are in
– Positives: Supply and service area expansion, frequency
increase
z 1978-1985: Bus and Minibus fleet grew 50% and 75%
(respectively)
– Negatives: Decline in occupancy rates (50%), cartel
control of fares and entry (self-regulating “mafia”), old
vehicles, poor maintenance, devastating public image (in
face of motorization)
z By 1991: 13,500 vehicles, average age of 14 years
z Bus oversupply estimated at 4,000 vehicles, consuming $24.4
million per year in excess fuel, 10% excess of PM emissions
z 10-fold increase in bus fare relative to minimum family wage (77-
87)
14
Early 1990s: The Process of Bus
Early 1990s: The Process of Bus
System Reform
System Reform
The Early 1990s – process of reform
z Purchase of oldest vehicles on street
– 2,600 vehicles at cost of $14 million
z 18-year old age limit established
– Implying further retirement of 2,000 vehicles (91-94)
z Emissions standards
– From 1990 to 94: Permitted exhaust opacity levels, 32% ⇒ 9%
– 1993: all new engines, EPA-91
– 1996: EPA-94
15
1990
1990
–
–
The Legal Foundation
The Legal Foundation
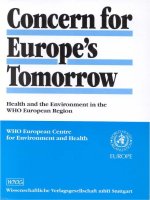
z Concessioning (public bidding) of routes
where congestion, pollution, and/or safety
concerns exist
O-1 D-1
D-2
O-2
Regulated
Area
Concessioned
Services
Non-Concessioned
Services
– Service Terminals (Os and Ds) established
– Routes outside “regulated area” are flexible
– Route and frequency criteria must be met within the “regulated area”
Source: Dourthe et
al., 2000.
16
Concession Basis
Concession Basis
z Routes and Frequencies – Bid must present a fleet
consistent with these requirements
z Vehicle Age – lower average age, greater points
– 10-year limit for traditional buses; 14-year-old limit for
buses meeting EPA standard
z Vehicle Capacity – higher avg. capacity, more points
z Formalization of the operators – with clearly
defined legal representative
z Fares – in bid, operator chooses from four possible
fares, lower far, greater points
– A formula for fare increases set: a weighted sum that
includes the variation in fuel, tire, labor, US & Brazilian
exchange rate & other costs (adjustment indices come from
independent agency – INE)
17
Concession Stages
Concession Stages
z 1992 – 36 month term
– Automatically extendable if certain conditions met, re: vehicle
technology and driver remuneration
z 1998 – 60 month term
– With automatic 6 month extension by Ministry possible
– Additional incentives to improve quality of service
z Operators meeting a minimum percentage of fleet with EPA
technology, with automatic transmission, A/C, and minimum fleet %
using CNG had right to:
– increase fare by 10% after 1
st
year,
– in the fourth year, extend by an additional five years the term of the
concession
– Due to the variation in demand (peak, off-peak, holidays,
vacation periods) – allow predetermined frequency adjustments
– Authority maintains right to alter service requirements based
on demand changes over time
18
Results
Results
z “Regulated Area” now 270 km
2
z Reduction and modernization of the fleet
– 1992: 13,550 vehicles, avg. age 14
– 2000: 9,000 vehicles, avg. age 4
– Investment of US$ 500 million by private sector
z Improved Service Quality
– Travel times (despite slightly increased wait time),
comfort, cleanliness, safety, uniformity of service and
information
z Pollution. > one-half buses comply with EPA-91/94
z Modernization of buses operators
z Fare Stabilization and De-politicization
– Fares remained roughly constant since 1991 (~US$0.30)
19
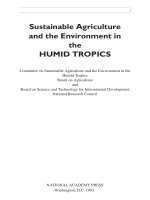
Evolution in Bus Fares
Evolution in Bus Fares
Note: Concessioned buses entered into service at the end of
1991. For the years, 1993, 94, 95, 96 the values are annual
average (f are varied during the year)
0
50
100
150
200
250
1978
1980
1982
1984
1986
1988
1990
1992
1994
1996
Fare (1997 Pesos)
Bus
Taxibus
Concessioned Bus
Source: Dourthe et al., 2000.
21
Bus Concessions: Some Comments
Bus Concessions: Some Comments
z Fare Reductions: Actually began before concession
contracts in place (10/92)
z Current & Future competition?
– Higher technical requirements (vehicles) imply fewer potential
operators
z 1998, 97% (280 routes) bid maximum fare: CH$190
z 76% bid for just one route (return of collusion?)
– Competition or price setting by Ministry?
z Despite reduced bus fleet size, still apparent excess
capacity
– particularly during certain times of day, on certain routes
z Safety, Security
– Battle to implement new charging techniques (still unresolved)
– Unable to change driver remuneration method
– Still competition on the street
22
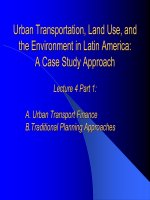
Passenger Travel Demand
Passenger Travel Demand
Trips by Purpose
z Work: 36%
z School: 32%
z Other: 32%
z Work and school predominate during
peak periods; others constant across day
Bus Auto Metro Walk Others
0
10
20
30
40
50
60
70
Bus Auto Metro Walk Others
1977 1991
Mode Share: % of All Trips
Not e: M et ro includes all combinations
0%
10%
20%
30%
40%
50%
60%
70%
Work Trips School Others
Auto Bus
Walk Metro
Modes by Trip Purpose
1991 (last O-D survey)
z 8.4 million trips/day
z 2.12 trips/person
– 1.91 in poorest HHs
– 2.65 in wealthiest HHs
Source: Sectra, 1991.
Source: Sectra, 1991.
23
Vehicle Fleet
Vehicle Fleet
0
10,000
20,000
30,000
40,000
50,000
60,000
1986
1987
1988
1989
1990
1991
1992
1993
1994
1995
1996
1998
2000
Taxis, Buses, Trucks
0
100,000
200,000
300,000
400,000
500,000
600,000
700,000
800,000
900,000
Private Vehicles
Taxis
Buses
Trucks
Private Vehicles
Fleet Growth Rates: 1986-1996
z Private Vehicles: 6%
z Taxis: 7.8%
z Buses: 1%
z Trucks 6%
Motorization Rate
z 1952: 14 private vehicles per 1000
z 1977: 60 private vehicles per 1000
z 2000: 129 private vehicles per 1000
z A.A. Growth 86-96: 4%
24
Wealth, Motorization, Mode Share
Wealth, Motorization, Mode Share
0%
10%
20%
30%
40%
50%
60%
Auto Mode Share
0
50
100
150
200
250
300
350
400
Ve hicle s per 1000 Pop.
Auto Mode Share
Veh/1000
Motorization Rate & Income
z Kain & Liu (1994)
z Income explains >90% of HH
vehicle ownership
z Income Elasticity: 1.06-1.16
z Zegras & Gakenheimer (2000) - using
1998 data for entire RM
z % HH private vehicle ownership
increases with Avg. HH income
at elasticity of 0.82 (r
2
=70)
Motorization Rate & Mode Share
z Kain & Liu (1994)
z Auto ownership explains 96% of auto use
z Elasticity of auto mode share to ownership of nearly 1.
z Zegras & Gakenheimer (2000) estimates suggest a short term elasticity of
0.80 and long term of 1.22
z Suggesting that today’s auto mode share roughly 22%-24% of all trips
25
Motorization Rate, Mode
Motorization Rate, Mode
Share, Trips
Share, Trips
–
–
Growth in Time
Growth in Time
4.2%1.70.95Motorized
Trips/Capita
4.4%2.131.14Trips/Capita
3.4%15.8%9.8%Auto Mode
share
3%9060Autos/ 1000
Population
Annual
Growth
19911977
Source: SECTRA, 1991.
26
Income, Motorization, Mode Share
Income, Motorization, Mode Share
–
–
What Future the Bus?
What Future the Bus?
0
10
20
30
40
50
60
70
80
<
$
1
1
7
$
1
1
7
-
$
2
0
8
$
2
0
8
-
3
1
6
$
3
1
6
-
$
4
9
4
$
4
9
4
-
$
7
5
0
$
7
5
0
-
$
1
1
6
0
$
1
1
6
0
-
$
2
8
6
5
>
$
2
8
6
5
Monthly Incom e (US$ 1991)
% of All Trips
Walking
Auto
Public Transport
Source: Farah, et al, 1993.
27
Bus System
Bus System
–
–
Ongoing Challenges
Ongoing Challenges
Specific to Private Sector Ownership-Operations
z On-Street competition for passengers
z Service and fare integration
– Nearly all services run periphery to periphery
z Often long, torturous routes, with duplication on dense corridors
z “Formalization” of the companies
– Many traits of informal roots remain
Challenges to the System in General
z Service & fare differentiation
– Marginal cost pricing possible?
– Higher quality service for higher paying patrons?
z Travel & wait time
– Bus trip times on average 70% longer than auto
z Overall public perception & status – what role public policy?
**For how much longer will the private operators be viable?**