Báo cáo khoa học " NMR characterization of the polysaccharidic fraction from Lentinula edodes grown on olive mill waste waters " pdf
Bạn đang xem bản rút gọn của tài liệu. Xem và tải ngay bản đầy đủ của tài liệu tại đây (320.93 KB, 6 trang )
NMR characterization of the polysaccharidic fraction from
Lentinula edodes grown on olive mill waste waters
Umberto Tomati,
a
Monica Belardinelli,
a
Emanuela Galli,
a
Valentina Iori,
a
Donatella Capitani,
b
Luisa Mannina,
b,c,
*
St
ephane Viel
b,c
and Annalaura Segre
b
a
Istituto di Biologia Agroambientale e Forestale, CNR, Area della Ricerca di Roma, I-00016 Monterotondo Scalo, Rome, Italy
b
Istituto di Metodologie Chimiche, CNR, Area della Ricerca di Roma, I-00016 Monterotondo Scalo, Rome, Italy
c
Facolt
a di Agraria, Dipartimento S.T.A.A.M, Universit
a degli Studi del Molise, I-86100 Campobasso, Italy
Received 25 July 2003; received in revised form 11 February 2004; accepted 14 February 2004
Abstract—A high-field NMR study of the polysaccharidic fraction extracted from Lentinula edodes mycelium grown on olive mill
waste waters is reported. Diffusion-ordered NMR spectroscopy (DOSY) was applied to the polysaccharidic fraction. The results
showed the presence of two polysaccharides of different sizes, whose structures were revealed using one- and two-dimensional NMR
techniques. These two polysaccharides were identified as xylan and lentinan.
Ó 2004 Elsevier Ltd. All rights reserved.
Keywords: Lentinula edodes; Olive mill waste waters; Lentinan; Xylan; NMR; DOSY
1. Introduction
Basidiomycetes constitute a natural source of biologi-
cally active metabolites. Many basidiomycetes have
been classified by the National Cancer Institute of the
United States as antitumor agents exhibiting an immu-
nomodulatory activity.
1
The therapeutic activity is
mainly related to polysaccharides or protein-bound
polysaccharides, such as glucans, heterogalactans, and
glucanproteins, which are present either in the mycelium
or in the fruit body.
2–6
Among these polysaccharides are
b-
DD
-glucans, which are of particular interest because of
their pharmacological properties. Most of the b-
DD
-glu-
cans exhibiting a biological activity have been extracted
from Grifola frondosa, Ganoderma lucidum, Trametes
versicolor, Schizophyllum commune, Lentinula edodes,
and Flammulina velutipes.
7
b-
DD
-glucans are composed of a b-(1 fi 3)-linked-
DD
-
glucopyranose backbone to which b-(1 fi 6)-
DD
-gluco-
pyranosyl residues are randomly branched. Their
activity has been shown to depend on their structure and
conformation.
8–10
More specifically, lentinan is a
b-(1 fi 3)-
DD
-glucan that has been extracted from
L. edodes, a mushroom widely cultivated in oriental
countries. To the backbone of lentinan, two b-(1 fi 6)-
DD
-
glucopyranosyl residues are branched every five b-
DD
-
glucopyranosyl residues.
9
This specific structure is
reported to be responsible for the antitumor, antibac-
terial, antiviral, anticoagulatory as well as the wound-
healing activities of lentinan; in particular, lentinan has
a strong antitumor activity against sarcoma 180 in mice,
with a complete regression of the tumor after 10 doses of
1 mg/kg.
11
It has been shown that lipids, such as oleic and pal-
mitic acids, stimulate the growth of L. edodes myce-
lium.
12
Because olive mill waste waters (OMWW)
contain lipids, they appear as a suitable source of
nutrients for the growth of L. edodes mycelium. In
addition, in a strategy of bioremediation, the production
of mycelial biomass from agricultural wastes appears
highly attractive.
In this paper, the study of the polysaccharidic fraction
extracted from L. edodes mycelium grown on OMWW is
reported. Because the activity of a polysaccharide can be
* Corresponding author. Tel.: +39-06-9067-2385; fax: +39-06-9067-
2477; e-mail:
0008-6215/$ - see front matter Ó 2004 Elsevier Ltd. All rights reserved.
doi:10.1016/j.carres.2004.02.007
Carbohydrate Research 339 (2004) 1129–1134
Carbohydrate
RESEARCH
affected by its structure and by the degree of branching,
a careful structural analysis of the polysaccharidic
fraction was carried out, using gas chromatography and
NMR spectroscopy, including conventional 2D
1
H–
1
H
COSY, TOCSY, and
1
H–
13
C HSQC experiments as well
as
1
H-detected diffusion-ordered NMR spectroscopy
(DOSY) experiments.
2. Results and discussion
L. edodes is commonly cultivated on lignocellulosic
substrates; because lipids stimulate the mycelium
growth, they are usually added to the growth medium.
OMWW (olive mill waste waters) contain, on average,
1–1.5% of lipids, mainly palmitic and oleic acids, and are
therefore a suitable growing medium for L. edodes. The
complete chemical characterization of OMWW is
reported in Table 1.
13
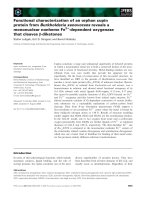
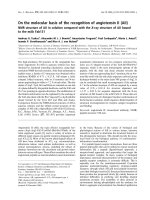
In our case, it was observed that the growth of
L. edodes on OMWW led to a 2-fold increase in mycelial
biomass with respect to the growth on the control
medium consisting of malt extract and peptone (Fig. 1).
From each mycelial biomass, a polysaccharidic fraction
was extracted. It must be pointed out that, from the
same amount of mycelial biomass, grown either on
OMWW or on the control medium, the same amount of
polysaccharidic fraction (0.80–0.85% dry weight) was
extracted. Subsequently, both polysaccharidic fractions
were analyzed by gas chromatography (GC) and NMR
spectroscopy, and the results were the same; therefore,
only the analysis of the fraction extracted from the
mycelium grown on OMWW is reported here.
The GC analysis, performed on the hydrolyzed sam-
ple (see Experimental) allowed the monosaccharidic
composition to be obtained (Table 2): glucose and
xylose were present in large amount (>99% area),
whereas ribose, arabinose, and mannose, were present
only in trace (<1% area). The xylose/glucose molar ratio
was 1:7.
The gel filtration chromatography showed a broad
peak with a molecular weight ranging from 200 to 350
KDa; the fraction corresponding to this broad peak was
analyzed by NMR.
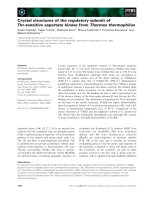
The
1
H spectrum of the polysaccharidic fraction in
0.5 M NaOD aqueous (D
2
O) solution is reported in
Figure 2 as horizontal projection. All signals were rather
broad suggesting the presence of high molecular weight
compounds.
Time (days)
510152025
Mycelial growth (g L
-1
)
0
5
10
Figure 1. Growth of L. edodes mycelium on olive mill waste waters
(empty circles) and on the control medium (filled circles).
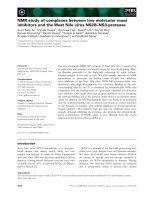
Figure 2.
1
H-detected DOSY spectrum of the polysaccharidic fraction
in 0.5 M NaOD aqueous (D
2
O) solution at 300 K. The 600.13 MHz
1
H
spectrum of the sample is also reported.
Table 2. Gas chromatographic retention times and areas of the
monosaccharides identified in the polysaccharidic fraction
Peak Residue Retention time (min) Area
1 Ribose 21.534 ± 0.015 12343 ± 34
2 Arabinose 22.192 ± 0.006 9449 ± 38
3 Xylose 24.362 ± 0.040 140700 ± 47
4 Mannose 27.275 ± 0.009 6284 ± 9
5 Glucose 29.375 ± 0.007 1289560 ± 59
6 Inositol
a
30.422 ± 0.005 1045238 ± 906
a
Inositol was used as an internal standard.
Table 1. Chemical characterization of olive mill waste waters
pH 4.7–5.5
Water 90.4–96.5%
Dry matter 3.5–9.6%
Organic matter 2.6–8.0%
Lipids 0.5–2.3%
Proteins 0.17–0.4%
Carbohydrates 0.5–2.6%
Organic acids Traces
Polyalcohols 0.9–1.4%
Pectines, gums, tannines 0.23–0.50%
Glucosydes Traces
Polyphenols 0.3–0.8%
Ashes 0.2–0.5%
P
2
O
5
0.03–0.07%
SO
3
, SiO
2
, FeO, MgO traces – 0.03%
CaO 0.01–0.03%
K
2
O 0.11–0.24%
Na
2
O 0.01–0.03%
Suspended solids 0.7–1.1%
Dry matter 3.5–9.6%
1130 U. Tomati et al. / Carbohydrate Research 339 (2004) 1129–1134
In order to check whether the sample was a single
compound or a mixture, a diffusion-ordered NMR
experiment was performed. The DOSY experiment is
one way of displaying pulsed field gradient NMR data,
14
and has been previously used for many applications.
15–21
This experiment yields a pseudo 2D NMR spectrum
with chemical shifts in one dimension (horizontal axis)
and diffusion coefficients in the other one (vertical axis).
Therefore, DOSY spectroscopy allows one to distin-
guish compounds according to differences in their size.
In Figure 2, a
1
H-detected DOSY of the polysaccha-
ridic fraction is reported. All
1
H signals were classified
according to their self-diffusion coefficient. In particular
two groups of signals characterized by a distinct self-
diffusion coefficient were observed. Therefore, two
compounds of different sizes were present. The struc-
tural elucidation of these two compounds, hereafter
referred to as compounds X and A, is discussed sepa-
rately.
2.1. Structural elucidation of compound X
Compound X exhibited the major diffusion coefficient
and hence the minor molecular size. The structure was
revealed using 1D and 2D NMR experiments.
1
H–
1
H
COSY (data not shown) and
1
H–
1
H TOCSY experi-
ments (Fig. 3) showed that all the
1
H resonances due to
compound X belonged to the same spin system; in fact,
proton H-1x at 4.49 ppm was correlated to other five
protons at 3.33, 3.55, 3.82, 3.40, and 4.15 ppm, respec-
tively. The corresponding
13
C assignment was obtained
by a
1
H–
13
C HSQC experiment (Table 3).
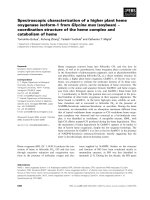
These results suggested the presence of b-xylose units.
In order to determine whether the compound was a
monosaccharide or a polysaccharide, a DOSY experi-
ment was performed on a xylose sample (Fig. 4). The
comparison between the diffusion coefficients of com-
pound X (7 · 10
À11
m/s
2
,Fig.2)andxylose(7· 10
À10
m/s
2
,
Fig. 4) indicated that compound X had a much larger
molecular size than xylose; therefore, compound X was
generically reported as xylan.
22
Finally, the low-field
chemical shift of the C-4x carbon at 78.5 ppm indicated
that the monomeric units were linked in position 4.
2.2. Structural elucidation of compound A
With respect to compound X, compound A had a minor
diffusion coefficient and hence a major molecular size.
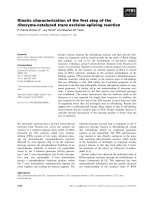
The
1
H resonances (Fig. 3) were assigned by means of
2D experiments. Three different spin systems of different
intensity, labeled as a, a
0
, and a
00
, were identified by
1
H–
1
H COSY and
1
H–
1
H TOCSY experiments. The
13
C
assignment corresponding to these spin systems was
obtained by means of a
1
H–
13
C HSQC experiment. The
1
H and
13
C chemical shift values of these three spin
systems suggested the presence of glucose residues (Fig.
3). The
1
H and
13
C assignments of these residues are
reported in Table 4. The chemical shift values of the
Figure 3.
1
H–
1
H TOCSY map of the polysaccharidic fraction in 0.5 M
NaOD aqueous (D
2
O) solution at 300 K. The
1
H spectrum of the
sample with the corresponding assignment is also reported. Labels x
and a refer to compounds X and A, respectively. Cross-peaks between
anomeric protons and correlated protons are evidenced in the expan-
sion of the anomeric region.
Figure 4.
1
H-detected DOSY spectrum of a xylose sample in 0.5 M
NaOD aqueous (D
2
O) solution at 300 K. The 600.13 MHz
1
H spec-
trum of the xylose sample is also reported.
Table 3.
1
H and
13
C assignments of compound X in 0.5 M NaOD
aqueous (D
2
O) solution at 300 K
Proton d1
H
(ppm) Carbon d13
C
(ppm)
H-1x 4.49 C-1x 104.4
H-2x 3.33 C-2x 74.3
H-3x 3.55 C-3x 76.3
H-4x 3.82 C-4x 78.5
H-5x, H-5x
0
3.40, 4.15 C-5x 65.6
U. Tomati et al. / Carbohydrate Research 339 (2004) 1129–1134 1131
anomeric protons H-1a, H-1a
0
and H-1a
00
at 4.78, 4.77,
and 4.53 ppm, respectively, indicated that the anomeric
protons were in a b-configuration. The chemical shift
values of C-3a and C-3a
0
at 88.2 and 88.6 ppm, respec-
tively, indicated the presence of glucosyl residues linked
in position 3.
22
Hence, compound A consisted of a
backbone made of b-(1 fi 3)-
DD
-glucopyranosyl residues
(a and a
0
spin systems).
In addition, the chemical shift value of the C-6a
0
methylene group at 71.0 ppm was typical of a branch in
position O-6;
22
therefore, the glucosidic residues a
0
and
a
00
were linked in position O-6. All these observations
were consistent with the presence of b-(1 fi 3)-
DD
-gluco-
pyranosyl residues containing branch points on the
b-(1 fi 6)-
DD
-glucopyranosyl residues (Scheme 1).
The integral of the anomeric
1
H resonances of the a
and a
0
residues of the backbone compared with the
integral of the anomeric
1
H resonances of the a
00
residues
allowed the content of branching to be measured: the
sample had a 40% of branched units, that is, it had two
branches every five
DD
-glucopyranosyl residues. There-
fore, in agreement with the literature,
22
this polysac-
charide was identified as lentinan. Besides, the integral
performed on the anomeric
1
H resonances due to xylan
and lentinan agreed with the xylose/glucose ratio of 1:7
determined by GC.
3. Experimental
3.1. Organism
L. edodes (SMR 0090), stored at the International Bank
of Edible Saprophytic Mushrooms, was cultured on
agar slopes of synthetic medium containing 3% malt
extract.
3.2. Preparation of inoculum
Mycelial pellets were obtained by growing mycelium in
shake cultures in 100 mL Erlenmeyer flasks containing
50 mL of synthetic liquid medium (0.5% peptone and 3%
malt extract) at 25 °C, 125 rpm for 10 days. Afterwards
pellets were homogenized aseptically in an omni mixer
homogenizer for 3 s and inoculated into flasks for
mycelial growth.
3.3. Mycelial growth
50 mL of mycelial suspension (equivalent to 1.5–1.6 g of
dry weight) were inoculated in 2500 mL flasks contain-
ing 1000 mL of:
(a) Control medium ¼ 3% malt extract and 0.5% pep-
tone;
(b) Olive mill waste waters (OMWW) (dry
weight ¼ 4.85% and organic matter ¼ 89.0% dry
weight); the pH was adjusted at 5.8.
The flasks were incubated for 21 days at 25 °C,
H ¼ 70% and stirred at 100 rpm. Mycelial growth was
assayed by weight after 7, 14, and 21 days from inocul-
ation.
3.4. Extraction of the polysaccharidic fraction
23
21-days old mycelial biomass obtained from both con-
trol and OMWW was filtered through gauze, washed
with water, and freeze-dried. Mycelium polysaccharides
were extracted with boiling water (15 mg/mL at 100 °C
for 15–18 h) under stirring. The suspension was centri-
fuged at 5000 g for 20 min and the surnatant was pre-
cipitated twice with ethanol (1/1 v/v) overnight at 4 °C
under stirring. The precipitate was re-dissolved in boil-
Table 4.
1
H and
13
C assignments of compound A in 0.5 M NaOD
aqueous (D
2
O) solution at 300 K
Proton d1
H
(ppm) Carbon d13
C
(ppm)
H-1a 4.78 C-1a 105.3
H-2a 3.55 C- 2a 75.6
H-3a 3.73 C-3a 88.2
H-4a 3.53 C-4a 70.5
H-5a 3.50 C-5a 77.0
H-6a, H-6a 3.74, 3.96 C-6a 63.1
H-1
0
a
0
4.77 C-1
0
a
0
105.5
H-2
0
a
0
3.55 C-2
0
a
0
76.4
H-3
0
a
0
3.72 C-3
0
a
0
88.6
H-4
0
a
0
3.59 C-4
0
a
0
70.4
H-5
0
a
0
3.70 C-5
0
a
0
77.1
H-6
0
a
0
, H-6
0
a
0
3.88, 4.26 C-6
0
a
0
71.0
H-1
00
a
00
4.53 C-1
00
a
00
105.1
H-2
00
a
00
3.33 C-2
00
a
00
75.5
H-3
00
a
00
3.48 C-3
00
a
00
78.3
H-4
00
a
00
3.40 C-4
00
a
00
72.3
H-5
00
a
00
3.50 C-5
00
a
00
78.3
H6
00
a
00
,H6
00
a
00
3.74, 3.96 C-6
00
a
00
63.1
Scheme 1. Structure of (1 fi 3)-b-
DD
-glucan-containing glucopyranosyl residues branched in position 6.
1132 U. Tomati et al. / Carbohydrate Research 339 (2004) 1129–1134
ing water and then precipitated with 0.2 M CTA-OH
(cetyltrimethylammonium hydroxide) at pH 12, over-
night at 4 °C. The precipitate was separated by centri-
fugation (5 min at 9000 g), washed with ethanol, and
centrifuged again; 20% acetic acid was then added to the
precipitate (5 min at 0 °C under stirring). After centri-
fugation for 5 min at 9000 g, 50% acetic acid was added
to the precipitate (3 min at 0 °C). The suspension was
centrifuged and the obtained precipitate was solubilized
in a 1.5 M NaOH solution. The soluble fraction was
washed twice with ethanol, once with ethyl ether and
once with MeOH. Finally, the obtained polysaccharidic
fraction was dialyzed, freeze-dried, and used for the
chemical characterization.
3.5. Gas chromatography
A portion of the polysaccharidic fraction was deriva-
tized to alditol acetates as follows: 5 mg of sample were
hydrolyzed with 2 mL of 2 N trifluoroacetic acid at
100 °C for 16 h and then dried with N
2
at 50 °C. One
milliliter of 10 mM inositol (internal standard), 0.1 mL
of 1 M NH
3
and 1 mL of NaBH
4
(2% in DMSO) were
added and heated at 40 °C for 90 min. Then 0.1 mL of
acetic acid, 0.2 mL of 1-methylimidazole and 2 mL of
Ac
2
O were added and left for 10 min at room tempera-
ture. After addition of 4 mL of water, the solution was
cooled and 1 mL of CH
2
Cl
2
was added. The CH
2
Cl
2
phase was separated and analyzed using a GC Hewlett–
Packard 5890A equipped with a flame ionization
detector. A capillary column, SP-2330 FS (Supelco)
(30 m · 0.25 mm · 0.20 lm film thickness), was used
with He as carrier gas at 110 kPa. Injector and detec-
tor temperatures were 250 and 280 °C, respectively;
an initial column temperature of 150 °C was held
for 2 min and then increased to 250 °C, at a rate of
4 °C/min, for 10 min. The split ratio was 1:20.
The analyses were performed in triplicate and the
identity of each sugar peak in the chromatograms
was determined by comparison with the retention
times observed for standard monosaccharidic solutions
(Sigma products).
3.6. Gel filtration chromatography
Gel filtration chromatography was performed on
Sepharose CL-4B (fine grade Pharmacia) with a
0.7 · 60 cm column and flow rate 26 mL h
À1
. Samples of
about 6 mg/mL were applied and eluted with 0.01 M
Tris(hydroxymethyl)aminomethane buffer pH 7.2 con-
taining 1 M NaOH. Fractions of 1 mL were collected
and their absorbance was measured at 280 nm. A cali-
bration curve was obtained by measuring the elution
volumes of reference substances, namely Blue Dextran,
Aldolase, Catalase, and Ferritin.
3.7. NMR spectroscopy
The polysaccharidic fraction (%2 mg) was solubilized in
0.5 M NaOD aqueous solution (D
2
O) under stirring at
room temperature (300 K).
1
H and
13
C spectra were
recorded at 300 K on a Bruker AVANCE AQS600
spectrometer operating at 600.13 and 150.9 MHz,
respectively, with a Bruker z-gradient probe head. All
one- (1D) and two-dimensional (2D)
24
spectra were
recorded using a soft presaturation of the HOD residual
signal. Chemical shifts were reported with respect to a
trace of 2,2-dimethyl-2-silapentane-5-sulfonate sodium
salt (DSS) used as an internal standard. The
1
Hand
13
C
assignments were obtained using
1
H–
1
H COSY (Cor-
relation spectroscopy),
1
H–
1
H TOCSY (total correla-
tion spectroscopy) and
1
H–
13
C HSQC (heteronuclear
single quantum coherence) experiments
24
with gradient
selection of the coherence. All 2D experiments were
acquired using a time domain of 512 data points in the
F1 and 1024 data points in the F2 dimension, the recycle
delay was 1.2 s. The
1
H–
1
H TOCSY experiment was
acquired with a spin-lock duration of 80 ms. The
1
H–
13
C
HSQC experiment was performed using a
1
J
C–H
coupling
constant of 150 Hz. The number of scans was optimized
to achieve a good signal-to-noise ratio. For all 2D
experiments a matrix of 512 · 512 data points was used;
the
1
H–
1
H COSY spectrum was processed in the mag-
nitude mode whereas all other 2D experiments were
processed in the phase sensitive mode.
DOSY experiments
25
were performed with a pulsed
field gradient unit capable of producing magnetic field
gradients in the z-direction with a strength of 55.4 G/cm.
The stimulated echo pulse sequence using bipolar gra-
dients with a longitudinal eddy current delay was used.
The strength of the gradient pulses, of 2.3 ms duration,
was incremented in 16 experiments, with a diffusion time
of 100 ms and a longitudinal eddy currents delay of 5 ms.
After Fourier transformation, phase, and baseline cor-
rections, the diffusion dimension was processed using
the Bruker X
WINNMRWINNMR
software package (version 2.5).
Acknowledgements
This work was supported by the program MIUR: Pro-
dotti Agroalimentari-Cluster C08-A, Project N.3: ÔRic-
erca avanzata per il riciclo dei sottoprodotti
dellÕindustria oleariaÕ. The authors thank Dr. Lamanna
for the
TNMRTNMR
software package.
References
1. Ikekawa, T. Int. J. Med. Mush. 2001, 3, 291–298.
2. Wasser, S. P.; Weiss, A. L. Int. J. Med. Mush. 1999, 1, 31–
62.
U. Tomati et al. / Carbohydrate Research 339 (2004) 1129–1134 1133
3. Shida, M.; Uchida, T.; Matsuda, K. Carbohydr. Res. 1978,
60, 117–127.
4. Mizuno, M.; Morimoto, M.; Minato, K.; Tsuchida, H.
Biosci. Biotechnol. Biochem. 1998, 62, 434–
437.
5. Shida, M.; Hargu, K.; Matsuda, K. Carbohydr. Res. 1975,
41, 211–218.
6. Mizuno, T.; Saito, H.; Nishitoba, T.; Kawagishi, H. Food
Rev. Int. 1995, 11, 23–61.
7. Wasser, S. P. Int. J. Med. Mush. 2001, 3, 12–14.
8. Wagner, H.; Stuppner, H.; Schafer, W.; Zenk, M. Phyto-
chemistry 1988, 27, 119–126.
9. Kraus, J.; Franz, G. In Fungal Cell Wall and Immune
Response; Latg
e, J. P., Boucias, D., Eds. NATO ASI Series
H53; Springer: Berlin, 1991; pp 431–444.
10. Bohn, J. A.; BeMiller, J. N. Carbohydr. Polym. 1995, 28,
3–14.
11. Chihara, G.; Maeda, Y.; Hamuro, J.; Sasaki, T.;
Fukuoka, F. Nature 1969, 222, 687–688.
12. Song, C. H.; Cho, K. Y.; Nair, N. G.; Vine, J. Mycologia
1989, 81, 514–522.
13. Pacifico, A. Agricoltura e Innovazione 1989, 33–73.
14. Stilbs, P. Prog. Nucl. Magn. Reson. Spectrosc. 1987, 19,
1–45.
15. Morris, K. F.; Johnson, C. S. J. Am. Chem. Soc. 1993, 115,
4291–4299.
16. Morris, K. F.; Stilbs, P.; Johnson, C. S. Anal. Chem. 1994,
66, 211–215.
17. Kapur, G. S.; Cabrita, E. J.; Berger, S. Tetrahedron Lett.
2000, 41, 7181–7185.
18. Viel, S.; Mannina, L.; Segre, A. L. Tetrahedron Lett. 2002,
43, 2515–2519.
19. Crescenzi, V.; Francescangeli, A.; Taglienti, A.; Capitani,
D.; Mannina, L. Biomacromolecules 2003, 4, 1045–1054.
20. Viel, S.; Capitani, D.; Mannina, L.; Segre, A. L. Biomac-
romolecules 2003, 4, 1843–1847.
21. Crescenzi, V.; Dentini, M.; Risica, D.; Spadoni, S.; Skj
ak-
Bræk, G.; Capitani, D.; Mannina, L.; Viel, S. Biomacro-
molecules 2004, in press. doi:10.1021/bm03487k
22. Gast, J. C.; Atalla, R. H.; McKelvey, R. D. Carbohydr.
Res. 1980, 84, 137–146.
23. Chihara, G.; Hamuro, J.; Maeda, Y.; Arai, Y.; Fukuoka,
F. Cancer Res. 1970, 30, 2776–2781.
24. Braun, S.; Kalinowski, H O.; Berger, S. 150 and More
Basic Experiments: a Practical NMR Course; Wiley-VCH:
Weinheim, 1998.
25. Morris, K. F.; Johnson, C. S. J. Am. Chem. Soc. 1992, 114,
3139–3141.
1134 U. Tomati et al. / Carbohydrate Research 339 (2004) 1129–1134