The Impacts of Farmer Cooperatives on the Standard of Living Of Cocoa Producing Villages in Côte d’Ivoire and Ghana pptx
Bạn đang xem bản rút gọn của tài liệu. Xem và tải ngay bản đầy đủ của tài liệu tại đây (3.12 MB, 88 trang )
The Impacts of Farmer Cooperatives on the Standard of Living
Of Cocoa Producing Villages in Côte d’Ivoire and Ghana
Peter Calkins and Anh-Thu Ngo
Québec, Canada
November 30, 2005
Produced with the financial contribution of
2 of 88 Calkins and Ngo, Impacts of Cocoa Cooperatives on Well-being
ACKNOWLEDGMENTS
We cordially thank the following partners in research who contributed logistically and
scientifically to the realisation of the present study:
SOCODEVI, Québec
Mario Boivin, Expert in Farmer Organisations
Maxime Prudhomme, Programme Officer, Africa
Côte d’Ivoire team
Principal Counterpart
Amoakon Mian, MBA, Sociologist and Head of Office, SOCODEVI, Abidjan
Village enumerators
Amoakon Mian, MBA, Sociologist and Head of Office, SOCODEVI, Abidjan
Bonhoro Douama, M.Sc, Economic cooperation, SOCODEVI, Abidjan
Zouza Zahiri Alexandre, Agricultural economist
Kodjo Ambroise, Accountant and economic analyst
Sadia Tao, Agronomist and pesticide specialist
Koffi Kouadio, Financial and information specialist
Ghana team
Principal Counterpart
Isaac Gyamfi, Director, IITA, Ghana
General Supervisor of Sampling and Data Collection
Christopher Asamoah, M.Sc. candidate
Regional Supervisors of Questionnaire Quality
Alexander Tano Appiah, Research and Development Officer, Kuapa Kokoo
Mabel Addy Tagoe, Research and Development Officer, Kuapa Kokoo
Patrick Kobbiah, Research and Development Officer, Kuapa Kokoo
Village enumerators
Francis Annoi (BSc., agriculture)
Matilda Annor (student)
Rita Abrokwah(student)
Paul Tandor (student)
Marnix Amofa (student)
Samuel Kwadje (student)
Most of all, we thank the villagers and leaders in the villages surrounding Tiassale,
Adzopé and Abengourou in Côte d’Ivoire; and Tepah, Konongo and New Edabiase in
Ghana, as well as pilot-test villagers in Petit Yapo near Abidjan, Côte d’Ivoire and Bipoah
near Kumasi, Ghana. Without the patience and cooperation of these cocoa farmers, the
data collection and group interviews upon which the current study is founded would quite
simply not have been possible.
Calkins and Ngo, Impacts of Cocoa Cooperatives on Well-being 3 of 88
TABLE OF CONTENTS
Executive summary 4
List of abbreviations 9
I. Introduction 11
II. Conceptual framework 19
III. Methods of sampling, data collection and analysis 22
IV. Description of the study area 29
V. Results of hypotheses testing 39
VI. Quantitative analysis 64
VII. Strategic implications and recommendations 73
VIII. Conclusions 88
4 of 88 Calkins and Ngo, Impacts of Cocoa Cooperatives on Well-being
EXECUTIVE SUMMARY
World cocoa price has fallen by some 48% over the past three years, with direct impacts on the
incomes, health and nutrition of cocoa producers and their family in the two major producing
countries: Côte d’Ivoire and Ghana, with some 41% and 22% of world output, respectively. The
impact of the price drop has been far different in the two countries because of the greater age of
plantations, market liberalisation, presence of free agents in the marketing channel, and much
greater socio-political instability in one country: Côte d’Ivoire. A final differentiating factor is the
impact of cocoa producer cooperatives, which have chosen different strategies and manifested
different strengths in the two countries. This study sought to quantitatively measure and
qualitatively evaluate those producer organisations as an essential component of the Sustainable
Tree Crops Program in four West African cocoa-producing nations, (the others are Nigeria and
Cameroon); to distinguish those impacts from the independent evolution of incomes and living
conditions in control groups in each country, as well as from the three other programmatic
components of the STCP project (technology, marketing, and government policy); to determine the
spill over of cooperative benefits to non-member households, including share-croppers; and to
recommend ways in which to enhance the relevance, efficiency, and effectiveness of the
cooperative movement as it affects cocoa producer incomes and living standards. The underlying
thesis of the study is that cooperatives, based upon seven participatory principles, represent a
unique third way of social organisation that enhances and complements, as needed, technology
development and extension, market information and organisation, and government policy. It is
particularly useful in cases of simultaneous market and government failure to assure adequate
credit, input delivery, technology training, output delivery and social development in poor areas of
Africa.
A multi-pronged methodology was employed to test this thesis in a scientifically rigorous manner.
First, quantitative surveys of 229 households in three distinct cocoa regions of Côte d’Ivoire and
224 households in three distinct regions of Ghana were conducted using an 8-page questionnaire.
In addition to direct observation of roofing, living area and sanitation in those households; a total
of 1257 children were weighed and measured to detect the percentages of stunting, wasting, and
low body mass in cooperative vs. non-cooperative and control-village households. The variables
generated from this survey were then used to elaborate descriptive statistics and head- and tail-
group comparisons for key parameters; and to test ten hypotheses using both ANOVA treatment
tests for the overall significance of regional area and membership status and Student-t tests for the
significance of means. These hypotheses sought to sort out the role of cooperatives as possible
determinants of productivity, marketing efficiency, essential service delivery, social development,
child nutritional status, incomes and well-being. To complement the quantitative data, qualitative
focus groups and semi-structured interviews with cooperative leaders, cooperative members, non-
members, and control village producers were then conducted to explore in depth the reasons
underlying the statistical results and to generate strategic recommendations for the future.
The hypothesis testing led to significantly positive results for the role of cooperatives for nine out
of ten hypotheses.
In terms of production technology (hypothesis 1), it was found that a more judicious (but no
greater) use of “modern” inputs (fertilisers, pesticides, mechanical implements) led to 19% (42 kg)
higher per hectare yields for cooperative members than for non-members, and especially control-
village producers. The results were highly significant in Ghana, but less so in Côte d’Ivoire
because of the differential stages in the cocoa cycle by regional area and the differential use of free
markets by members and non-members.
Calkins and Ngo, Impacts of Cocoa Cooperatives on Well-being 5 of 88
Cooperatives were also found to be highly beneficial in terms of cocoa marketing. Members
receive fairer weight and quality evaluations of their beans (hypothesis 2), superior marketing and
transportation services (hypothesis 3), and higher revenues both per bag (prices including bonuses
paid by the coops to their members for yield, weight and grade accorded) and per hectare
(hypothesis 4) than non-members or control farmers.
This result had also been demonstrated in 2003 (table 1). At that time, a study was done involving
eight local farmer-run cooperatives in Côte d’Ivoire. In the 2002/03 cocoa harvest season, seven
cooperatives worked through a cooperative union call COMKA on three unique ways to boost the
local prices paid to the cooperative for cocoa. A total of 18,700 metric T of cocoa were sold using
these strategies, impacting 10,900 member farmers. Comparisons were made between the prices
available to individual farmers not selling cocoa through the cooperative to those who sold through
the three ways programs.
The first system related to times of sale. If a truck load of cocoa can be sold at the right time,
either in the evening or early the following day, better prices will be paid by exporter. This system
relies on knowledge of the variation of the world prices paid at the London and New York Boards
of Trade. Using this method, 18,467 T of cocoa were sold at an
average
price of US$ 1,180.00 per
metric T, 2.5% increase in price, or US$28.73 per metric T compared to selling cocoa without this
marketing method. The total increase in returns was US$530,700 or an average of US$49.10 per
farmer.
A second method saw COMKA negotiating with exporters a premium basis on the perspective of
receiving a higher volume. Such group negotiation added US$16.42 per metric T on top of the
daily fluctuating buying price, a 1.4% improvement over prices paid to non members of COMKA.
The total increase in returns was US$302,900 or an average of US$28.00 per farmer.
The third method bypassed the local buyer (exporters based in Côte d’Ivoire) to sell cocoa directly
to importers located outside of the country. Under that method, 402 metric T of cocoa were sold at
an average increase in price of US$133 per metric T. This system increased total price by $53,650
(9.5%).
Table 1: Ways to improve local price
Quantity Price
increase/farm
gate price
Increase/Ton Total increase Income increase/farmer
Tons % US $ US $ US $
Time of sale 18 467 2,5% 28,73 530 700 48,69
Premium on
volume
18 467 1,4% 16,42 302 900 27,79
Export 402 9,5% 133,00 53 650 4,92
TOTAL 18 870 887 250 81,40
Mean per ton 47,00
In the 2002/03 cocoa season, the combined efforts of these three programs increased the price paid
for cocoa by US$887,250 or an average of US$47.00 per metric T. For benefiting farmers this
represents an added income exceeding US$81.00.
In addition, results from a parallel study in Cameroon show that coop members receive 6kg (10%)
higher weight per bag compared to those selling to local buyers.
6 of 88 Calkins and Ngo, Impacts of Cocoa Cooperatives on Well-being
These results indicate that there are multiple ways to improve the efficiency of cocoa marketed in
West Africa. Similar marketing systems are also being used to increase the prices paid to farmers
for coffee and other commodity crops grown in the region.
Another key area of cooperative strength was found to lie in the provision of essential services: in
technical training in production, marketing and management; cash advances and credit-based sale
of inputs; marketing services; household loans; medical services, infrastructural and social
investments, and group-based consumption purchases (hypothesis 5). A composite satisfaction
scale proved conclusively that cooperative members are significantly more satisfied with the
services they receive through the cooperative than non-members and control farmers respectfully
are with services from alternative suppliers. In a related hypothesis, it was also found that cocoa
cooperatives are highly instrumental in giving production, marketing, and management training
(hypothesis 6) not only to their members, but also to their share-croppers and non-member
neighbours (figure 1 and table 2). In this and other areas, the spill-over benefits flowing from
members to non-members were found to be substantial.
Table 2: Cooperative training performance
Sources of advice for cocoa producers
Coop STCP
Govern-
ment
Private
company
Total
(times)
% of training
share by COOP
% difference from
members
Whole sample 349 376 331 44 1100 31,73%
Members 282 322 142 15 761 37,06%
Non-members 60 54 100 19 233 25,75% -69,38%
Control 7 0 89 10 106 6,60% -86,07%
Côte d'Ivoire 90 366 55 12 523 17,21%
Members 71 320 22 3 416 17,07%
Non-members 19 46 19 6 90 21,11% -78,37%
Control 0 0 14 3 17 0,00% -95,91%
Ghana 258 8 276 31 573 45,03%
Members 212 1 121 13 347 61,10%
Non-members 40 7 81 13 141 28,37% -59,37%
Control 7 0 74 7 88 7,95% -74,64%
The results on social and community development (hypothesis 7) were also positive. Direct
experience with cooperatives led members to award significantly more positive evaluation (3.07
out of 5) to the role of cooperatives in the socio-economic development of their village than non
members (2.44) or control farmers (1.6). Household re-organisation (hypothesis 8) also allows
member women spend almost 6% more of their time in “productive” (income-generating) vs.
“reproductive” (cooking, cleaning, fetching) activities, as compared to control farmer women. Yet
traditional gender roles and cultural values still resist the democratizing winds of the cooperative
movement. This effect was even seen to extend to school age children in one region: Tiassalé, in
Côte d’Ivoire. There, bad harvest and resulting cash-flow problems in the school-return period
have made member families, those most dependent upon cocoa revenues, unable to send all their
children to school. They choose to keep the girls, rather than the boys, home.
In terms of standard of living and quality of life (hypothesis 9)
one fact is that most of members
live farther away to clinics and markets meaning they are in real need of collective transportation
to get the sick to hospital and themselves and their products to market.
Calkins and Ngo, Impacts of Cocoa Cooperatives on Well-being 7 of 88
Members have larger living areas and total possession value than non-members but generally not
as large as the control groups since they live in different villages, often in more favourable
environments closer to markets.
In Côte d’Ivoire, members have significantly higher habitat quality (roof and wall quality,
electricity source, drinking water, bathing and bathroom facilities) than non-members. The results
although in Ghana are the opposite where both control and non-members have significantly higher
score than members. It is surprising, however, it stems from a conscious decision on the part of
Kuapa Kokoo leaders to implant their new cooperatives amidst the very poorest and most
desperate populations in rural areas. There has not yet enough time for those disadvantaged areas
(the three distinct areas identified) to build up the long-run components of habitat quality.
There are no significant differences in health status among members, non-members and the control
group. Although non-significant, non-members do seem to have marginally higher percentages of
sickness than members in all regions, even though they live in same villages. Control farmers are,
on the other hand, slightly less sick than members, probably because of their greater proximity to
clinics, roads and markets.
In terms of child well-being more generally, there is a severe and generalised problem of stunting,
wasting, and low body mass throughout the region that the cooperative movement, in concert with
government organisations and NGOs, must make every effort to combat. In Côte d’Ivoire, one in
six boys and girls under five years of age are severely malnourished; that is, their height and
weight for age are more than three standard deviations below the WHO standards. In Ghana, the
corresponding figures are one in 14 boys and one in 12 girls. As children age (6 to 14 years) the
situation gets worse: one in every four boys and girls in Côte d’Ivoire and in Ghana are severely
stunted, wasted, or both. Against this background, cooperative members’ children are generally
taller and more filled out than non-member children. Although farmer associations, government
and NGOs may all be valued partners in the struggle to improve living standards and health care in
rural Africa, no single actor can improve the livelihood alone. All actors, with their unique
strengths, should be involved in an integrated strategy to combat ill health and malnutrition in the
entire region.
Taken together, these results lead us to reject hypothesis 9 as written: The quality of life is not
significantly lower for members than for control-village producers despite the significantly shorter
distances that separate the latter from clinics and markets. However, on the other hand it is
recognized the important achievements of the cooperative in housing, habitat, health and nutrition
they have made compared to their within-village neighbours.
Finally, incomes per capita (hypothesis 10) are 2.6% and 12% higher for members vs non-
members and control farmers (figure 2); because cooperatives have allowed farmers (figure 3) to
specialize in (achieve 5% and 12% higher percentage of their revenues from) cocoa as an income
source in both countries. Results have demonstrated that members of cooperatives do have higher
income than control farmers in all areas, except in Tiassalé (Côte d’Ivoire). As a result, the quality
of life (as captured in living area per capita) is higher for members.
8 of 88 Calkins and Ngo, Impacts of Cocoa Cooperatives on Well-being
168,1
163,93
150,36
140 $
145 $
150 $
155 $
160 $
165 $
170 $
Members Non-
members
Control
Figure 2: Income per capita
(USD) of
producer groups, (Whole sample)
76%
71%
64%
68%
60%
58%
86%
83%
70%
0%
10%
20%
30%
40%
50%
60%
70%
80%
90%
Côte d'Ivoire
Figure 3: Cocoa incomes as % of total incom
e
Ghana Whole sample
Given these unique contributions to productivity, marketing, essential service provision, social
development, and income, the concluding strategic section of the report outlines three fundamental
suggestions for enhancing and expanding that contribution in the future. First, it is essential that
cooperatives be actively involved as one of several component thrusts within an overall strategic
plan. Cooperatives cannot do all of the work alone. If cooperatives are to help extend technology,
those must be generated by well-financed and qualified agronomists. If cooperatives are to
improve marketing power, promote vertical integration and equitable pricing, others must be
working to generate up-to-date market information as well as the tangible and intangible
scaffolding of efficient markets. If cooperatives are to implement, and in some cases even inform,
government policy, that policy must take to heart to what extent the development needs of the
nation depend upon improving well-being in each courtyard.
Second, we recommend exchange visits between farmers with similar problems – or
complementary solutions – to help to seek common strategies for cocoa production, marketing and
well-being improvement at the household and community levels. The five-point radar diagrams in
the last section of the report suggest which sites in Côte d’Ivoire and Ghana would likely most
profit from such exchanges. Of particular interest are cases where the successes of one region may
provide the answers to another, and vice versa.
Third, we encourage continuation and expanded funding for the STCP platform and similar
initiatives in Africa as a whole. The issue of well-being is not limited to the six regions selected
for this report, nor to cocoa as a crop. It has to do with the sustainable improvement in the levels
and inter-household distribution of income, dignified employment, health and nutrition throughout
the entire developing world, not least in West Africa. Sustainable tree crops of all types and
sustainable social institutions including cooperatives must therefore be given much greater
financial and policy importance in the future. In the specific context of the STCP, the positive
results of this study suggest that the scope and reach of all four components should be considerably
expanded in the next phase of the project.
Calkins and Ngo, Impacts of Cocoa Cooperatives on Well-being 9 of 88
LIST OF ABBREVIATIONS
COMKA
FCFA The FCFA franc, monetary unit used in French-speaking West Africa
FO Farmers’ organisations
ICCO International Cocoal Organization
IITA International Institute for Tropical Agriculture
K Potassium fertiliser
KK Kuapa Kokoo, a major cocoa producer cooperative in Ghana
LBC Licensed Buying Company, private and cooperative enterprises legally
allowed to purchase cocoa beans in Ghana
N Nitrogen fertilieer
P Phosphorus fertiliser
QCO Quality Control Officer (in Ghana)
SOCODEVI Société pour la coopération et le développement international
SPSS Statistical Package for the Social Sciences spreadsheet
STCP Sustainable Tree Crops Program
WHO World Health Organisation
FDPCC Fonds de développement et de promotion du café et du cacao
BNETD Bureau National d’Études Techniques pour Développement
FAO Food and Agriculture Organisation of the United Nations
MPs Members of parlement
FGCC Fonds de garantie des coopératives café-cacao
USAID United State Agency for International Development
JSS Junior secondary highschool
PPP Public Private Partnership
PPPP Public Private participation Partnership
c.i.f. Charges insurance and freight
f.o.b. Free on board
Calkins and Ngo, Impacts of Cocoa Cooperatives on Well-being 11 of 88
I. Introduction
I.1 The real-world problem
World cocoa markets are in crisis. Global production of cocoa beans in the 2003-2004 and
2004-2005
1
crop years reached 3.21 million tonnes, some three percent higher than in
2002-2003. This would seem to signal steady progress in world production and yields. But
since chocolate bars, chocolate cakes, chocolate ice cream, and hot chocolate are the
mainstay of desserts in many countries; the derived demand for cocoa beans is highly
inelastic: a slight increase in production brings about an enormous fall in price. Between
2002-3 and 2003-4 the world price for cocoa dropped a full 48% on world markets, from
some 3000 dollars US per ton to about 1560 dollars in 2003-4
2
and 1580 dollars as of
April, 2005
3
. Given relatively fixed margins for marketing intermediaries (exporters,
middlemen, and assemblers), the largest bite of the price shrink was taken out of prices
paid to producers. This of course had a direct impact on their incomes and food security.
Malnutrition and diseases rose without the revenues to pay for health care or even health
centres to go to.
According to a Dow Jones newswire on August 9, 2005, “low prices have crushed
farmers willingness to invest in fertiliser, pesticide and insecticide to boost and protect
their crop”. But the impact of world market conditions on cocoa producers may have
quite different effects depending upon national policies, production and marketing
conditions, and social development, notably that of farmer organisations (FO). First,
Agricultural Structural Adjustment policies promoted by the World Bank and the
International Monetary Fund have induced most cocoa-producing countries, like Côte
d’Ivoire, to liberalise internal cocoa markets and prices, making international price
fluctuations surge through their markets like a direct electric current. Ghana,
exceptionally, has not, preferring to maintain a government-established base price fixed at
some 72% of c.i.f. world price as opposed to only 41% in Côte d’Ivoire
4
! This fact
explains why much cocoa production has leaked from Eastern Côte d’Ivoire across the
border into Ghana, helping to equilibrate the impacts on farmers in the two countries.
Second, given the relatively young age of plantations and the higher prices received, cocoa
producers in Ghana continued their steady increase in output levels (perhaps the single
most important
cause
of the fall in world prices!) The 46% upsurge in cocoa output in
each of the past two years (Table I.1), has brought Ghana to a level of production that is
22.3% of total world output, and more than half of that of Côte d’Ivoire for the first time
in history. It is a matter of some debate how much cocoa output is erroneously deducted
1
Estimates of the FAO, Food Outlook, No. 2, June 2005.
2
This statistic and much of the information in this section are drawn from BNETD/Observatories Café-
cacao – Commercialisation due cacao. Rapport annuel 2003/2004.
3
FAO, ibid. Reuters attributes the slight increase in prices to both surplus demand on world markets and
political unrest in Côte d’Ivoire.
4
BNETD/Observatoire Café-caco – Commercialisation du caco. Rapport annuel 2003/2004, pp. 4 and 20.
12 of 88 Calkins and Ngo, Impacts of Cocoa Cooperatives on Well-being
from the statistics of Côte d’Ivoire and attributed to those of Ghana due to cross-border
leakages, but the trends seem clear.
Table 1: Trends in cocoa production in Côte d’Ivoire, Ghana, and the world (tonnes)
1999/2000 2000/2001 2001/2002 2002/2003 2003/2004 2004/2005
5
Ghana
437,000 341,000 497,000 720,000 580,000
Côte d’Ivoire
1,400,000 1,212,000 1,265,000 1,320,000 1,340,000 1,330,000
World
3,007,600 2,853,400 2,851,300 3,102,000 3,200,000
6
3,200,000
Third, the presence, roles, and impact of cooperatives in the two countries may also differ
substantially, even though it is widely recognised that technology-led increases in yield
must be married with cooperative-led improvements in price
7
and community
organisation. In April 2005, for example, the Ghanaian cooperative association Kuapa
Kokoo sent two of its representatives
8
to London to meet Prime Minister Tony Blair,
Treasury Minister Gordon Brown and several MPs in order to promote the fair trade of
“equitable” chocolate, which seeks to give a higher share of the final consumer pound
sterling directly to farmers. Meanwhile, during the 2003/2004 crop year in Côte d’Ivoire,
producers not associated in cooperatives were forced by low prices to sell off their beans
earlier than usual at harvest time (October through January, with a peak in December).
Cooperatives in contrast were able to spread out sales much more evenly over the year
because of better storage facilities and market management. This is a vital role, because
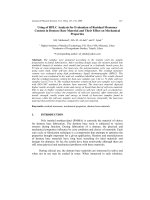
historical patterns over the past ten years (Figure 1) show that average prices have been
highest (red line) and least volatile (blue line) in March. Holding off part of sales till that
month is thus one way to increase the value added accruing to struggling producers and to
have a strong regularising effect on the prices received by both members and non-
members. A key requisite of such a strategy was the 25 to 30% of financing, an increase of
between 5 and ten percentage over the previous year, that came from the cooperative
itself. This is because cooperative financing coming from other funds (loans and subsidies
of the FDPCC, exporters, and the FFGCCC) had fallen. Partly has a result, cooperatives
continued their trend of paying their members (and non-member sellers) increasingly in
cash.
Fourth, the structure of the marketing chains in the two countries also diverges
substantially. The prices to producers in Ghana are fixed, but vary by region in Côte
d’Ivoire, from a low of 334 FCFA per tonne in the Southwest to a high of 378 FCFA per
tonne in the East, where the present study was conducted. This discrepancy is largely due
to the weak presence of cocoa FOs in the former zone, forcing producers to sell the virtual
totality of their crop to pisteurs backed by Lebanese exporters. Meanwhile, the export
margin in Côte d’Ivoire has grown substantially, from 265 FCFA per kg in 1999/2000 to
435 in 2003/2004, despite the drop in world prices and become increasingly erratic over
time and place. This may be attributed to the licensing fees, fuel, driver salaries, formal
5
Reuters estimate
6
The FAO reports 3,400,000.
7
See for example, STCP Impact Brief issue no. 2, april 2005.
8
Including Ms. Veronica Mintal, Treasurer of the Regional Area in Konongo, one the research sites selected
for the present study.
Calkins and Ngo, Impacts of Cocoa Cooperatives on Well-being 13 of 88
tolls and informal extortions, labour, and other costs beyond the control of the pisteur; but
the end result is to squeeze down the share of export price received by the non-cooperative
producer, from 53% in 2001/2002 to a mere 41% in 2003/2004. Despite the long-term
advantages of liberalisation, a standardisation and regulation of marketing margins in the
short run would seem an urgent priority.
Figure I.1: Indices of seasonal price and inter-annual variability for cocoa,
1995-2005
Index (C.V. and October=25)
30
Monthly variability compared to October = 25
25
Intern annual price instability for each month
20
15
10
5
0
123456789101112
Month
Source: Our calculations from International Cocoa Organisation, ICCO Monthly and Annual Average of
Daily Prices of Cocoa Beans, 1960-2003; daily prices 2004-2005. www.icco.org/prices
Finally, the socio-political situation in the two countries differs markedly. Ghana, while by
no means a prosperous nation, is blessed with unusually stable social and political
conditions. Meanwhile, Côte d’Ivoire is beset by mounting unrest between the local
population and burkinabé immigrants over land rights, generalized tension in the north of
the country due to increasing poverty, and occasionally violent jockeying for power
between the current ruling party and hopefuls in the upcoming elections in October.
Although on April 6, 2005, government and leaders of rebel forces agreed to end
hostilities, continued unrest, including the assassination of nine gendarmes in July, has left
roads in serious disrepair and made deliveries of inputs and cocoa beans precarious and
expensive. Indeed, the surveys upon which the present study are based had to be
interrupted for ten days after the assassination of the gendarmes. An agreement is needed
between President Laurent Bgagbo and rebels in the North on disarmament and political
reforms before one can prepare election lists or reduce tensions and promote free
commodity flows within the country.
14 of 88 Calkins and Ngo, Impacts of Cocoa Cooperatives on Well-being
This study will explore the relative weight of all the conditioning variables upon the most
important result of swings in international prices and internal marketing margins: the
incomes, health, and education of cocoa producers and their children. It will seek to
determine whether, as compared to purely market-based policies or direct government
intervention, the voluntarist approach associated with cocoa cooperatives freely set up and
joined, seems an essential component of a strategy to improve productivity, incomes and
well-being in the long run.
I.2. Purpose of the study
More specifically, the mandate for this study includes five objectives of vital importance
for the sustainable development of the cocoa industry in West Africa:
) To measure quantitatively and evaluate qualitatively the roles, impacts, and relative
importance of cocoa farmer organisations in the improvement of the productivity,
market power, management ability and socioeconomic well-being of member
households in Côte d’Ivoire and Ghana.
) To distinguish those impacts from the independent evolution of living conditions on
the part of non-members within the same villages, as well as cocoa producers in
control villages.
) To evaluate to what extent the impacts of cocoa cooperatives flow over as positive
externalities to share-croppers and other non-member neighbours, as distinct from
cocoa producers in control villages
) To measure the degree of positive reinforcement between the presence of
cooperatives on the one hand, and the impacts of agronomic research and
dissemination; marketing infrastructure, information, and integration; and appropriate
government interventions and policies on the other.
) To recommend ways in which the relevance, efficiency and effectiveness of FOs
may be further enhanced in the short and long runs as a component of a complete
socioeconomic development strategy for the troubled cocoa sector in Côte d’Ivoire
and Ghana.
I.3 Testable hypotheses
To realise these objectives, this study combined quantitative and qualitative techniques of
data collection and analysis. The former employed descriptive statistics, cross-tabulations,
head- and tail-group comparisons, ANOVA tests of regional area- and membership status
treatment, and Student t-value tests of means to validate the following ten hypotheses to
detect significant differences in productivity and standards of living associated with by the
presence of FOs:
Calkins and Ngo, Impacts of Cocoa Cooperatives on Well-being 15 of 88
Production
Hypothesis 1: The intensity of “modern” input use (fertilisers, pesticides,,
mechanical implements) and hence per hectare yields of members are significantly
higher than those of non-members, especially control-village producers.
Marketing
Hypothesis 2: Cooperative members receive fairer weight and quality evaluations
of their beans from cooperatives than non-member and control farmers received
from the private sector.
Hypothesis 3: Cooperative members receive better marketing and transportation
services from the cooperative than non-members or control group farmers obtain
from other sources, if any .
Hypothesis 4 : The cocoa revenues of members (prices including bonuses paid by
the coops to their members for yield, weight and grade accorded) are significantly
higher per household and per hectare than those of non-members, especially
control-village producers.
Services
Hypothesis 5: The services (technical training in production, marketing and
management; cash advances and credit-based sale of inputs; marketing services;
household loans; medical services, infrastructural and social investments, and
group-based consumption purchases) received by members are significantly more
numerous and of greater quality than for non-members, especially control-village
producers.
Hypothesis 6: Cocoa cooperatives are highly instrumental in giving production,
marketing, and management training to their members, as well as share-croppers
and neighbours.
Social development
Hypothesis 7: Through their direct experience with cooperatives, members award
more positive evaluation to the role of cooperatives in the socioeconomic
development of their village.
Hypothesis 8 : The decision-making role and the “productivity” ratio
9
of member
household women are significantly higher than for non-member women, especially
those in control villages.
Well-being
Hypothesis 9 : The quality of life (living area per capita, total value of
possessions, habitat quality, health, and child nutritional status) is not significantly
9
The productivity ratio is defined as the percentage of productive work (income generation, child education,
self-education, decision-making) to reproductive work (house-cleaning, child-care, cooking, water- and
wood-gathering).
16 of 88 Calkins and Ngo, Impacts of Cocoa Cooperatives on Well-being
lower for members than for control-village producers despite the significantly
shorter distances that separate the latter from clinics and markets.
Hypothesis 10: Incomes per capita are higher in member households than non-
member households, especially those in control villages.
I.4 Research questions
To complement these quantitative data, we also conducted qualitative focus groups of
farmers and semi-structured interviews of village- and cooperative leaders as additional
sources of information on the activities and perceptions of cooperative members vs. other
cocoa producers. We were particularly interested in the causes lying behind any significant
contributions that might appear in the statistical analyses. We therefore sought to provide
clear and objective answers to the five following questions:
Production
1. What factors, if any, have permitted member farmers to learn about and finance
appropriate technical changes more effectively than non-members or control farmers?
Marketing
2. What equipment and practices, if any, have allowed cooperatives to award higher
prices, fairer quality grades, and heavier scale weights to beans sold to them by member
farmers, non-member and control farmers, and share-croppers?
Services
3. What criteria and procedures, if any, have made cooperatives a more accessible and
advantageous source of credit, input purchase, household- and school loans to cocoa
farmers?
Social development
4. What direct or indirect contributions by cooperatives, if any, have helped them to bring
about greater social organisation, socioeconomic development, educational and health
infrastructure, and child well-being in villages where they are installed, as compared to
control villages?
Well-being
5. What factors and practices, if any, have led cooperative member households to enjoy
higher incomes, healthier surroundings, and better nutrition than other cocoa-producing
households?
Calkins and Ngo, Impacts of Cocoa Cooperatives on Well-being 17 of 88
I.5 Context of the study
10
A cocoa cooperative is like a cocoa tree: to survive, it must be managed sustainably, kept
clear both of market imperfections at its base and the choking mistletoe of excessive
regulation at the top. That is why the Quebec-based non-governmental cooperative agency
SOCODEVI (Société de cooperation pour le développement international) began
collaborating even
before
the current world cocoa crisis, with the STCP (Sustainable Tree
Crop Program) of the IITA (International Institute for Tropical Agriculture). It was in
1998 that the first contacts were made with the program, then in its infancy. SOCODEVI,
whose expertise has been principally recognized in terms of strengthening FOs, was given
a short-term mandate in the start-up phase in Côte d’Ivoire. This mandate involved setting
up an information management system and improving the quality of cocoa beans in the
two target cooperatives. Because this first collaboration was judged fruitful; it led to
expanded involvement by SOCODEVI in the “pilot experiment phase” which lasted two
years and ended with the conduct of an external review in January 2005.
During this second phase, STCP awarded SOCODEVI the role of piloting one of the
program’s four components: the reinforcement of farmer organisations in the four target
countries (Côte d’Ivoire, Ghana, Cameroon et Nigeria). To do so, a technical adviser from
SOCODEVI was assigned to Yaoundé. His role was to help coordinate national STCP
programs in each of the countries in support of cocoa producers.
The external review in January 2005, while recommending that the STCP continue in a
subsequent phase of between five and 10 years, questioned the relevance of FOs as a key
component of the project. Notably, the external reviewers were not convinced by
arguments that had been advanced by several institutional actors involved with, in favour
of the positive impacts of cooperatives on the producers themselves.
The STCP program is ambitious and complex, not only in terms of its objectives but also
in terms of the partnerships upon which it is based. Given the number of institutional
actors with interests that do not always converge, the STCP chose to address the cocoa
sector by uniting around the same table such diverse organisations as:
• International aid agencies (notably USAID);
• The chocolate industry;
• FOs;
• Research institutions;
• NGOs
• Governments (it is eventually hoped).
Up till now, budgets have remained relatively limited compared to the ambitions of the
program. The initial agenda was also influenced by the emerging program priorities of
certain actors. For instance, the sensitive question of the use of child labour on cocoa
plantations became a priority after such cases were reported in 2001 in American and
British newspapers. The possibly dangerous or abusive work done by children in the
10
This section has been translated and adapted from the French terms of reference for this study.
18 of 88 Calkins and Ngo, Impacts of Cocoa Cooperatives on Well-being
production cycle of cocoa also corresponded to a priority of industrialists who continue to
exercise a considerable influence on the program.
In its collaboration with the program, SOCODEVI major preoccupation always remains to
promote the long term interests of cocoa producers and the improvement of their living
conditions. SOCODEVI always tried to reconcile that goal while collaborating with the
industry. In fact, through this collaboration, SOCODEVI worked not only to reinforce the
farmers organisation but also to strengthen the economic tied between the farmers
organisation and some of their foreign clients. This role has not always been well
understood among some of the STCP stakeholders.
Following the external review of the STCP of January 2005, a one-year “transition phase”
was projected in order to plan the second phase of the program (2006-2010). Financial
support was allocated by industry and USAID to continue the “Research and
Dissemination” and “Impact Assessment” components. The “Farmer Organisation”
component went un-financed. The industry limited its financing to the sole component it
considers most relevant in terms of child labour – the Farmer Field School – because it
seemed to yield good results. Nor did USAID wish to commit itself financially to the
budget SOCODEVI submitted.
Faced with this situation, SOCODEVI made a financial contribution out of its program
fund, which it had already done during the 2-year pilot phase. This new contribution was
approved on June 3, 2005. However, the refusal of the other STCP partners to support
financially the FO component has cast doubt upon SOCODEVI’s future involvement in
this program despite the fact that the Program Manager and national coordinators of the
STCP support the idea of maintaining aid to FOs.
Before moving forward with any new involvement within the STCP, SOCODEVI decided
to conduct a socioeconomic impact study to verify whether FOs bring positive impacts to
the cooperative members, their household and their community. SOCODEVI wanted to be
able to go beyond anecdotic evidence, guts feelings, personal opinion, or short term
“success story” to decide where to go on investing to better support the farmers and have
the highest return with its investment.
Calkins and Ngo, Impacts of Cocoa Cooperatives on Well-being 19 of 88
II. Conceptual framework
II.1 Four thrusts of well-being improvement in cocoa producing regions
As noted, phase I of the STCP-PPP project to improve living standards in four cocoa
producing countries was based on four major thrusts: a) improvements in marketing and
market information, b) research and extension into new varieties and production
techniques, c) government price and extension policies, and d) multiplication and
deepening of farmer cooperations (Figure II.1). The first of these thrusts (a) sees the cocoa
producer as a profit maximiser, the second (b) as a yield maximiser, the third (c) as a
passive subject, and the fourth (d) as a pro-active citizen. The combination of these roles is
at the origin of the expression PPP: Public-Private Partnership. The objective of this
report is to evaluate to what extent a fourth “P” – Participation is essential to the success
of the first three.
II.2 The unique functions of cooperative organisations
Why do co-operatives exist?
Cooperatives represent a unique third way of social organisation that springs to life when
the two other forms – markets and governments – fail to provide inputs, outputs, and
social goods or services efficiently. For example, where the private sector and markets
function well, there is no demand for farmer organisations at the community level.
However, in the case of “market failure”, such as the absence of markets or the presence
of monopoly, it is normally first up to the government to correct the problem, either with
construction projects or with appropriate legislation.
Similarly, when government is able to provide schools, health centers, and drinking water,
there is no demand for farmer organisations at the community level. However, in the case
of “government failure”, such as the absence of jobs or the presence of inefficiency, it is
first up to the market to correct the problem, either with private entrepreneurial investment
or with profit-linked incentives.
It is therefore particularly in cases of simultaneous market and government failure that
cooperatives and other forms of voluntary participation become the natural, and only,
recourse. In many countries, particularly those in economically underdeveloped or
politically over-managed context, they may provide important functions within the overall
process of social development. Cooperatives will tuned therefore to seek out and assign
themselves to relatively difficult and disfavoured areas.
Once installed, cooperatives have unique strengths that allow them to survive and continue
to perform vital services even after initial failures have been solved. That is why Asia is
going through a renaissance of the cooperative movement to development market-savvy
but socially responsible “new-style” cooperatives in Vietnam, Cambodia, China. Indeed,
the objective observer of the world today will note that such new-style cooperatives are
one of the rare successful examples of applied socialism. But it should be noted that many
20 of 88 Calkins and Ngo, Impacts of Cocoa Cooperatives on Well-being
EDUCATION
Yrs/household head
Total per household
Girls:boys Formal/informal
GENDER REL’NS
Decisions by women
Gender of household head
Household chores by sex
INFOR’N & EXTENSION
Extension workers / farmer
Radio and booklets
Farmer Field Schools
FAMILY STRUCTURE
Family members per worker
Age of household head
Children under 12
COOP TRAINING
Financial management
Human relations
Decision making
INCOME & WEALTH
Income per capita House type
m2 / capita Total possessions
MARKET PRICE
Nominal vs. real
Paid vs. received
HEALTH SERVICES
Proximity to clinic
Prices paid
Doctor:patient ratio
CREDIT
Source of loan/credit
Amount of loan/credit
POLICY ENVIRONM’T
Production
Marketing and export
Income
HEALTH
Illness/cap Nutr. status
Medical expenses/cap
Child workers < 12
AGRONOMIC
RESEARCH
New cocoa varieties
New prod’n techniques
R
E
S.
&
D
I
S
S
E
M
V
O
L
U
T
A
R
I
S
M
FARMER ORGAN’NS
Member vs. non-member
Distance to coop office
Country / region
GOV
ER
N
ME
N
T P
O
LI
C
Y
VERTICAL
INTEGRATION
Commercial ec. of size
% of consumer price
received
M
K
T.
&
I
N
F
O
Figure II.1: The place and key roles of Farmers Organisations in the improvement of living standards
Calkins and Ngo, Impacts of Cocoa Cooperatives on Well-being 21 of 88
countries, even Canada, are semi-socialist in their vision of social programs, free health-
care, and subsidised education. Cooperatives may also serve other vital functions of
community development. For example, in Vietnam, cooperatives serves as an important
extension arm of the government; in Ghana or in Cameroon, to organise vaccinations and
implement social investments at the base level.
Cooperative organisations may be vital to the African cocoa sector because they are
directed by the producers they serve and because they are guided by a set of seven
principles that reflect the best interests of those producers. Indeed, all FOs should adhere
to seven cardinal principles
11
:
1. Voluntary and Open Membership — Cooperatives are voluntary organisations, open
to all persons able to use their services and willing to accept the responsibilities of
membership, without gender, social, racial, political, or religious discrimination.
2. Democratic Member Control — Cooperatives are democratic organisations
controlled by their members, who actively participate in setting policies and making
decisions. The elected representatives are accountable to the membership. In primary
cooperatives, members have equal voting rights (one member, one vote) and
cooperatives at other levels are organized in a democratic manner.
3. Members’ Economic Participation — Members contribute equitably to, and
democratically control, the capital of their cooperative. At least part of that capital is
usually the common property of the cooperative. Members usually receive limited
compensation, if any, on capital subscribed as a condition of membership.
Members allocate surpluses for any or all of the following purposes: developing the
cooperative, possibly by setting up reserves, part of which at least would be
indivisible; benefiting members in proportion to their transactions with the
cooperative; and supporting other activities approved by the membership.
4. Autonomy and Independence — Cooperatives are autonomous, self-help
organisations controlled by their members. If they enter into agreements with other
organisations, including governments, or raise capital from external sources, they do
so on terms that ensure democratic control by their members and maintain their
cooperative autonomy.
5. Education, Training, and Information — Cooperatives provide education and
training for their members, elected representatives, managers, and employees so they
can contribute effectively to the development of their cooperatives. They inform the
general public, particularly young people and opinion leaders, about the nature and
benefits of cooperation.
6. Cooperation among Cooperatives — Cooperatives serve their members most
effectively and strengthen the cooperative movement by working together through
local, national, regional, and international structures.
7. Concern for Community — While focusing on member needs, cooperatives work for
the sustainable development of their communities through policies accepted by their
members.
11
This particular formulation is drawn from the National Rural Electric Cooperative Association, USA.
22 of 88 Calkins and Ngo, Impacts of Cocoa Cooperatives on Well-being
III. Methods of sampling, data collection and analysis
III. 1 Sample selection
As noted, Phase I of the STCP-PPP project has been active in four countries: Côte
d’Ivoire, Ghana, Nigeria, and Cameroon. For this study, we decided to concentrate on the
two most important producers, to include one French and one English-speaking nation
and to compare one country with free-market policies and the other with a state-controlled
marketing board. Côte d’Ivoire and Ghana became the obvious choices as countries of
study.
We then selected three major cocoa producing zones in each country in order to capture
important differences in agroclimate, age of plantations and proximity to markets. In Côte
d’Ivoire, we selected three regional areas in the Eastern zone, which has supplied 50%,
74% and 59%
12
of national cocoa production over the past three years and therefore
between a fifth and a third of world production! These regional areas were Tiassale,
Adzopé and Abengourou. These zones were selected to reflect, respectively, below-
average, average, and above-average conditions of climate (rainfall, lack of heat waves),
market access (proximity, roads, infrastructure development), soil (fertility, irrigation,
lack of erosion), management (by society leaders) and socio-economic conditions
(income, gender, social relations). Notably, Abengourou lies quite close to Ghana, both
geographically and linguistically; and is therefore in a position to sell cocoa beans across
the border if prices in Côte d’Ivoire fell to low.
Similarly in Ghana, we selected as the central point the city of Kumasi, home base of
Ghana’s most important cocoa cooperative: Kuapa Kokoo. We then choose three regional
areas within approximately 100 km of Kumasi: one on the Kumasi-Cape Coast highway
(New Edubiase); one on the Kumasi-Accra highway (Konongo); and one on the Kumasi -
Sunyasi highway (Tepah). These areas also reflect, in the order named, descending levels
of cooperative experience and cocoa yield.
In each of these six regional areas, we drew a random sample
13
of 75 producer
households: 35 who were members of cooperatives, 20 non-members who were
immediate neighbours of the members selected and might therefore benefit from spill-over
effects of cooperative membership, and 20 control-group producers who lived in villages
with similar climate and marketing conditions to the first two groups, but which had never
had a cooperative established in the community. That at least was our intention. Under
actual field conditions, it was problematic finding control villages that were as far from
markets and as poor as FO villages and yet were still producing cocoa. Villages closer to
roads felt less need for cooperatives while those farther away had switched to other
12
BNETD, p. 7.
13
To select the households to be surveyed, we start with the complete list of member households for the
target society or societies. We then divide by 35 to find the “selection interval” defined as total members/35.
For example, if there are 700 member households in the societ(ies), the selection interval = 700/35 = 20.
Every twentieth house-hold on the list will be selected, starting with a household number selected from one
to 12 by the roll of two dice.
Calkins and Ngo, Impacts of Cocoa Cooperatives on Well-being 23 of 88
agricultural products (fish, livestock, oil palm, etc.). While sources of income (off-farm
work, remittances from migrants, etc.) while comparison between member and non-
member households should remain scientifically valid, therefore, the presence or absence
of farmer organisations is only one of many factors that determined the standards of living
or income in the study villages. We had no choice but to study such control villages
however, because no baseline study had been done in the area at the beginning of phase I
which could be used to compare progress of member and non-member households to date.
We strongly recommend that an identical methodology be used in 2010 as was used in
2005 to make accurate variable-by-variable, region-by-region and group by group
comparison of impacts. The final sample selection of the 450 (six times 75) households
sampled therefore took the form of Table III.1.
In addition, twelve households in each country were selected for the pilot phase of the
interview, during which the questionnaire was improved and the training of the
enumerators was completed. In each country, six enumerators were selected and trained.
All had either extensive experience in cooperative management and rural development
(Côte d’Ivoire) or in conducting village interviews (Ghana).
Table III.1 : Sampling structure for SCTP – PPP, Phase I Evaluation
Côte d'Ivoire Members Non-members Control Total by region
Abangourou 35 20 21
76
Adzope 36 20 20
76
Tiassale 36 20 21
77
Total Côte d'Ivoire 107 60 62 229
Ghana
Tepah 35 19 20
74
Konongo 35 20 20
75
New Edubiase 35 20 20
75
Total Ghana 105 59 60 224
Total by membership 212 119 122 453
III.2 Techniques of data collection and analysis
Household surveys
To create the data needed for the quantitative analyses of this study, each household was
visited by one of the enumerators. An 8-page questionnaire (Appendix I) was completed in
approximately one hour of time per household. All children present were weighed and
measured to detect possible wasting (abnormally thin), stunting (abnormally short) or
subnormal body mass (abnormally under-weight even for their height) in some regional
areas or membership categories (member, non-member, control).
A total of 622 children in Côte d’Ivoire and 635 children in Ghana were weighed and
measured. Table III.2 shows the breakdown by gender and age of those children by
24 of 88 Calkins and Ngo, Impacts of Cocoa Cooperatives on Well-being
country. Because interviewers were instructed to weigh and measure all children under 15
present in and belonging to the household at the time of the interview, the number of boys
and girls, as well as their breakdown by age, is somewhat uneven. On the basis of
membership status, some 587 member children, 365 non-member children, and 305
control children were included in the sample. The large total size of the sample supplies a
clear basis for comparing the levels of wellness or nutritional deficiency by country and
membership.
Table III.2: Sampling structure for anthropometric measures of
children, break down by country
Côte d'Ivoire (N=229) Ghana (N=225)
Boy Girl
Category
Total
Boy Girl
Category
Total
Grand
total
0 to 5
117 120 237 97 104 201 438
6 to 14
189 196 385 230 204 434 819
Total
306 316 622 327 308 635 1257
Reference tables used by the World Health Organisation (WHO) served to categorise each
child into one of four possible categories of height compared to a common international
standard. If the child is shorter than the mean minus three standard deviations, he or she is
considered to be severely deficient in height. If the child measures between 2 and 3
standard deviations below the mean, he or she is scored moderately deficient. Between 2
and 1 standard deviations below the mean puts the child at mild deficiency. Finally, any
child who is taller than the mean minus 1 standard deviation is considered healthy.
Classifying children this way allows one to sum across age and sex categories for a given
country or membership status.
The same procedure as used for height was then applied to weight and weight-for-height.
For the last, a new standard, the body mass index (BMI), has been developed during the
past decade for international studies of child health status. This index is calculated as the
weight divided by the square of the height. Less than 2 standard deviations below the
mean is considered severe deficiency, less than 1.5: moderate, and less than 1: mild.
All these data were then coded into an SPSS (Statistical Package for the Social Sciences
spreadsheet) in order to calculate ANOVA tests of regional area and membership
status treatment for the entire set of variables in the set, as well as tests for differences
in mean by country, regional area and membership category. As a first step in the
statistical analysis of the quantitative survey results (Appendix table I), complete ANOVA
tables (Appendices III and IV) were first studied to isolate the subset of variables in which
the cooperative, and or the regional area, might lead to significant conclusions. In some
cases, cooperative membership vs. non-membership, while significant, could be
dominated by simple differences in climatic and marketing conditions by region.
Therefore, we compared significant differences by regional area (Appendix III) vs.
membership status (Appendix IV) within the data set. In each row of those appendices, the
Calkins and Ngo, Impacts of Cocoa Cooperatives on Well-being 25 of 88
first column displays, after the variable name, the probability that the variable does not
significantly differ by "treatment" (region in Appendix III; membership in Appendix IV);
in other words, the closer that value is to zero, the more significant the treatment effect.
Any variable with a probability of greater than 0.10 is judged non-significant. Column 2
names the subsample and column 3 the number of households who responded to the
variable in question. Column 4 then reports the "mean value" of such responses; and
column 5 the
absolute
variability in the form of the "standard deviation" around that mean.
Given the wide range of units in which the mean is expressed (persons per household, tons
per hectare), column 6 then divides column 5 by column 4 to yield the "coefficient of
variation", a measure of
relative
variability expressed as a percent. This coefficient reflects
for each variable as a whole and for each subsample, the intensity of household-to-
household fluctuations between the highest and lowest subgroups.
Finally, the last two columns (maximum and the minimum for the whole sample and each
subsample) allowed us to both a) detect/correct errors in the data set associated with
improbable values ("outliers) and b) understand the spread in remaining values for the
variable in question.
Once the ANOVA tables were analysed, a Student t-value was calculated to test for
specific differences between pairs of regions or membership statuses. Throughout the
analyses, a system of a = significant difference in means at the 0.01 level, b = significant
difference at the 0.05 level and c = significance difference at the 0.10 level was used to
detect the presence and level of significance of differences.
Many of the questions contained in the interview form asked the respondent to rank
responses on a five-point scale: Strongly disagree = 1, Disagree = 2, Fairly Agree = 3,
Agree = 4 and Strongly Agree = 5. Such data may be subject to t-test analysis, but the
robustness of the results is improved if five or 10 individual questions are combined into a
composite score, which yields a truly continuous variable. This report will present t-tests
for both individual and composite scales. But it will also use cross-tabulations of the
percentage breakdown of responses by country, regional area of membership category
where appropriate.
A final analytical technique applied to the quantitative data was head- and tail-group
analysis for key dependent variables. This nonparametric approach involves sorting the
households by descending order with respect to, say, yield per hectare or cooperative
satisfaction score, and selecting the top 50 as the “head group” and the bottom 50 as the
“tail group”. All other households are eliminated from the analysis. Differences in mean
are then computed and once again sorted by descending order of importance. The top
twenty positive factors which explain why the head group excels over the tail group are
presented in a first table, and the twenty negative factors which explain why the tail group
lags behind the head group are presented in a separate table. Such tables can be extremely
helpful for strategic planning for the future (section VII of this report).