Report Materials Laboratory 1 Scanning Electron Microscopy.pdf
Bạn đang xem bản rút gọn của tài liệu. Xem và tải ngay bản đầy đủ của tài liệu tại đây (2.75 MB, 12 trang )
<span class="text_page_counter">Trang 1</span><div class="page_container" data-page="1">
<b>HANOI UNIVERSITY OF SCIENCE AND TECHNOLOGYSCHOOL OF MATERIALS SCIENCE AND ENGINEERING</b>
<b>Materials Laboratory 1</b>
<b>SCANNING ELECTRON MICROSCOPY</b>
<b> Student: Hoang Trung Thang </b>
<b>Instructors:<sup>Hoang Van Vuong</sup> Course </b>
<b>MSE3317 - 738468</b>
<i><b>Hanoi, December 2023</b></i>
</div><span class="text_page_counter">Trang 2</span><div class="page_container" data-page="2"><b>I. Introduction</b>
<b>1. A brief description of the principles of image formation in an SEM</b>
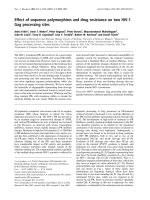
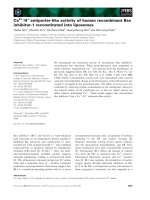
1. Vacuum system. A vacuum isrequired when using an electronbeam because electrons will quicklydisperse or scatter due to collisionswith other molecules.
2. Electron beam generation system.This system is found at the top of themicroscope column (Fig. 1). Thissystem generates the "illuminating"beam of electrons known as theprimary (1o) electron beam.3. Electron beam manipulationsystem. This system consists ofelectromagnetic lenses and coilslocated in the microscope column andcontrol the size, shape, and positionof the electron beam on the specimensurface.
4. Beam specimen interaction system.This system involves the interaction ofthe electron beam with the specimenand the types of signals that can bedetected.
5. Detection system. This system can consist of several different detectors, eachsensitive to different energy / particle emissions that occur on the sample.
6. Signal processing system. This system is an electronic system that processes thesignal generated by the detection system and allows additional electronicmanipulation of the image.
7. Display and recording system. This system allows visualization of an electronicsignal using a cathode ray tube and permits recording of the results usingphotographic or magnetic media.
</div><span class="text_page_counter">Trang 3</span><div class="page_container" data-page="3">- Dip coating is a popular way of creating thin films for research purposes.Uniform films can be applied onto flat or cylindrical substrates. For industrialprocesses, spin coating is used more often.
- The withdrawal speed, the solid content and the viscosity of the liquid definethe thickness of coating.
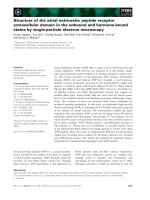
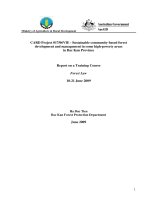
- The dip coating process can be separated into five stages:
<small></small> Immersion: The substrate is immersed in the solution of the coating materialat a constant speed (preferably jitter-free).
<small></small> Start-up: The substrate has remained inside the solution for a while and isstarting to be pulled up.
<small></small> Deposition: The thin layer deposits itself on the substrate while it is pulled up.The withdrawing is carried out at a constant speed to avoid any jitters. The speeddetermines the thickness of the coating (faster withdrawal gives thicker coatingmaterial).
<small></small> Drainage: Excess liquid will drain from the surface.
- Evaporation: The solvent evaporates from the liquid, forming the thin layer.For volatile solvents, such as alcohols, evaporation starts already during thedeposition & drainage steps.
1. Roll of coarse cloth
8. Excess liquid falls back
9. A coating remains on the fabric clot
<b>II.Experimental Produce1. The SEM preparation</b>
- Hydrothermal technology and chemical vapor deposition method (CVD) wereused to prepare TiO2-base films on Ti substrate (10×10 mm ). <small>2</small>
- Sodium hydroxide NaOH was dissolved in water corresponding to a Na<small>+</small>
concentration of about 5M.
</div><span class="text_page_counter">Trang 4</span><div class="page_container" data-page="4">- The prepared Ti substrates were put in the NaOH solution with theconcentration of 5M in the sample container and were then heated up to 250 C in<small>o</small>
- Finally, we will then use the SEM to explore the morphology and microstructureof the samples and record images.
<b>2. Operating parameters of the SEM</b>
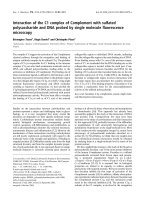
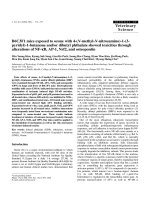
- The SEM is an instrument thatproduces a largely magnified imageby using electrons instead of light toform an image.
- A beam of electrons is produced atthe top of the microscope by anelectron gun. The electron beamfollows a vertical path through themicroscope, which is held within avacuum. The beam travels throughelectromagnetic fields and lenses,which focus the beam down towardthe sample. Once the beam hits thesample, electrons and X-rays areejected from the sample.
- Detectors collect these X-rays,backscattered electrons, andsecondary electrons and convertthem into a signal that is sent to a screen similar to a television screen. Thisproduces the final image.
<b>III - Results and Discussion</b>
</div><span class="text_page_counter">Trang 5</span><div class="page_container" data-page="5"><small></small> Accelerating Voltage: The accelerating voltage determines the energy of theelectron beam. Higher accelerating voltages increase the penetration depth ofthe electrons into the sample, allowing for better imaging of deeper features.However, higher voltages can also cause increased sample damage anddecreased resolution for surface details.
<small></small> Working Distance: The working distance is the distance between the final lensof the SEM and the sample surface. It influences the depth of field and themagnification of the image. A shorter working distance provides highermagnification but reduces the depth of field, limiting the sharpness of theimage.
</div><span class="text_page_counter">Trang 6</span><div class="page_container" data-page="6"><small></small> Beam Current: The beam current refers to the number of electrons in thebeam per unit time. Higher beam currents result in brighter images as moreelectrons interact with the sample surface. However, high beam currents canalso lead to increased charging effects and degradation of the sample.
<small></small> Spot Size: The spot size refers to the size of the electron beam on the samplesurface. Smaller spot sizes provide higher resolution and sharper images.However, smaller spot sizes may require higher beam currents, leading toincreased charging effects and sample damage.
<small></small> Imaging Mode: SEM offers various imaging modes, including secondaryelectron imaging (SEI) and backscattered electron imaging (BEI). SEI providesdetailed surface topography information, while BEI can reveal compositionalcontrast. Selecting the appropriate imaging mode depends on the specificsample and the information desired.
<small></small> Detector Selection: Different detectors can be used to collect various signalsemitted from the sample, such as secondary electrons, backscatteredelectrons, or characteristic X-rays. The choice of detector affects the contrast,resolution, and information obtained in the images.
<small></small> Vacuum Level: SEM operates under high vacuum conditions to minimizeelectron scattering and interactions with air molecules. Maintaining a highvacuum level is essential for image clarity and resolution. If the vacuum levelis insufficient, the electron beam may scatter, resulting in decreased imagequality and reduced signal-to-noise ratio.
<b>3. A discussion of the morphology and microstructure of the samples</b>
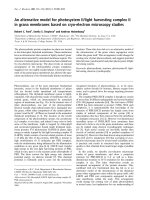
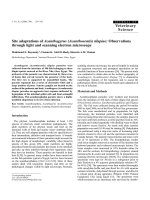
At the room temperature and magnification of 5,000, the size of particle exhibitslarge and short with non-uniformity. Additionally, the particles tend to agglomerateand arrange in random orientations, resulting in cluster forming. These clusters arefound to be randomly ordered. The presence of such irregularities in particle size andarrangement can have implications on the overall quality and performance of thematerial, and affect properties such as strength, conductivity, or reactivity.Furthermore, checking out and optimization may be necessary to achieve a moreuniform and desirable particle morphology.
</div><span class="text_page_counter">Trang 11</span><div class="page_container" data-page="11">- There is a presence of high percentage of crystal, and the crystals sizes aresimilar.
- The elements are distributed different amounts in each area, shown above 4spectrums.
- When we increase the temperature, the sample will change. A more amorphousstate will appear, and the phase of the sample is also changed.
- In spectrum 1, 2, 3 and 4, XRD diagrams show the weight percent that the samplecontains. There are 5 elements, in order of Wt% from high to low: Ti, O, Na, C andCl.Moreover, the table of each diagram illustrates detailed data of each element.
</div><span class="text_page_counter">Trang 12</span><div class="page_container" data-page="12">- In spectrum 1, the Wt% of Ti, O, Na, and C have approximated values with 41.5%,44.1%, 5.36%, and 9.08% respectively. The weight percentage of crystalline phaseof Ti and O are both 0.42.
- In spectrum 2, a similarity in portion of each element is shown. The Wt% of Ti, O,Na, and C have approximated value with 69.68%, 25.66%, 1.15%, and 3.51%respectively. The weight percentage of crystalline phase of Ti and O are 0.33 and0,31 respectively, lower than in spectrum 1.
- In spectrum 3, the Wt% of Ti, O, Na, C and Cl have approximate values with32.28%, 48.63%, 5.74%, 13.17% and 0.17% respectively. The weight percentageof crystalline phase of Ti and O are 0.33 & 0.38 respectively, nearly the same asshown in spectrum 2.
- In spectrum 4, the Wt% of Ti, O, Na, and C have approximated values with41.00%, 45.18%, 5.88%, 7.93% respectively. The weight percentage of crystallinephase of Ti and O are 0.52 & 0.56 respectively, which are the highest valuesamong 4 phases.
</div>