Luận văn thạc sĩ Xây dựng công trình thủy: Modeling storm surge and flood mapping for Kien Thuy and Do Son District, Hai Phong city
Bạn đang xem bản rút gọn của tài liệu. Xem và tải ngay bản đầy đủ của tài liệu tại đây (6.5 MB, 123 trang )
<span class="text_page_counter">Trang 1</span><div class="page_container" data-page="1">
MINISTRY OF EDUCATION MINISTRY OF ARGRICULTUREAND TRAINING AND RURAL DEVELOPMENT
PHAN TUAN ANH
MODELING STORM SURGE AND FLOOD MAPPINGFOR KIEN THUY AND DO SON DISTRICT,
HAI PHONG CITY
THESIS OF MASTER DEGREE
Ha Noi, 2016
</div><span class="text_page_counter">Trang 2</span><div class="page_container" data-page="2">MINISTRY OF EDUCATION MINISTRY OF ARGRICULTUREAND TRAINING AND RURAL DEVELOPMENT
PHAN TUAN ANH
MODELING STORM SURGE AND FLOOD MAPPINGFOR KIEN THUY AND DO SON DISTRICT,
HAI PHONG CITY
Major: Coastal Engineering and ManagementMajors code: 62580203
SUPERVISORS: 1. Assoc.Prof.Dr. Tran Thanh Tung
2. Dr. Le Tuan Hai
</div><span class="text_page_counter">Trang 3</span><div class="page_container" data-page="3">I declare that I have developed and written the enclosed Master Thesis completely bymyself, and have not used sources or means without declaration in the text. Anythoughts from others or literal quotations are clearly marked. The Master Thesis wasnot used in the same or in a similar version to achieve an academic grading or is beingpublished elsewhere.
Ha Noi, Aug 17, 2016Author
Phan Tuan Anh
</div><span class="text_page_counter">Trang 4</span><div class="page_container" data-page="4">I first thank my parents and my brother for their support throughout not only the past
two years, but throughout my entire life. I am truly grateful for all the opportunitiesand support provided by my family at every juncture of my life.
After 20 weeks with my efforts and help of my teachers, colleagues, I have completedmy thesis with the subject “MODELING STORM SURGE AND FLOOD MAPPING
FOR KIEN THUY AND DO SON DISTRICT, HAI PHONG CITY”.
I am thankful for my advisors Assoc. Prof. Dr Tran Thanh Tung and Dr. Le Tuan Hai.This thesis would never have reached completion without their guidance andassistance. Assoc. Prof. Dr Tran Thanh Tung provided insightful edits and innovativeapproaches that helped shaped parts of this thesis. Finally, Dr. Le Tuan Hai providedguidance, especially in Mike model, that ensured the result of calculation wascomprehensive and accurate.
I am forever grateful to the Faculty of Marine and Coastal Engineering and Thuy loiUniversity gave me a meaning course. I had a lot of knowledge and reality experiencesin 02 years study.
I would like to thank Dr. Tang Xuan Tho who helps me collect data and guide me in afield trip to study area.
Last but not least, I am thankful to my friends and colleagues for their support,
encourage and advices.
I hope you will enjoy reading this thesis.
</div><span class="text_page_counter">Trang 5</span><div class="page_container" data-page="5">CHAPTER 1: OVERVIEWS OF STUDY OF STORM SURGE...- --- 5
1.1 Overview of study in the WorÏd...-- eeccccccceseceeneceseeeeseeeeaeessaeeeseeeesneeaes 5
1.2 Overview of study in Viet Nam and Hai Phong ... ..- ----2-<<5<<<<<S2 71.3 Overview of research methodology and fooÌs...---- 5555 +s<s>+<<s+ssxs 10
1.4.1 Geographical location, administrative bowndaries... 12
1.42 Topographic characteristics ...cccccccccesccesceeseeseeeneeeseeseeeseceseeseenseenseensenaes 151.4.3 Geological and soil chardCf€FiSfiCS ...ằSĂcSẰSSSsserreereses 16
1.4.4 Meteorology and climate characteristics ...ccccccccccccccesteseeteeseeeneesseeses 171.4.4.1 Thermal HI©... cv kg ệp 171.4.4.2 Relative Humidity nh. ..e... 17
LAA WIN na ... 18
1.4.4.5 Storm and tropical (Ï@]TY€SSÏOfH... s5 ngu 19
1.4.5 Economical and social chardcf€riSfiCS...--ẶẶS Sex 20
CHAPTER 2: SETUP NUMERICAL MODEL TO SIMULATE STORM
SURGE FOR STUDY 0.9.7.1. ...-... 22
2.1 Data collection and AmallySis...ccccccccccccscccsccesscessecessecessecesesessessseeesees 222.1.1 Topographical data ...ccccccccccccccccccccessscesscsscessseseeesessesseeeeesseseessssessssessaes 22
2.1.3 SfÍorim đAÍf@...Ă. SH HH HH nh rệt 24
VN... .ằn... 31
2.2.2 Theory of Mike 21 Imodl©ÏL... - Ác va 32
2.2.3 Theoretical basis of MIKE 21 Toolbox to calculate fide... 33
</div><span class="text_page_counter">Trang 6</span><div class="page_container" data-page="6">2.2.4 Theoretical basis of MIKE 21 Toolbox to calculate atmospheric field and
WINE fOVCIIG ....ccccccccccccccscccessesecessseeesceseseesaeessaeesseesesseseaecsseecsseesesseesaecesaeceseeseseeeeaeensas 35
2.4.2 Verification of storm surge Model ...cccccccccceseeseessteseeteeeeeeseeesenseenseeaaes 45
CHAPTER 3: SIMULATING STORM SURGE1.00.0. iecccecceeeeeeeeeteeteeeeaes 50
3.5 Result of storm surge simulation ...0.0ccccecccescceseceseceeseeeseeeeeeeeseeeseeenses 56
¬a..IỂẦỶƠỎỐỐốỐẼÉẼ331.. 56
K-... 7. ... 57K `... ...ÔỎ. 61
3.6 Analysis results of simulation modelÌ...- - -- 5 S5 *‡++vxesvsseeeeseeseses 64
CHAPTER 4: FLOODING SIMULATION AND DEVELOP FLOOD MAPPING
DUE TO STORM SURGE OF KIEN THUY AND DO SON DISTRICT ... 654.1 Setup flood model ... ccc 66 ...Ý... 65
4.I.I Domain and Hi€SH... SH ey 65
4.1.3. Input DOUuHd@Fi€S...àĂĂẶSĂ ST Hi 67
4.1.5 Setup parameters of flood rmodl6Ï...-.- SccsSSkesvixeeessereesrs 70
4.3.1 Appying GIS software to build flood mappig...-..-s--<<<<<5 734.3.2 Trott đAÍd...ĂẶĂĂẶS ST SH HH HH tr re 74
4.3.2.2 AAIMINiStVAliVE MAP nnốốe.e... 77
iv
</div><span class="text_page_counter">Trang 7</span><div class="page_container" data-page="7">4.4 Results of flood mapping ...- ---- - c1 2221112111125 218115111111 EEkrrree 78
REEERENCES... HH HH TH Hà Hà HH TH TH Hàn Hành 85
ˆ j0 0009 008.8... ... 89
</div><span class="text_page_counter">Trang 8</span><div class="page_container" data-page="8">LIST OF EIGURES
Fig 1.1 Administrative map of Hai Phong City ...-- 5 <5 5 + * vs *‡seeesereeers 13
Fig 1.3 Do Son beach... -- --- -- s TH H H H T n 21Fig 1.4 Exploiting seafood 200.0... cecccscccssecesecssceceeeceseceseecssceeeseeeenecssaeceaeeeeseeesneseseeees 21
Fig 2.2 Digital elevation model DEM (30x30m) of study area ...-- ---«-<+ 23Fig 2.3 Distribution of storm’s direction landfall in Hai Phong coast... 30Fig 2. 4 Module Mike 21FM of Mike ZZ€TO... -.-- Ác 5 vn ng He 32
Fig 2.6 Domain of small more Ì...- ... - - -- + 31333218391 E%29EE+£EEEEEEEEEsEEeeekreeserreerree 37II-ð2/01/(1i00091-ãi131 20001077 ...c.c... 38Fig 2.8 Mesh of small TmO(€ÌL... ... 5 6 +61 1113111311195 911 1 91 91 1v HH re 39
Fig 2.10 Bathymetry of small TO(€ÌL... 5 <6 5633213318331 E£2EE+EeEEseeereeeereseeeree 40Fig 2.11 Boundary conditions of big model (03 water boundaries, 01 land boundary)40Fig 2.12 Water boundary in North East — Code 2 of big model ... -- --‹---s« 41
Fig 2.17 Comparision of water level in verification of storm surge model... 48Fig 3.1 Track of the typhoon Sarah 1n 1977.0... cee eceecceseeseeseeseeseeeeeeeeeeeseeeseseeaeeaeenee 51Fig 3.2 Setup storm surge model (big model) of scenario Ì...- ---«+ss++c+s 53Fig 3.3. Wind forcing of scenario Ì...- G5331 nh nh 54
Fig 3.7 Water level of tidal mO€ÌL...- - -- -- 5 2< 3218331833188 EEEEEErkerrerere 57
Fig 3.10 Comparision of total water level (storm surge + tide) of scenario 2... 60Fig 3.11 Wind forcing data of storm surge model in scenario 3...- --- «+ 62
Fig 3.13 Comparison of total water level (storm surge + tide) of scenario 3... 63Fig 3.14 Compare highest water level of storm surge model in 03 scenarios ... 64
Fig 4.1 Domain of flood model (small model) ...-- - <5 5 + +s*£++se+sexsseeeses 65
vi
</div><span class="text_page_counter">Trang 9</span><div class="page_container" data-page="9">Fig 4.2 Mesh Generator in Flood model (small model) ...-..-- --- «+ <s«+++s++ss+2 66
Fig 4.4 Tool for extracting results of big model to boundaries of small model... 67
Fig 4.5 Boundaries of flood rmOđ€Ì...-- - - 5 +6 +3 19313 *E 93 E1 1v nrnrưkp 68
Fig 4.7 Import characteristic of infrastructure to flood model ... .-‹---««+<-««+ 69Fig 4.8 After import infrastructures (sea dikel, sea dike 2, express WayS...)... 69
Fig 4.10 Result of flood simulation in SC€TATIO 2 0... eeeeeceeeseeeeeeeeseeeeeeeeeeeeeseeeneeeees 72
Fig 4.14 After eliminate unsubmerged area of study area...---- 55s <<ss++ssx+ss2 75
Fig 4.19 Flood mapping of study area 1n SCeMATIO 3 ...-- 5 cv seeekeerke 80
vii
</div><span class="text_page_counter">Trang 10</span><div class="page_container" data-page="10">LIST OF TABLES.
Table 1.1 Typical monthly and annual average temperature (unit ”C)... --- 17
Table 1.2 Typical monthly and annual average relative humidity (Unit: %) ... 17Table 1. 3 Typical monthly and annual average evaporation (Unit: %)... 18
Table 2.1 List of typhoons affected to Hai Phong coast from 1952 to 2015... 24
Table 2. 2 Details of some strong typhoon landfall on Hai Phong coast... 26
Table 2.3 Tidal Component 718... ... 33
Table 3.1 Classification of flooding zone of Ministry of Natural Resources &
EMVIrONMEeNt 808000080088... ... 50
Table 3.4 Parameters of the typhoon Saraln...cceceescessceescceeneeeseeesseeeeseeeeaeeeseeeeseeees 52
Table 3.6 Highest water level of 06 stations in scenario Í... ..---««+-«+<<<++ece+ 57Table 3.7 si 14:81:02 5Ä0 ii... ... 58
Table 3.10 Parameters of the supposal typhoon in scenar1O 3 ...- ---«+<«<++ 61Table 3.11 Result of storm surge model of scenario 3.00... eee ee eeeseeeeeeeeeeeeeeeseeseeeees 64Table 4.1 Parameters Of f100d ...- -.- 5 + 3199319019 9 ng ng nh ng ngự 70
Table 4.4 Statistics of flooded area 1n SC€TATIO 2.0.0... eee eeceesceeetsceeteeeaeeeeeteceeeeeneeeees 81Table 4.5 Statistics of flooded area in sC€TATIO 3.0.0... eeeeceescceseeeeeeteeesecececseeeneeeaeeeees 81
viii
</div><span class="text_page_counter">Trang 11</span><div class="page_container" data-page="11">INTRODUCTION1. Necessity of research
‘Along with increase of greenhouse effect, pollution due to climate change cause ofglobal warming, melting ice and rising sea levels are increasingly more and morecomplex developments in the world, According to the fifth Assessment Report of theIPCC on the status of current climate change, sea level rise will not be uniform acrossregions. By the end of 21st century, it is very likely that sea level will rise more
el se dey
approximately 95% of the ocean, Sea le ends on quantity of CO; not onlytotal cumulative; emissions total accumulated together and sooner rather than later duetoa larger mitigation of sea level rise, About 70% of worldwide coast are projected toexperience sea level change within + 20% the global average [1]
‘Scientific studies show that increased storms due to climate change include two keyclements. The first one is the sea surges due to thermal expansion and ice meltingtantly. A recent study showed that sea level rise could reach 1 meter or more inthis century. The second, a warmer ocean increases the likelihood of a tornado caused‘of increasing high storm surge. Because of climate change rise, storm surge floodingII facilitate more damage in adjacent coastal areas and low-lying areas, Large stormsurges greater threat of destruction in the future because they will move inland, thethreat level larger area than before. In addition, major storms can cause burst dikes,severely affecting coastal works, with coastal cities increased, people's lives will beaffected more, World history has witnessed the typhoon Side which attacksBangladesh coast in November 2007, killed more than 3.000 people, injured more than50,000 people, damaged or destroyed more than 1.5 million households, and affectedto life of more than 7 million people [2].
Vietnam is a country located on the west coast seaside of the East China Sea, with
geopolitical and geoeconomic very important not only to Viet Nam but also other
countries. There are over 3,260 km coastline stretching from North to South in VietNam, so Viet Nam have ranks 27th among 157 coastal countries, island nations andterritories of the world, Coastal line of Viet Nam have about 3,000 islands and two
</div><span class="text_page_counter">Trang 12</span><div class="page_container" data-page="12">offshore Hoang Sa and Truong Sa islands equally distibuted along the country’s coast,some special positions are simile to important line for defending outpost on the westof the country: Some coastal islands also have an important position (0 be used asnational landmarks in the sea to establish baselines for the coastal Vietnam, Three-quarters of Viet Nam is mountainous with elevations ranging from 100 m to 3400 m,while delta area includes two large river deltas; the Red River Delta in the north andthe Mekong Delta in the south. Lowlands in Viet Nam are extremely fertile and
populous and most of the agricultural sector and industry of Vietnam are concentrated
there. In 63 provinces and cities of the country, 28 provinces and cities have coastalline and nearly half of population is living in the coastal province and coastal cities,
Storm surge is rise of the water level with short dephan pressure and stress field stormon the sea [3]. Storm surge occurs with high tide is the cause of the loss of human lifeand property in hurricane region and surrounding areas. During the setdown, the highcross-shore velocity may give rise of shore erosion. Storm surge/setdown is verydangerot
affects on the hydrostructures [4]. According to the report of UNDP (2008) whichín natural hazards, but one pays much attention to the surge because it
predict
Viet Nam to be one of the most disaster-prone country special in the climate
change status [5]. The report of Vietnam Central Committee for Flood and StormControl (CCESC, 2005) showed that in the period of 1990-2010, Viet Namexperienced 74 floods [6]. Typhoons and floods always cause serious consequerFor example, the typhoon Damrey had landfall in Viet Nam include Hai Phong city on27 September 2015, itis considered the most severe storm to hit Viet Nam in the last50 years. Damrey affected all coastal provin es of the Red River delta region withlevel 14 of wind forces in the eye of the storm. High storm surges coincident with hightides led to extensive overtopping ofsea dikes in the area. Storm surges from Damreyreached a height of three to four metersand the seawater penetrated inland three to fourkilometers. The typhoon Damrey destroyed at least 1194 houses and damaged another11.576. More than 130,000 hectares of rice fields were submerged and damaged, mostof which had not been harvested prior to the typhoon Damrey [7]. Although it isdifficult to associate singular events like the damaging typhoons of 2005 with climate
</div><span class="text_page_counter">Trang 13</span><div class="page_container" data-page="13">change, event like these clearly demonstrate the extreme vulnerability ofthe region toexaggerated climate variability
Climate change and storm surge are changing complex and their consequences causedincreasingly unpredictable results, Researching and forecasting storm surge as well asflooding scenarios in the future to get suitable migration plans which should reducelosses caused by natural disasters and make adaptation with climate change
2. Research objects and Scope
Subjects research: Simula wed storm surge and develop inundated map in differentscenarios for Ki n Thuy and Do Son District, Hai Phong city.
‘Scope of the study: This study only determined total water level and storm surgeide but not water level rise in the rivers and
caused by wind field, atmospheric field,
effect of wave,
3. Research content
With the climate change and sea level rise, all hydro-meteorological parameters aredramatically changed, specially for typhoons. As the results announced by Ministry ofNatural and Environment (MoNRE), typhoon’s intensity can be risen up to 16 order(Beaufort scale) with wind velocity reaches 180-200 km/hr. Also from announcement‘of MoNRE, the storm surge in super typhoons at the coast are up to 5 to 6m abovemean sea level. With very high storm surges in super typhoons, sea dikes may bebroken and hinter land will be inundated. The simulation can assess the inundatedlevel and propo: the Solutions to mitigate damages caused by thị phenomena
With above reasons, the study is very important and really having scientific and
practical significances. Its also the requirement of Viet Nam Government.
4. Approach and methodology
~ Research scientific literatures in the world and Viet Nam about storm surge andrelated literatures;
~ Data collection: all required data such as topography, mangrove foreswaves and collected and extra investigation for the study;
~ The MIKE2IFM is applied to simulate totally water level and storm surges issubtracted for the south central coasts of Viet Nam with different scenarios, Resultswater level,
</div><span class="text_page_counter">Trang 14</span><div class="page_container" data-page="14">will be a basis for making strategy to mitigate effect of storm surge for coastal areas inViet Nam. Itis absolutely good and modernized tools for the study.
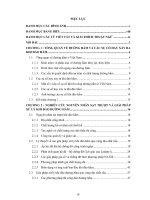
- GIS is coupled with simulated results to make inundated maps for different scenarios.METHODOLOGY
(Winds, waves, tide, water depth, storm...)
<small>SCENARIO 1</small>
SCENARIO 2= SCENARIO 3
—————— INFRASTRUCTURE DATA
SETUP FLOOD MODEL ~Dikes
{SMALL MODEL) -Road
~Comtuconson tes
suuươme }
DEVELOP FLOOD MAPPING
‘CONLUSIONS AND RECOMMENDATIONS
DEM MODEL.
is MODEL.
</div><span class="text_page_counter">Trang 15</span><div class="page_container" data-page="15">CHAPTER 1: OVERVIEWS OF STUDY OF STORM SURGE
1.1 Overview of study in the world
‘A researcher once said "model the phenomenon of water surges is an art” [8]. Stormsurge modeling is still being improved in the 2lst century and worldwide. The stormcaused water surges were sludied in these regions of the world with different namessuch as: in North America, storms appear in the Mexican Gulf and East Coast are
called Hurricanes; in Europe, storm named Tropical Storms; in Asia and Oceania
storms called Typhoons. In the first half of the 20th century, scientists have studiedstorm surge by existed over time tools: from the simple experiment method based on
analysis for the Sea-basin and storm with simple but limited practical value as thes has directed thestudy of the Proudman [II], Doodson [12]. In the US, Congres
research agency of army and Weather Bureau to conduct intensive research on stormand storm forecasting methods after tremendous damage of the eastemn coastal regionin 1954. This is considered as the beginning of a systematic study of storm surges inNorth America [13]. Before digital model is developed, storm map has been designedto forecast water levels rose whenever a typhoon landing on a shore, Author Connerand others have built a simple experience models to calculate approximately crest ofwater level rise then draw up the largest monitoring water levels based on pressure‘monitoring data are at the center ofthe storm to determine how cover of water level [9]
In the world there are many studies using numerical models to simulate storm surgethrough that reviews potentially flooding due to water level rise by storms on coastal‘area, Many storm surge models were used to simulate storm surge and provided highaccuracy, Research of group R Christina used ADCIRC model to calculate the exest of‘wave in storm surges and ability of coastal flooding in West Bengal and Bangladesh
caused by ultra strong tropical storm Alia landed near the Sagar Islands in West
Bengal border and Bangladesh coast on 25/5/2009. This is the storm has caused hugelesh.‘damage to persons and property along the coastal belt of West Bengal and Ban
Results calculated by ADCIRC model showed the highest wave in the storm is up to 4
</div><span class="text_page_counter">Trang 16</span><div class="page_container" data-page="16">submerge all the rivers as Well as the inland are in water. The extent of flooding arecalculated via simulation models showed the storm caused flooding level inside area1s 350m average and up to a maximum 600m in different areas in the coastal region ofWest Bengal and Bangladesh city [14]
Using numerical models to simulate the water surges in storms and floodingsimulations by coastal storms are increasingly applied in recent global studies ofsimulation capabilities and highly accurate forecasts. In a study entitled "NumericalModel of Storm Surge and Inundation in Bohai Bay" by the author Daming and otherco-authors refers to the application of models to simulate storm surge and flooding due
to the super storm caused in the Gulf of Bohai. The authors used the ADI method to
support 2D image simulation of storm surge in the FVM methods and models tosupport the level of flooding simulations in 2 eases: casel with jetties high 2m andcease 2 wihout jet “The results have identified flood map of region with two casesinclude jetty and no jetty. Simulation results by model is verified accurate offerscomparison with observed data in history and they were consistent with observed data
“The area North-East of the Arabian Sea include Gujarat coast of India and the western
coast of Pakistan also is the area prone to the effects of the storm and suffered damageoflife and property by storm surges. To simulate sea level and storm surge wamin
contributed to the ris of flooding can occur, Indu Jain and other authors used theexperimental model to calculate the water level in the big storm struck the coastPakistan in 1999 and 2001. According to the sults calculated by the model, sea-levelrise during a storm in 1999 was greater than 3.8 m compared with the observed resultsof the organization Unisys Weather, it was similar to hurricanes in 2001 and higherthan 1,0m, However, the results of study not mentioned dimensional mode ciallythe case storm tide coincides with the highest but predicting hurricane surge couldcompletely done by the model based on real time [16]
Along with the development of computer and information technology at present,
research using models to forecast the impacts of sea level rise due to storm surge more
popular than empirical statistical methods. The authors LIU Juan, JIANG Wensheng
6
</div><span class="text_page_counter">Trang 17</span><div class="page_container" data-page="17">and other authors use Matlab model to simulate storm surge and ArcGIS model todetermine the extent of flooding in the reseach name "A high resolution forecast modelof storm surge inundation”. The storm was chosen to simulate including 02 typhoonsare 6903 (Viola) and 0104 (Utor) that has caused huge damage to Shantou coast.Comparing the simulation results with observed data of 2 typhoons on the abilityshowed high accuracy between the model and reality so that we can use the model topredict risk of flooding caused by storm surge [17]
‘The authors Jun Wang, Xu Shiyuan, Mingwu Ye, Jing Huang and ete used Mike 21model to assess the risk of spills from the sea dyke sea dike and the effects of sea levelrise, storm tide combined land subsidence in a study entitled “The MIKE OvertoppingTheApplication to Risk Assessment Model of Seawalls and Levees in Shanghai
study sults showed that the risk of overflowing the sea dike and sea dykes fromdisasters combined effects of three natural hazards which are highly anticipatedcapability and comprehensive assessment of risks in the future to build preventable
plans [I8]
1.2 Overview of study in Viet Nam and Hai Phong
In Viet Nam, the research on sea mostly focused on the tide change and storm surgephenomenon. Particularly storm surge phenomenon has been studied since the 1970sof the last century, including a number of authors and their featured works such as;Programs and Tran Le Phuoc States (1969 - 1970), Nguyen Van Cu (1979), Pham VanNinh (1982), Do Ngoc Quynh (1982), Vu Nhu Hoan (1988), Nguyen Ngoc Thuy
(1989), Ta Dang Minh (1989), Le Trong Dao ( 1989), Bui Xuan Thong (1995),
Nguyen Thi Vietnam Union (1996), Nguyen Vu Thang (1999), Bui Hong Long(2005), Nguyen Ky Phung (2006)... ete
The first study of storm surges using statistical methods to calculate and chart surgesin the position to be calculated, Recently, the research approach surges value methodto simulate and calculate storm surges more widely used. It can be said, the review
study of storm surges in Vietnam is showed most clearly from 1984 to the present,
within the framework of the state -vel 3 topics. Research of author Pham Van Ninh.
</div><span class="text_page_counter">Trang 18</span><div class="page_container" data-page="18">The project 48.06.15 of the author Pham Van Ninh has developed a standard method‘optimal standard use "Tidal table" with high precision in order to clearly identify the‘movements and distribution time spatial phenomena of the storm surge. This study hasconfirmed the phenomenon caused storm surges in Vietnam can be studied to givebetter results into practical applications [19]. The project 48B.02.02 (1986-1990)studied the distribution characteristics of the phenomenon of rising water in time andspace, location and time of the maximum current and surges the relationship betweenthe time of the tidal surges to the challenge. Practical significance of the research topicto determine the elevation of the marine construction to serve the planning for socio-economic areas of coastal [20]. Research forecasts storm surges for specific (1991-1995, subject KT.03.06, chaired by Do Ngoc Quynh). In addition, from the year 1996-2000 state level project "Scientific basis and technical characteristics of coastal..." byPham Van Ninh and Do Ngoc Quynh have reviewed calculation of characterized insouthern storm mode by additional data [21]. In addition to state projects, there are‘many other research topics such as the research of author Le Trong Dao presented ideain research storm surges by finite sment method to calculate tides and storm surges
for the south china sea [22]. Scientific research projects of Nguyen Vu Thang using
computational models of coastal storm surges in Hai Phong which gave storm surgechart in forecast for the region [23]. Overall studies of storm surge in the beginnihave achieved certain accuracy, however because limitations of actual data abouttopography, tides and storms, especial limitations of speed of computer so mesh detail
level and expansion of
calculated boundaries during encounter many restrictions. Toovercome limitations of computer speed in simulating and calculating storm surge forsmall area, author Bui Xuan Thong used nested grid method in value modelapplication to simulate storm Vietnam coastal waters has brought results quite detailedand accurate, Along with studies of storm surge by numerical models, recent studiestend to use the commercial model and open source model has already been builtincountries to apply the calculated storm surge of Viet Nam coast and provide highaccuracy of results [24]
At present, the popular commercial model in the world include: MIKE model of theDanish hydraulic Institute (DH), SMS model of the U.S. Navy, the Delft 3D model of
8
</div><span class="text_page_counter">Trang 19</span><div class="page_container" data-page="19">Delft, ctherlands, .. and a group of open source models including the POM model ofPrinceton University, ROMS model of Rutgers University and University ofCalifornia, USA, model GHER of the University of Liege, Belgium, In thisdirection, a number of typical projects as research of Le Trong Dao using Delft3Dmodels of Dutch to set up and simulation, forecasting storm surges to coastal areas ofVi Nam. The research of Nguyen The Twong, Tran Hong Lam and others incoordination between Vietnam - China on research forecasting ocean waves, stormsurge by using different models such as Delft 3D Netherlands, JMA (Japan‘Meteorological Agency storm surge model) of Japan and CTS (China typhoon Surge)of China to calculate and provide forceasting processes of form surge [25]. In anotherresearch used the open source model such as Vu Thanh Ca and et al who applied anddeveloped using POM model of the United States to apply storm surge calculationstaking into account the influence of tide [26]. From results of Vietnam Nationalproject KC.09.04/01-05 (2001-2005) “Short time prediction of hydrodynamic
processes in EVS” then meteorological fields forecast models in 72h, in which, storm
surge forecasts for entire coast of Viet Nam continue to be developed by Professor Dr
“Tran Tan Ti
n project KCO8-05 [27]. Also may include study of Nguyen Tho Sao in
the study “Storm surge predictions for Vietnam coast by Delft3D model using
from RAMS model” who used RAMS model to build an associated procedure forsults
prediction of storm surges using Delft3D-FLOW model [28]. The study of Bui Xuan
‘Thong used a method for determining possible maximum storm surge at a sea dike [29].
Studies of storm surge in Hai Phong city currently attracting interest of many expertsexpressed through many researchs of expects include: Nguyen Xuan Hien and et alhave used the ADCIRC model to calculate storm sur ‘due to the typhoon Damrey oncoastal estuary area of Hai Phong city in 2005. Simulation results using ADCIRCmodel were compared with measured data and produce results quite similar. Base onresults of these study that showed phenomenon of storm surges not only effect to seadike, but also directly damage the estuary dikes, river dikes [30]. Continue towardsstorm surge research by using models and empirical formula in coastal areas of HaiPhong city inleuding research of the authors Nguyen Xuan Hien and et al (2012). In
</div><span class="text_page_counter">Trang 20</span><div class="page_container" data-page="20">storm and tide plus sea level rise by wave surges. The results showed that the‘magnitude of storm surge in the storm happened constituted about 16% to 18% of the‘mean wave height offshore and contribute significantly to total sea level rise in storm,Storm surges in the largest total time period of 1000 years can be approximately500em and potentially flooded area after dikes [31]. In framework of the project"Ass -ssment fluctuations extreme sea levels due to climate change serves marineeconomic strategy" belong to the program KC0923/06-10 "Marine science andtechnology serve sustainable development of social economy” was developed by ProfDinh Van Uu, software ADCIRC of SMS suite (using triangular mesh) was applied tocalculate storm surge for North Bay area and details for Hai Phong coast 32]
1.3 Overview of research methodology and tools
In general, the research methods of storm surge at the moment includes followingmethods:
Statistical measurement methods: This method is based on the statistical data to‘measure the sea level in the study area and data of the storm affect at the <small>came time.</small>
From the st
atistics that found the rules or build relationships correlation between data
and storm surge in the study area. Survey data in the field is essential which is used tocalibrate and test the accuracy of the method. However, this method can only beapplied to each area of research, because every region has different natural conditionsThis isthe traditional method for relatively positive results. The result ofthis approachis very important, it built up a database of catering for the integrated assessment of‘water level in the sea areas of research and service to other methods
Experimental Methods: To determine the height of storm surges, often use theempirical formula is summarized from the data measured for each area. In our country.on the bs of the survey the relationship between <small>speed storm surge from 1959.</small>
0 1970 in coastal area gave formula as follow:
Ah
0.175W/Ả, ay
Inwhich Wyay ~ Average of wind speed (m/s); Ah- Sea level rise (m)
- Formula of Karausev A.V., Labzovski N.A in standard 06.04.82 of Russia:
ah = kw (2) suy d2
10
</div><span class="text_page_counter">Trang 21</span><div class="page_container" data-page="21">+ Standard 22TCN222-95 of Ministry of Transport:
‘The dynamic processes cased storm surge mentioned above are describe in theshallow water equations by two-dimensional numerical models:
ou, aus ou Em.
TẢ, tỷ : wind stress on surface route axis x, ýtỷ = AM, WE + WP as)
tỷ = AW, WEP (1.10)
4: bottom friction coefficient
</div><span class="text_page_counter">Trang 22</span><div class="page_container" data-page="22">@ : geographical latitudecasing ~ Coriolis ratio
@:0.729.10* s" : earth rotation angular velocity.
Currently in the world there are many application models us ng this method forcalculating have results effectively due to the speed of the computer include: modelMIKE, Delft 3D, POM, ROMS
Each calculation methods mentioned above have their advantages and disadvantages,method uses empirical formula and selling experience has advantage is easy to applyand fast ealeulation, however ealeulation results are too large and maybe differences
computational model can calculate and foreca storm surge on a large scale (85,000
points can be calculated), but fixing ofthe input parameters such as angle ereated by
perpendicular axis and wind direction a, coefficient Ky, wind momentum W,
coefficient surface friction 2, water depth of area... that make difference between the
calculated results and actual measurement14 Overview of study area
1.4.1 Geographical location, administrative boundaries
Hai Phong is a coastal city, located on the east of the Northern coastal area, 102 km farfrom Ha Noi capital, with Quang Ninh provin e on the North, Hai Duong province onthe West, Thai Binh province on the South and East Sea on the East. The total natural
area of 152,318.89 hectares (2001 statisti
9 accountfor 0.45% of the natural area of
the country. With Bach Long Vi island district in Tonkin Gulf, with coordinates of20107135" - 20° 08'36" North latitude and 107°42'20" - 107%44’15" East longitude, HaiPhong has advantages of sea, rail, road and air, resulting in favorable exchangeconditions with other provinces in the country and the nations of the world. Due to the
port, Hai Phong city plays tremendous role in import and export of North Vietnam,
having quick access to scientific and technology achievements from abroad thenspreading them all over the country. Hai Phong seaport along with Cai Lan port(Quang Ninh city) with a capacity of several millions of tons create inereasingly-large-seale port clusters, contributing to the transportation of Northem goods to otherregions of the country, as well as participating in transportation of transiting goods for
2
</div><span class="text_page_counter">Trang 23</span><div class="page_container" data-page="23">Southwest China region. Along with the economical and commercial developmentsocial and cultural development of the region is oriented to development of Hai Phong
City in 2025, Currently the region isa bridge between the other economic centers and
Do Son tourist center. In the future, there will be more strategic projects for the
economical and political development of the region. Land area is divided by the rivers
into five separate irrigation systems: Vinh Bao; Tien Lang; Red stones; An Duong and
‘Thuy Nguyen. The whole area is located in the downstream of Thai Binh river, animportant part of North Delta and is one of the main drainage direction of Red River
and Thai Binh river. Upstream flooding, heavy rain in the midlands and plain; tides,
‘waves and storm surges from the sea passing through the estuary are the factors
causing flooding in areas, severely affected agricultural production and people's life. In
recent years, together with the strong development of people's livelihood,
infrastructure, economy, shoreline areas were leveled out to pave for the developmentof infrastructure, tourism, aquaculture... resulting in increasing threat of natural
disasters to people's safety in coastal areas.
</div><span class="text_page_counter">Trang 24</span><div class="page_container" data-page="24">To deal with storms and prevent flood, Hai Phong has built dyke system consists of 24dikes with a total length of 420.824km. In which there are 18 river dikes with314.789km long and 6 sea dykes with 106,035km, There are also 387 culverts undersea dike and 52 dams to ensure drainage and sea dike protection.
‘The subregion including Kien Thuy District, Duong Kinh and Do Son District isprotected by sea dikes I and Il, being concentrated residential and economic-developedareas of Hai Phong City. In whic, Do Son is a district of Hai Phong city, about 20kilometers far from the city center to the southeast, being a small peninsula ereated byRong Mountains spreading to the sea to 5 km, with dozens of hills from 25m to 130mhigh. Do Son district was established on September 12, 2007 on the basis of the entirearea of the former Do Son town under Decree 145/2007/ND-CP of the SocialistRepublic of Vietnam Government. To the west and northwest, Do Son District is nextto Kien Thuy district, the remaining direction adjacent to the Bast sea, Thanks to (woestuaries Lach Tray and Van Ue of Thai Bink river system in the north and south ofthe district flowing into the sea bringing a lot of sil, together with Iuxury resort on thesea dykes Hon Dau Island, the area is very attractive to the tourists. Kien Thuy is a
suburban district located on the southeast of the city, having a natural area of 102.56
km, with a population of over 125 thousand people. Norther and eastern borders areDo Son and Duong Kinh district, the southern is Tien Lang district and the western areKien An and An Lao district. Besides the advantage tourism with Do Son beach, thesubregion including three districts also has important role in economical development,fis
ing and aquaculture seafood, domestic and international trade. Therefore, the role
of sea dikes | and 2 to protect this sub-region are identified by Hai Phong City
People’s Committee as extremely important for people's lives and social economy of
the city
1
</div><span class="text_page_counter">Trang 25</span><div class="page_container" data-page="25">Fig 1.2 Sea dikes 2 is protecting populated areas,1.4.2 Topographic characteristies
‘The topography of Hai Phong city is quite diverse, the northern part is similar to amidland with plains interspersed with mountains while in the southern part ofthe cityis relatively flat and low. Hills and mountains account for 15% of the city area, morethan half concentrating in the northern part of the city with northwest ~ southeastdirection. Hai Phong land area is divided into 5 major rivers irrigation systemseparately: Thuy Nguyen, Hai An, Da, Tien Lang and Vinh Bao. In which, ThuyNguyen, Hai An, Da Do have alternating hills and the plains. The main slope of theterrain is from northwest to southeast. Altitude is classified into the following
</div><span class="text_page_counter">Trang 26</span><div class="page_container" data-page="26">(Tien Lang district) and Trung Lap (Vinh Bao district). The low-lying areas often havedifficulty in drainage.
Hai Phong has a coastline of over 125km including coastlines around the islands, Thecoast is a curve concave towards the Gulf of Tonkin, low and relatively flat, composed‘mainly of sand, silt from five river mouths. Hai Phong sea is a part of the northwesternGulf of Tonkin, The structural and topographic features of the seabed and‘oceanographic characteristic s of Hai Phong sea attach to the general characteristics ofthe Gulf of Tonkin and the South China Sea, Hai Phong sea is not very deep. Bottom‘water level is at 2m around Do Son coast, going down to Sm from offshore. On the sea
floor where the shed estuaries, the erosion of the flow causes a greater depth, The
offshore area has many islands scattered across the sea, the largest island is Cat Ba,‘most far one is Bach Long Vi Island,
143 Geological and soil characteristies
Large parts of the inner city and suburban city of Hai Phong have fourth sediment withthickness ranging from 40-60. Stratigraphic column shows that alluvial sedimentsarrange from top to bottom as follows: on the surface clay layer has thicknessaveraging 0,4-2,0m, the next layer consists of layers of mud, mud sand interspersedirregularly, from 5-20m thick, muddy floor is the next floor, from 3-22m in thickneclay layer with a thickness of 2-26m and finally the small sand floor gradually shiftinto large one with thickness of 9-30m,
Hai Phong has two aquifer floors in the fourth sediments. The first floor is located inthe clay layer of sediment, sand lens in the clay layer has thi s of 18m onaverage, The first floor only affect enginee: ing geology. The second floor is locatedbetween the clay layers and bedrock. This floor is salinity and has deepness of 20-40m. Underground water is 0.5 - 2.0m deep. This water levels lower during the dryseason (from November to April) and are added in the rainy season (from May toOctober). Additional undereroui water resource is from agricultural irrigationsystems. Tide can affect water levels and groundwater quality of the coastal zone.
16
</div><span class="text_page_counter">Trang 27</span><div class="page_container" data-page="27">144 Meteorology and climate characteridies
Hai Phong is influenced by the coastal climate, Annual climate is divided into tao,seasons: the rainy season from May to October, the weather is hot, humid and rainy.
‘The dry season from November to April, cold and litte rain
1.44.1 Thermal mode
‘The average annual temperature in Hai Phong is 23,1°C, classified into two quite
dlistinet seasons: hot summer, the average temperature is above 25°C and cold winter,average temperatures is below 20°C, The highest average temperatures is in July,
reaching 28,40°C in Phu Lien, 29°C in Hon Dau and 28,7°C in Bach Long Vi. The
average monthly temperature in January reaches the lowest of 16,30C in Phu Lien,
168°C in Hon Dau and Bach Long Vi.
‘Table 1.1 Typical monthly and annual average temperature (unit <sub>=)</sub>
‘Station | 1] 1) Wm) IV VE) Vit] Vi] IX | X | XI [XH [Yer
Table 1.2 Typical monthly and annual average relative humidity (Unit: %)
‘Station | TỊNH WM) IV] V | Vi] Vi] Vil] IX] X | XT) XM] Year
</div><span class="text_page_counter">Trang 28</span><div class="page_container" data-page="28">1.44.3 Piche Evaporation
Evaporation in mainland is quite small compared to the amount of evaporation in theisland due to high wind speeds. During the year the average monthly evaporation
peaks in July when the air temperature is high due to the hot dry wind and also high in
November and December when the northeast monsoon overflow dry and stinginginstallments. Minimal evaporation occurs in March with damp drizzle.
‘Table 1. 3 Typical monthly and annual average evaporation (Unit: %)
Staion | 1 TH TTHTTIVTV | WY] WM VIM) IX] X | XI] NI] Year
In Summer (May to September), Hai Phong is influenced by the flow of hot air andmoisture from the west and south, Prevailing wind direction is mainly ast, Southeastand South. The average wind speed reaches 3.5 to 4.0 m/s with a maximum of 20-25ns. In the summer sometimes appear southwest winds, with small speed but bringinghot dry weather (Table 2.6). During the transition period (April and October), thereducing impact of monsoon, the sea wind and breeze wind usually appear with avelocity of about Level 3 - Level 4, the wind blows from the sea to land during the dayand blew back from the land to the sea during the night. According to space, with
18
</div><span class="text_page_counter">Trang 29</span><div class="page_container" data-page="29">cffect of natural conditions, wind speed decreases from offshore to shore. The average‘wind speed in islands is usually 1-4m/s larger than coastal mainland area.
Table 1. 4 Average monthly and annual wind speed
Station TM THHTIW] V | WE] vin] vin] aX | X [XI[XH[Year
PhuLiu |34|2727/31|33|31|32| 27 [28 [30/30/28] 30
HồnDấu [4846 44 47|56|57|60| 47 [46 |S0|50|47| 50Bạch Long
Vi 80/77 65 /59]65|68|7.7| 59 | 66) 7.7/7.7) 78) T4Source: Hydrology Report [34]144.5 Storm and tropical depression
‘Annually, Hai Phong city is affected by 3-5 hurricanes or tropical depressions, inWhich 1-2 storm or tropical depression landing directly cause damage to buildings,dikes, person and property of the people in the region. This mainly occurs in 3 monthsJuly, August and September. Hurricane and tropical depressions often landed withheavy rain and rising water causing flooded coastal estuaries.
‘Typically, the typhoon Kate (1955) caused to 158 broken dykes, 669 died people,1,200 injured people and 13,000 ha of submerged fields; the typhoon Wendy (1968)
destroyed 87.000 m° dikes, 155 died people, 400 injured people, 18.000 ha flooded
fields; the typhoon Sarah (1977) caused to 48 people died, 228 injured people, 160.000
m’ eroded dikes, 48.000ha flooded fields. Especially in 2005, Hai Phong is influenceddirectly by three powerful storms, causing severe damage to economic livelihoods aswell as the system of irrigation works such as dykes. Typhoon No, 02 (Washi) hit HaiPhong coinciding with high tide period at 11 o'clock cause huge surges in coastal areass 3,60m. Typhoon No. 6(Vicente) landed in Hai Phong together with large waves, tides and storm surges wereand estuaries, the largest wave heights measured at 13h.
maintained for long periods of time from 10h to 22h corresponding to the tide level atHon Dau from 2.2 to 3.0m. Typhoon No. 7 (Damrey) cause strong winds of level 9,10, shock on level 10, combined with high tides (at Hon Dau is 3.2m) cause seriouslylarge surges in estuaries, threatening levee systemand estuary dykes,
</div><span class="text_page_counter">Trang 30</span><div class="page_container" data-page="30">145. Economical and social characteristies
Do Son district has 4237.29 hectares of natural area and a population of 51417 people.“The district has even ward: Bang La, Hop Duc, Minh Duc, Ngoc Hai, Ngoc Xuyen,
‘Van Huong, Van Son. Do Son distriet has favourable conditions to develop tourism,
restaurants, hotels. In some other areas people mainly earn their living by fishing,sailing, marine aquaculture, Tourism service plays important role, accounting fornearly 70% of the economic structure of the area. This arca has the potential todevelop and expand the tourism industry, attracting both domestic and internationalvisitors. Do Son beach is divided into three main zones: Zone 1 is located in thebeginning of Do Son Town, Zone 2 has many modern hotels, Zone 3 is quiet anddiscreet
Fishing industry and agriculture account for 23% of the area's economic structure.However, the fishing and marine aquaculture must be linked together withenvironmental protection, as well as avoiding pollution and water salinization. Inrecent years, the agricultural economy shifted towards industrialization and‘modernization and ensure food security. There are also gradually changing pattern ofagricultural production towards agriculture serving urban (with fresh vegetables,flowers, plants, fruits, ..), the introduction of high technology, advanced techniques inproduction and important achievement. Hai Phong has built the frst and most modernhigh-technology agricultural zone in the North. The model of biotechnologyapplications are replicated. Until now, the city has about 2,000 hectares of arable landcultivation technology applied with a canopy. agricultural mulch, 10,000 hectares ofarable land can produce 3-4 cropvyear, with revenue of more than 50 millionVND/halyear.
Along with the development of agricultural production, the city has focused oninfrastructure investment and technical service of aquaculture in all three areas:intensive farming, semi-intensive farming in marine and freshwater; improve the fleetwith high technology and new equipment
20
</div><span class="text_page_counter">Trang 31</span><div class="page_container" data-page="31">Source: http:/vnexpress.net/
Fig 1.3 Do Son beach
Source: hitp:/hnexpress.net/
Fig 1.4 Exploiting seafood
‘Well organized logistics system serves effectively for seafood farming and mining.Industry and construction is quite modest, accounting for about 1% of the totalstructure. In addition to strong tourism development, Do Son need to invest ininfrastructure such as electricity, roads, schools, medical works, in the mean time,
upgrading canals and dikes to serve agriculture and other sectors,
</div><span class="text_page_counter">Trang 32</span><div class="page_container" data-page="32">CHAPTER 2: SETUP NUMERICAL MODEL TO SIMULATE STORMSURGE FOR STUDY AREA.
2.1 Data collection and Analysis.211 Topographical data
To localize risk of flooding to area of Do Son, Kien Thuy District, Hai Phong Cityrequires more time and quite complex, input data has a very important role because itdetermines accuracy of a model. The data used in a model include: topographic mapsscale 1/50,000: digital elevation map (DEM) with resolution (30x30) m: tidal data at
Hon Dau station; meteorological data; information about current infrastructure,
situation of flooding (flood marks, risk, size, flood influence, ..)
Topographic maps seale 1/50,000 with seven layers of information includetopography, administrative boundaries, transportation, vegetation cover, river systems,premises, residential. This map is used as a base map to calculate and show the resultsflood simulating for study area
2 a
l4 k,
Fig 2. I Hai Phong city map scale 1:50000
Digital clevation model (DEM) with a resolution (30x30 m): SRTM (Shuttle Radar‘Topography Mission) is a coordinate project NASA and NGA mix (ground Defense
2
</div><span class="text_page_counter">Trang 33</span><div class="page_container" data-page="33">Agency, US) to draw terrain earth's surface in 3-D large area at @ level of detail notseen before. Base on combining SRTM terrain data with resolution of 30x30m and
‘administrative map Hai Phong City scale of 1:50,000 which start to conduct assign
attributes of contour and properties of special points then build digital elevation
models for input as topographic base for study area in the model MIKE Zero.
Qed hy
DEES | -— Ti) BRO Hg menic
QQHOnties FOO RALL (88:8 8) 7900 BASS
‘model to simulate the storm surge.
‘The tidal data in this research is tide of one year at the Hon Dau station which
‘measured by Institute of Coastal and Offshore Engineering Viet Nam.
</div><span class="text_page_counter">Trang 34</span><div class="page_container" data-page="34">2.1.3 Storm data
Data on storms and tropical depressions in the recent period from 2010 to 2015 werecollected from the annual reports of storms (Tropical Cyclone Annual Report) of USTTWC Center often give more information than storm data of other agencies,
Data of storms and tropical depressions are considered in this study included storms
beachhead from Quang Ninh City to Thanh Hoa City in period from year 1952 to2015. The storm could cause fluctuations in sea level, waves high in large area includeHai Phong coast, Base on that, the list of storm which impacted and influenced HaiPhong coast are presented in Table 2.1
‘Table 2.1 List of typhoons affected to Hai Phong coast from 1952 to 2015
No Storm Time City Category
1_| Lois 28/8/1952 Hai Phong 13
2 |Nona /9/1952 ‘Nam Định B
3__| Ophela 14/8/1953 Thanh Hóa. 164 | Blise 12/5/1954 Quảng Ninh 165_ | Olive 30/6/1960 Quing Ninh 37
6 | Kit 13/10/1960 Thanh Hóa. i7_| Pasty 11/8/1962 Hải Phong 128_| Carla 22/9/1962 Nam Định 2
9 | Carmen 17/8/1963 “Thái Bình >IT
10_| Faye 9/9/1963 "Nam Dinh 1711 | Winie 3/1/1964 Quảng Ninh 16
12_| Freda 16/7/1965 Quảng Ninh >IT13 | Phylis 2/8/1966, Ninh Bình 914 | Rose 13/8/1968 Nam Định "
15 |Wendy 9/9/1968 ‘Nam Dinh >IT
16 | Jean 18/7/1971 ‘Thanh Hóa. 14
17 |Dala 30/9/1971 Thanh Hóa, 2
18_| Cora 26/8/1972 Hải Phong 1219 | Anita 14/7/1973 Hà Tĩnh 1220 |Kae 26/8/1973 “Thái Bình "
21 | Louise /9/1913 Hải Phong 1B22_| Marge 15/9/1973 Ninh Bình B23 | Dinan 14/6/1974 Ninh Bình 12
”
</div><span class="text_page_counter">Trang 35</span><div class="page_container" data-page="35">No Storm e City Category24 | Della 2110/1974 Ninh Bình "425 | Alice 20/9/1975 Ninh Bình 13
26 | Sarah 27977 Hai Phong 132? | Blaine 28/8/1978 “Quảng Ninh 1228 | Lola 3/10/1918 “Quảng Ninh 1329 | Joe 23/7/1980 “Quảng Ninh 16
38 23/10/1988 ‘Nam Định 1339 11/6/1989 Ninh Binh 16
40 23/7/1989 “Thanh Hóa. 10
4 03/10/1989 “Thanh Hóa. 24“ 14/7/1991 Hai Phịng 13
43 13/8/1991 Hà Tĩnh 15
44 291611992 ‘Thai Binh 1345 14/7/1992 “Thái Bình 1346 28/6/1993 “Quảng Ninh 317
4 31/7/1994 Ninh Bình 848 29/8/1994 Hải Phịng "
49 | Jot 01/9/1994 Hải Phòng 9
50 |Luke 14/9/1994. Nghệ An 10
51_| Loi 29/8/1995 “Thanh Hóa. 2
52 | Frankie 23/7/1996 Nam Dinh 1553 | Mary 13/8/1996, Nam Dịnh 1054_| Niki 2218/1996 Ninh Binh 1555_| Willie 2/9/1996 “Thanh Hóa. 2
56 |Zia 23/8/1997 “Quảng Ninh 1357 | Koni 29/7/2003 Ninh Bình 12
58 | Krovanh 26/8/2003 “Quảng Ninh 15
59 |Washi 31/7/2005 Ninh Bình 9
</div><span class="text_page_counter">Trang 36</span><div class="page_container" data-page="36">No Storm Time | Ciy Category60 | Damre 26/9/2005 Ninh Bình 4
61 |Kaiak 03/11/2005 Thanh Hóa. l4
62 |Tonji 05/7/2007 ˆ QuảngNinh 8
63 |Kamani 06/8/2008 Quảng Ninh 1064_| Soupelor (#5) 08/7/2009 Quảng Ninh 8
65_| Mujigae (#19) 27/9/2009 | Quang Ninh >IT
66_| Conson 1/7/2010 Quảng Ninh 1
67 |Nesat 23/9/2011 Quảng Ninh 10
68 | Kai Tak 12/8/2012 Quảng Ninh 2
69 |Son Tỉnh 23/10/2012 Quảng Ninh "
70 | Bebinca 23/6/2013 Hải Phong 871 |ibi 31/7/2013 Quảng Ninh l0
72 | Haiyan 03112013 | Hải Phòng >IT
73 |Kalmaegi 10/9/2014 Quảng Ninh 1224 | Kujta 20/6/2015 Hải Phong 9
Source: http:/fweather-unisys.com/hurricane/
Details some of strong storm landed in the sea of Hai Phong is listed in table 2.2.
rable 2. 2 Details of some strong typhoon landfall on Hai Phong coast
Ba 1332 0132 40m 122 0ninsz 40
153 1208 718/002. 40
156 1196 0/18/06, 4
159 1183 0/413 50165 1169 0/1182 30
7 1155 07/9007 s
16
</div><span class="text_page_counter">Trang 37</span><div class="page_container" data-page="37">172 mm 00/1962 58
ma 13 0/1932 6mà 124 00191182 70
07 m9 77201002. 1185 HH2 020062 1193 1105 0020122 T0
197 108.6 0120/18 10
202 1055 0021007 65
207 1072 77211067. 35213 1057 012112. 3
TYPHOON DAMREY
LAT (Degree) | LON (Degree) ‘TIME WIND (Knots)
181 1232 ‘09721107. 3196 1208 092112 50
19s 1203 090210182 50
194 1198 092/002 50204 1204 09721067, 50
204 1193 092312 50
208 119 092/182 50202 154 097237002. 5
202 ti 0923062 35
20 1163 09212 5
202 1159 09/2382 5198 1153 0971007. 4
196 1146 ‘097241062. sẽ
lại mm 0924/18 6188 113 097251002. so
19 1123 097251062, %
9 m7 09252Z 5
lợi 1107 0975/18. ss
</div><span class="text_page_counter">Trang 38</span><div class="page_container" data-page="38">isa 110 0926002 1
1» 108.1 0926013 5595 1075 0926182 35197 105 0971062. 6
158 147 0926067 80
16 139 092613 số163 129 0926182 105
165 1219 09/002 95
168 1198 097271067. 4168 In 092m2. 1173 1178 0921/52 1176 1166 09200 70176 158 097281067. 6181 1147 092122 684 1138 09280182 692 128 097291007. 6204 um 097291067. 6
Ey
</div><span class="text_page_counter">Trang 39</span><div class="page_container" data-page="39">202 1089 0929/13 6206 109.1 099/152 6209 1071 097300007. ©H 106.6 097301067. 5214 106.1 0930/12 4
</div><span class="text_page_counter">Trang 40</span><div class="page_container" data-page="40">193 108.1 11/10/12Z 75
205 1073 110/152 6218 1072 nin da
Source: on storm data, statistical characteris including trajectory (direction and speedof movement) and storm intensity (maximum wind speed and barometric pressure of
the storm) are analyzed. Input data was taken from a database of characteristics by
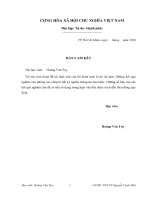
TTWC including locations and maximum wind speed observations under 6 hours apart.Analysis results showed that storms affecting coastal areas in Hai Phong move in thedirection of focus from West - Southwest to Northwest, in which the highest is thewest - northwest (about 44% of the total number of hurricanes affecting the region)
Source: Nguyen Xuan Hien (2013) [35]Fig 2.3 Distribution of storms direction landfall in Hai Phong coast
30
</div>