Luận văn thạc sĩ: Inundation map preparation and flood mitigation procedures for the Xebangfai basin, Khammouane province, Lao PDR
Bạn đang xem bản rút gọn của tài liệu. Xem và tải ngay bản đầy đủ của tài liệu tại đây (3.24 MB, 89 trang )
<span class="text_page_counter">Trang 1</span><div class="page_container" data-page="1">
The Xebangfai river is one of the main tributales of the Mekong river. The Xebangfaibasin mainly covers two provinces namely Khammouan and Savannakhet. whichfrequency affected by flooding which caused from heavy rainfall together with Mekongwater rising up. In order to provides the better understanding about flooding hazard andpotential damage, this study aim to develop the innundation map in downstream ofXebangfai river and the result is very usefully for decision-making and provides themitigation procedurce in lower Xebangfai basin. The flood frequency analysis was doneby using Pearson Type III distribution method to obtain a maximum total rainfall in 7days for 5 years, 10 years, 50 years, 100 years and 200 years return period then constructdesign hyetographs base on the recorded data. The NAM and MIKE 11 models werecalibrated and verified by using the periods floods data. Then the floods simulation andinundation maps were done for different return periods in order to determine the floodhazard and level of hazard in the study area. Finally, there are some recommendationsfor flood procedure were carried out in order to reduce the negative effects of floods.
</div><span class="text_page_counter">Trang 2</span><div class="page_container" data-page="2">hereby certify thatthe work which is being presented in thị thesis entitled, “InundationPreparation Map and Flooding Mitigation Procedure for Xebangfai Basin, KhammouanProvince in Laos PDR” in partial fulfilment for the award of the Master of Science inDisaster Management, is authentic record of my own work caried out under supervisionof Dr. Vu Thanh Tu and Assoc Prof, Hoang Thanh Tung.
“The matter embodied in thesis has not been submitted by me for the award of any otherdegree or diploma,
KHUMPHON SENGSOULIYA.
</div><span class="text_page_counter">Trang 3</span><div class="page_container" data-page="3">Before I was successful on study and thesis if I would not have been possible withoutkindly help of many people. First and foremost, I would like to express my appreciationto all that helped me to finish this thesis, particularly my advisor Dr.VU THANH TU
and co-advisor Associate Professor HOANG THANH TUNG for their guides and
patient during my works for master’s degree
1 would like to thank you to NICHE-VNM 106 Project for their financial support duringthe MSC study at Thuy Loi University. would like to thank to all teachers andprofessors of Thuy Loi University, especially Dr. Nguyen Mai Dang, who gaveme the opportunity of master course at this university
I would like to thank all lecture of Master Degree Program in English on Di <small>ster</small>
Management and thesis committee who provided the useful knowledge and skills durin,the course works and good comments for improving of this thesis as well. I would alsolike to thank all classmate of Master Degree Program in English on Disaster‘Management that shared experiences on research and thesi <small>writing,</small>
And thanks go to all agencies and individuals that provided data, information andmaterial during data collection, model implementation and thesis writing which leadedto success for completing this study and thesis.
Finally, 1 would like to acknowledge my family for their constant support and‘encouragement during the period of my study.
</div><span class="text_page_counter">Trang 4</span><div class="page_container" data-page="4">CHAPTER | INTRODUCTIONLL THEpROMLEM SraTEMENT,1.2. SeorEorsrupy,
13. Omrcnves
CHAPTER 2 LITERATURE REVIEW
2.1. THESTUDIED OF FLOOD SIMULATION AND ASSESSMENT.
2.2 GEOGRAPHICAL INFORMATION SYSTEMS IN HYDROLOGY AND WATER RESOURCES.23. MmanTion FoR FLOODING.
CHAPTER 3 METRODOLOGY.
3.1 FRAMEWORK OF METHODOLOGY3.2. FLOOD FREQUENCY ANALYSIS32 Pearson type 3 distribution
322 Estimating design hyetographs/aydrograph.33. RAINFALL RUNor® MoDeL.
3⁄4. HDMope.3⁄5 HECRAS.
36 FLOOD ROUTING BY MIKE 11 Moet,361 Governing equations
362 Boundary condition,37 MIKELIGIS.
38. INUNDATION MAPPING
3.9 FLOOD HAZARD ASSESSMENT.
CHAPTER 4. DESCRIPTION OF THE STUDY AREA AND DATA ANALYSIS
<small>4.1 INTRODUCTION ABOUPTHE STUDY AREA,au Location</small>
<small>412 Topography</small>
<small>413 District location and geography4i4 ‘Water Resources Status.</small>
<small>415 Bathymetric data416 ‘Maps and information</small>
42. METEO-HYDROLOGICAL CONDITION.
<small>đai Climate422 Data collection</small>
<small>m3</small>
</div><span class="text_page_counter">Trang 5</span><div class="page_container" data-page="5">43. FREQUENCY ANALYSIS AND DEVELOPING DESIGN AND HYETOGRAPHai Frequency Analysis
432 Estimating Design Hyetographs and Developing Design Hydeographs.CHAPTER 5 FLOOD HAZARD ASSESSMENT AND MITIGATION PROCEDURES
5.1 CALIBRATION AND VERIFICATION OF NAM MODEL.sud NAM model for Xebangfai bridge no 13 sub-basinsud Verification
5.2. CALIBRATION AND VERIFICATION OF MIKE-115.3. FLOOD SIMULATION ALONG RIVERS NETWORK.
544 CONSTRUCTING FLOOD INUNDATION MAPS AND HAZARD ASSESSMENTSal (Constructing Flood Inundation Maps.
s42 Hazard Assessment55 FLOOD MITIGATION PROCEDURE.ssi Background
532 Disaster Management Indittional Artangement for Lao PDR533 Priority Areas.
535 Implementing Approaches.
56 STRUCTURE COMMITTEE OF DISASTER MANAGEMENT FOR NONG BOK DISTRICT.561 ‘Committee for disaster management of district evel
562 ‘The roles and responsibilities okey sectors
<small>5.7. PREPAREDNESS MEASURES AGAINST THE FLOODING.</small>
571 Disaster Preparedness Activities.5.8 IMPLEMENTATION RESPONSE FOR DISASTER
<small>sai Preparation disaster response582 Practice disaster response</small>
CHAPTER 6 CONCLUSION AND RECOMIMANDATION.
<small>6.1 SUMMARY</small>
62 CoxcLusioxs:63. RECOMMENDATION
<small>x0</small>
</div><span class="text_page_counter">Trang 6</span><div class="page_container" data-page="6">LIST OF FIGURES.
Figurel: Overview of methodologyFigure 2:NAM model structural
Figure3: Location of Xebangfai River Basin
Figure 4: Location of NongBok District, Khammouan province
Figure 5: Digital Elevation Map Xebangfai Basin in the Xebangfai basinFigure 6: Average of monthly rainfall at Mahaxay station
Figure 7: Hyetograph of rainfall at Mahaxay stationFigure 8: Hyetograph of rainfall at BanHay station.Figure 9: Hyetograph of rainfall at Xaibouathong station,Figure 10: Hyetograph of rainfall at Boualapha station.
Figure 11: Several big flood discharges measured at Mahaxay station in Xebangfai river
Figure 12: Several big flood discharges measured at Xebangfai bridge No 13 stationin Xebangfai river
Figure 13: Actual hyetograph of rainfall (case1) at Mahaxay station.we 14: Actual hyetograph of rainfall (case2) at Mahaxay station.Figure 15: Actual hyetograph of rainfall (case) at Banhay station,Figure 16: Actual hyetograph of rainfall (case2) at Banhay station,
Figure 17: Actual hyetograph of rainfall (case1) at Xaibouathong station,
Figure 18: Actual hyetograph of rainfall (case2) at Xaibouathong stationFigure 19: Actual hyetograph of rainfall (case) at Boualapha stationFigure 20: Actual hyetograph of rainfall (case2) at Boualapha station,
ie 21: Actual hyetograph of rainfall (case1) at Xebangfai station.Figure 22: Actual hyetograph of rainfall (case2) at Xebangfai station
Figure 23: Design hydrographs corresponding to various return periods at Mahaxaystation
Figure 24: Design hydrographs corresponding to various return periods at Xebangfaibridge No 13 station
Figure 25: Inundation map duc to flood of 5 year return period in NongBok district,Khammouan province
</div><span class="text_page_counter">Trang 7</span><div class="page_container" data-page="7">Figure 26: Inundation map due to flood of 10 year return period in NongBok district,Khammouan provinee
Figure 27: Inundation map due to flood of 50 year return period in NongBok district,Khammouan province
Figure 28: Inundation map due to flood of 100 year return period in NongBok disrict,
Khammouan province
Figure 29: Inundation map due to flood of 200 year return period in NongBok district,Khammouan province
Figure 30: The synthesized hazard level of 5 year return period
Figure 31: Disaster Management Institutional Arrangement for Lao PDR,
</div><span class="text_page_counter">Trang 8</span><div class="page_container" data-page="8">LIST OF TABLE
Tablel: Hydro-Meteorological data
Table 2: Average of monthly discharge at Mahaxay and Bridge No 13 (1m)
Table 8: Values of design hyetograph of 5 year return period corresponding to differentrainfall distribution at Banhay station (mm).
Table 9: Values of design hyetograph of 5 year return period corresponding to different
rainfall distribution at Xaibouathong station (mm),
‘Table 10: Values of design hyetograph of Š year return period corresponding to differentrainfall distribution at Boualapha station (mm),
‘Table 11: Values of design hyetograph of Š year return period corresponding to differentrainfall distribution at Xebangfai station (mm).
Table 11: Parameters and Initial condition of MIKE-NAM for Xebangfai bridbasin
‘Table 12 differences in peak of observed and simulate hydrographs in Calibrate at Xebangfabridge No 13 station,
‘Table 13: Difference in peaks of observed and simulated hydrographs in Verificationat Xebangfai bridge No 13 station.
‘Table 14: Difference of simulated and observed maximum water levels from O1-28 in‘Aug-2005 at Tohen station
Table 15: Difference of simulated and observed maximum water levels from August 1009 at Tohen station
</div><span class="text_page_counter">Trang 9</span><div class="page_container" data-page="9">8-21-‘Table 16: Total area (ha) corresponding to each interval of inundation depth (m) in
</div><span class="text_page_counter">Trang 10</span><div class="page_container" data-page="10">Lao PDRMONREDMHGOLMRCLNMCADBDHLasDEMNAMNGONN2SWATXBFMSLUNDPADPC
Lao People Democratie Republic
Ministry of Natural Resources and EnvironmentDepartment of Meteorology and HydrologyGovernment of Lao
‘Mekong River Commission
Lao National Mekong River CommitteeASIAN Development Bank
Danish Hydraulie Institute
Geographic Information SystemsDigital Elevation Model
'Nedbor Afsromnings Model‘Non-Government OrganizationNam Theun 2 Hydropower ProjectSoil and Water Assessment Tool‘Xebangfai River
‘Measure Sea Level
Unite Nation Development PlanAsian Disaster Preparedness Centre
Department of Disaster Preparedness and Mitigation CommitteeNational Disaster Management Committee
Disaster Risk Reduction
National Disaster Prevention and Control CommitteeDisaster Prevention and Control Committee
</div><span class="text_page_counter">Trang 11</span><div class="page_container" data-page="11">CHAPTER INTRODUCTION
LL The problem statement
a landlocked and located in Southeast Asia, it surrounded by
hina, Thailand and Vietnam. The total area of 236.800 km? and.
‘The Laos countryMyanmar, Cambodia,
population has 6.Smillion, it covered by 46% forest and TÔ % mountainousseographieally, Lao PDR is dominated by two features: The Mountains of the North andEast and the Mekong River and its eastern bank tributaries with torrential flow regime‘The climate is tropical monsoon with alternating wet and dry. Both have six monthsuration, wet season from May to October and dry season from November to AprilLao PDR is a country that it’s suffering natural disaster and the events damaged withproperty, houses, building, land use, agriculture and factory such as flooding, drought,earthquake, tropical storms, Hurricane and ete. Flood has significant impacts oninfrastructure, agriculture, forestry, water resources, health and economic growth,livelihoods of Lao people. Since the year 1966, the flood cause grate losses tothe nationaleconomy and the livelihood of people. According to the flood record from 1966-1995(FAO, 2003) and food report from MRC, flood significantly affected a largeproportion of the paddy rice field in the country.
Laos is prone to regular flooding due to vicinity of major rivers like Mekong and Sekong,
rivers, Apart from Mekong, there are several minor rivers like Nam Ou, Xebangfai,Xebangheng, Xekong, Nam Jha, and Nam beng, Nam San, Nam Ngiep, Nam Ngum,[Nam Lik, and Xedone which are responsible for floods in the country. There are severalflooding which are reported to be triggered by storms. Severe Tropical Storm 'Xangsane’in 2006 caused severe floods in central and southern part of the country affected the
In the study area, it was occurred the flooding in the lower XBF in every year which
caused from heavy rainfall together with Mekong wa ing up. The flood situationflow from Nam Theun2 Hydroelectric project. The Nam Theun2 Hydroelectric project
</div><span class="text_page_counter">Trang 12</span><div class="page_container" data-page="12">“The flood levels inthe lower XBF including the XBF river area and the confluence withthe Mekong back which is dominant by the Mekong River. The average additional flow
to the XBE will be approximately 220 ms, with a maximum of 315 mvs. The flooding
event affected for social-economic, public service, life living of people. So the floodingproblem is important that stakeholder have to cooperate to manage of flooding by using
‘map hazard for a good making-decision to management in flooding area,
Nong Bok district is suffering disaster every year by flooding and drought. There areVillages risk from flooding event that it impacts with people, animal, household, landuse, agriculture area, public service, road and ete. More than 80% of flood occurred inNongbok district was caused by overflow from Xebangfai River in the rainy season,‘There are 7 vulnerable points prone to flood including Banepongkiew, Banenamphou,Banesorbor, Banesayphong, Banexamnady, Banesaduea and Banephonesao Earvillages.
‘The second cause of flood is stagnant water after the heavy rain with no channel or watergate to discharge the water out of the area or into Mekong River such as in Thongkalatha,Houylom, Houydeuth streams, Moreove there was overflow of Mekong River into the‘areas, but this case has rarely occurred in the past years. Flood season period is betweenthe end of July to the end of August and some years started from August to September.‘The flood would normally occur between 15 to 30 days. Quantity and severity of flood‘were up to its effects to property (ie. house, paddy field, crop field, livestock, ete) andpublic infrastructure (school, hospital, road, irrigation system, temple, etc). Flooddamages during the past 10 years that it impacts with many sector such as the social andadministration, agriculture, irrigation, infrastructure of transportation, culture.
</div><span class="text_page_counter">Trang 13</span><div class="page_container" data-page="13">+ Creating design hyetographs and design hydrographs corresponding to variousreturn periods such as 5 years, 10 years, 50 years,100 years and 200 years;$# Calibration and verification of NAM and MIKE 11 models base on hydrological
and meteorological data;
+P Simulating water level in XBF river corresponding to various return periods:+ Determining the extent of flooding area, and flooding depth mapping for various
return periods;
+ Constructing the flood hazard map in the study area with different level of hazard
13. Objectives
% Applied the hydrodynamic model for simulating and determining the magnitudes
of flood in the study area:
Using GIS to develop inundation maps and flood hazard map4 Recommend flood mitigation procedures for the XBF Lower Basin,
</div><span class="text_page_counter">Trang 14</span><div class="page_container" data-page="14">CHAPTER2 LITERATURE REVIEW
2.1. The studied of flood simulation and assessment
‘Many country in the world were affected from disasters such as flood, drought, storm,earthquake, erosion, cyclone, Tsunami. These events impacted with many sector anddevelopment countries. There are many researchers about tool that it has suitable tosolve the issues especially it developed the model for simulating and predicting that itwill happened in the future, So there many research about tool of flood hazard map andassessment such as:
MIKEI1, HEC-RAS model used for stream floodplain analysis
structures impacted by floodwater (Vazifedoost, Nayyeri, & Barani, nd). For twois that the locations of
model is different mathematical and can calculate of perform hydrodynamic and theresult of two model when analysis flood depth in the map. It shown in the graphs andsquares regression on the diagram, the results calculated by both hydraulic model forflood mapping very close to each other and simulation results fora region that has beenused both mathematical models
MIKE1I is one ofthe best models and one of characteristic of model is simulation underunsteady modeling (Kamanbedast & Aghamajidi, 2012). This model can simulate of
flood, water quality and sediment transport at river oF canals and ierigation system has
been used effectively. Beside that base on hydrodynamic module and it ean determineHydraulic parameters such as depth and profile of water, discharge or velocity. Theresult of MIKEII model is very useful for ereate of flood plain map that it useful forstrategically development, flood plain monitoring is very benefit for reducing flood riskat management procedure.
Inundation maps used MIKE-NAM for design flood hydrographs corres
different return periods (5, 10, 20, 50, 100 and 20-year) and The NAM and MIKE 11Xponding to
models were calibrates and verified using past flood data, The results shown floodingdepth and inundation area corresponding to various return periods and create flood
</div><span class="text_page_counter">Trang 15</span><div class="page_container" data-page="15">hhazard and flood risk maps in the community and it is very useful for flood risk zoneand flood mitigation planning.
Flood hazard assessment using hydrodynamic modelling-MIKE FLOOD, combiningwith landuse map and resistant capability of local communities and created the‘vulnerable flood map (Thach, River, & Province, 2008). The result of flood hazard mapis very useful for manager, policymakers in integrated flood management.
NREI (2011), Using two model applied namely SWAT and ISIS model for XabangfaiWater Resource and Flooding Mapping. SWAT model used to simulate the basin flowfor assessment the water and its main tributaries, The ISIS model used to simulate theflows and water levels in XFB. The results for using two model were assessment the‘water availability in the basin under the current and future condition and impact ofadditional flow to the XFB basin on floodplain XEB.
All tool of model that researcher studied to create flood mapping, the results is veryuseful for using on the assessment and management of flood risk when flooding‘occurred. Flood mapping is important tool for development of economic and social inthe country because it can show risk area of flooding that it happen how muchpercentage or how much hectare damage from floodplain,
In this case study of research, creating inundation map and flood hazard map by usingMIKE-NAM and MIKEI1 model because it is very useful for learning and practice byusing actual data; and development this model for research in the future:
2.2. Geographical Information Systems in Hydrology and Water Resources‘The GIS are computational tools to store, recover, process and visualize spatial data. Avery interesting concept presented by Loagt
Application of GIS) defines the Gl
+ K. and Corwin (in Hydrologicalas an information integration technologies which‘may include aspects of cartography, remote sensing, demography, economy, landscapeattributes, computational science, etc.
‘The application of the GIS in Hydrology and Water Resources can be classified in (wo
</div><span class="text_page_counter">Trang 16</span><div class="page_container" data-page="16">‘The uses refered to with management include data storage, recovery and visualization,
For example, certain attributes may be stored within the GIS, such asthe siting of wells,the hydrographical network, reservoirs, ete. ‘The manager and planners of this resourcecan use this information for taking decisions (o do with water resources and landplanning.
‘The analytical applications of the GIS refer to modeling, The real potential of the GISlies in its analytical capacity, which allows, among other possibili „ the generation ofnew layers of information. ‘The most common strategies of integrating environmental‘models and GIS can be summed up in three types, according to Rolh, G., La Barbara P.and Greco, M Journal of Hydrology, 187, page 119-135): loose coupling, tight couplingand embedded.
David R. Maidment (1996) and others developed a spatial hydrology model whichsimulates the water flow and transport ona specified region of the earth using GIS datastructures, Constructing a GIS hydrology model at first is to determine what variables‘will be calculated on how many spatial units for a defined number of time periods.Construction of complex models must proc sd by partitioning the total problem into aseries of sub-models that interact with a common database. It is the capacity of GIS forrigorously defining this database which makes possible complex models connectingvvarious parts of the hydrologic cycle within a particular region.
Leipnik eL al. (1993) have explained about the implementation of GIS for waterresources planning and management. GIS is designed to store information about thelocation, topology and attributes of spatially referenced objects and many databasequeries are performed through i They have described in detail about the stages in theimplementation of GIS and understanding of these sta ses help in using GIS in waterresources planning and management effectively.
Shea et al., (1993) described about the integration of GIS and hydrologic modeling indrainage study to develop a surface water management plan for Polk County in CentralFlorida. This linkage provide an effective mechanism for performing large area surface‘water and drainage management studies. Ten separate scenarios were examined for each
</div><span class="text_page_counter">Trang 17</span><div class="page_container" data-page="17">Of the 784 sub-basins comprising the study area. Extensive modeling was done for the‘watershed and it was possible only using the powerful spatial analysis technique of GIS.Integration of GIS, Remote Sensing and Hydrological/Hydraulic Models
2.3 Mitigation for flooding
Mitigation is very necessary for help people who was impacted from disaster likeflooding damage of properties injury, infrastructure, public health, educatiocommunication network, household, agriculture area and etc. There are many researcherstudy about mitigation and management for flooding and the information and results of
- from papers, report, journals newspaper, promotion on TV.
</div><span class="text_page_counter">Trang 18</span><div class="page_container" data-page="18"><small>= Reif and water lve data,</small>
<small>Determining design hydrograph</small>
<small>Rainfall uno model (MIKE-NAM)</small>
<small>ered dats,</small>
<small>lifrence return pris</small>
<small>IKE I)</small>
isle model (
<small>Simulating the Noo flow and determining</small>
<small>maximum Water levels comesponding 0</small>
<small>‘ios eur periods</small>
<small>{GIS tools MIKE-11 GIS.)</small>
<small>Developing inndation maps for various rear,</small>
</div><span class="text_page_counter">Trang 19</span><div class="page_container" data-page="19">possibility occurrences. The statistical information required for flood frequencyanalyses comprises mean values, standard deviation, skewness, and recurrence intervals.‘This information is used to conduct frequency distributions that tell the likelihood ofvarious discharges as a fu jon of recurrence intervals or exceedence probability. Thedistribution method can take on many forms according to the equations used to carry
‘out the statistical analyses. Some of the probability distribution commonly used for
hydrology variables was Normal Distribution, Log-normal Distribution, ExponentialDistribution, Gamma Distribution, Pearson Type III Distribution, Log-Pearson Type IIDistribution, and Extreme Value Distribution (Onni S, saim S, and Putuhena, 2007).The Extreme Value Distribution is further subdivided into three forms namely GumbelDistribution (Extreme Value Type I Distribution), Frechet Distribution (Extreme Value‘Type II Distribution), and weibull Distribution (Extreme Value Type IIL Distribution)(Chow V-T., Maidment D.R, and Mays L.W., 1988). Among these distribution, LogPearson Type I Distribution and Gumbel Distribution are widely used for floodfrequency analyses around the world, Gumbel is often used in hydrology to describe thelargest flood or the lowest flood duc to it defined three types of extreme valuedistributions that should deseribe the describe the distribution of the largest or thesmallest value in the large sample (WMO, 2009),
3.2.1 Pearson type 3 distribution
‘The three parameter gamma distribution is sketched, The frequency factor K is aFunction of the skewness and return period (or CDF). So the evaluate the T-year flood,the moments of the data are determined and:
Qr=Ø+K(C,,T). So wo.2. Estimating design hyetographs/hydrograph
Base on the rainfall data collected from meteorological stations (Mahaxay, Boualapha,Xaibouathong, Banhay and Xebangfai) in basin, using the probabilistic distribution, the{otal of rainfall corresponding to various return periods such as: 200 years, 100 years,
</div><span class="text_page_counter">Trang 20</span><div class="page_container" data-page="20">‘The method can be chosen for calculation. In
study, Person type 3 disused for rainfall frequet cy analysisChoosing a measured rainfall time-series (hyetograph) which has total rainfall is similarto design rainfall, The design hyetograph is obtained by using the ratio:
Where: Ris the rainfall ratio
Xj is the total actual rainfall/maximum d
‘charge in a periodXá: is the total design rainfall/maximum discharge as the same period of actualrainfall
‘Then, Design hyetograph = Actual hyetograph x Ratio (R,)
3.3. Rainfall Runoff Model
Nielsen and Hansen (1973) developed NAM model for simulates the rainfall-runoff
process in catchments. It operates by continuously accounting the moisture content infour different and mutually inter-related storages, i.: Snow Storage, Surface Storage,low Zone Storage, Ground Water Storage representing physical elements of catchment.
iedNAM comprises of a set of linked mathematical statements describing, in simpliquantitative form, the behavior of the land phase of hydrological cycle. The model isdefined as a deterministic, conceptual, lumped type of model with moderate data
requirements. The model area can be divided into a number of sub-eatchments. Each
catchment is treated as one unit so parameters are representative of average values forthe entire catchment, NAM is based on a set of linked mathematical equations, bothempiieal and semi empirical. NAM simulates rainfall-runoff process in ruralcatchments.
Shamsdin and Hashim (2002) applied NAM model for predicting the runoff rate inLayang River located in the Northern part of Malaysia. The results showed that the
predicted amoun
s by the NAM model were in accordance with the historical data10</div><span class="text_page_counter">Trang 21</span><div class="page_container" data-page="21">appropriately and in general the results were satisfactory. As in the objective of thisstudy is to estimate the rainfall runoff discharges of Sungai Layang watershed usingMIKE NAM model
1) Introducing of MIKE-NAM
‘The NAM hydrological model simulates the rainfall-runoff processes occurring at thecatchment seale. NAM forms part of the rainfall-runoff (RR) module of the MIKE 11River modelling system, The rainfall-runoff module can ther be applied independently
‘or used to represent one or more contributing catchments that generate lateral inflows to
aver net- work. In this manner i s possible to teat a single catchment or a large riverbasin containing numerous catchments and a complex network of rivers and channelswithin the same modelling framework.
‘The NAM (Nedbor Affsromnings Model) model isa deterministic, lumped conceptual
tainfalkrunolf model which is originally developed by the Technical University of
Denmark Nielsen and Hansen. In this model, the hydrological cycle isthe basis of thequantitative simulation of water storage and flows in the watershed and its parametersrepresent an average value for the whole watershed, The general structure of the modelwith its four different and mutually interrelated storages and their corresponding flows.‘The NAM auto calibration is implemented by giving all objectives equal weightage andby searching the solution by the shuffled complex evolution algorithm to avoid the‘optimum solution becoming entrapped in local optimums (Madsen 2000, 2003) [12,29]In this paper, the calibration scheme includes the overall volume error and the overallroot mean square error (RMSE) performance statistics (Madsen, 2000; DHI, 2009)[12,28], Calibration ofthe rainfall-runoff model (RR or NAM) is done by adjusting nineNAM parameters and by finding appropriate parameters for describing the initialconditions, Initially, the NAM model was setup using nine parameters (Sirface- rootzone, groundwater). The catchments’ parameters were estimated with a calibration
procedure that was based on available discharge data, Two extended groundwater
parameters (recharge lo lower reservoirs and a time constant for routing lower base flow)in order to simulate a slower base flow in catchments were chosen to improve the model
</div><span class="text_page_counter">Trang 22</span><div class="page_container" data-page="22">performance. The estimation of these parameters was achieved by the auto-calibrationprocedure.
‘The first stage of the application of the NAM model for rainfall runoff estimation is thecalibration process to determine the optimum values of the model parameters, Thesecond stage isthe discharge simulation and the prediction based on the estimated model
parameters during the calibration process
2) Flood Process Simulation by MIKE 11-NAM model
MIKEII NAM is a rainfall-runoff model that is part of the MIKE 11 module developedby Danish Hydraulic Institute (DHD, Denmark MIKE 11 software is meant forsimulation of flow: „ water quality and sediment transport in river, irrigation systems,channels and other water bodies.
‘The NAM (Nedbor Afstromnings Model) is deterministic, lumped and conceptualrainfall-runoff model that operates by continuously accounting for the moisture contentin three different and mutually interrelated storages that represent overland flow,interflow and base flow (DHI 2003)
‘The NAM model has been applied to a number of catchments around the world,representing many different hydrological regimes and climatic conditions. Fleming(1975); Kjestrom and Moffat (1981); Kjelsrom (1998), Areelus (2001), Shamsudin andHashim (2002) and many other researchers carried out rainfall runoff modeling usingMIKE 11 NAM model
</div><span class="text_page_counter">Trang 23</span><div class="page_container" data-page="23">Precipitation is assumed as snow when temperature (T) is below the freezing point and
accumulated in the snow storage till melting conditions happen. When T is higher than
the freezing point the snow in storage is released amount of melting water:
</div><span class="text_page_counter">Trang 24</span><div class="page_container" data-page="24">‘The water trapped on the ground and mois ire intercepted on the vegetation arerepresented as surinc <small>storage.</small>
Amount of water U, in the surface storage is continuously reduced by evaporation andinterflow. The excess water (P,) will enter the streams as overland flow
‘When U > Unis, Pa gives raise to overland flow as well as to infiltration. Qor denotesthe part of Py which contributes to overland flow:
‘The excess rainfall Py that does not spill as overland flow infiltrates into the lower zone
storage. “A portion DL of the amount of infiltration, (P, ~ Qor) is assumed to rise the‘moisture content (L) in the lower zone storage. The remaining amount of infilratimoisture (G) is assumed to seep into deeper and recharge to groundwater storageGand DL are calculated from
w= CQ BE . Eet > Cle o
Qr=o hhemuise
</div><span class="text_page_counter">Trang 25</span><div class="page_container" data-page="25">Ifthe moisture contentsthan these requirements, the remaining fraction is assumed
to be withdrawn by root activity at an actual rate Es
E,is proportional to the potential evapotranspiration (E):
If the capillary flux of water from the groundwater level to the lower zone storage is
depend on the depth of the groundwater level (GWL)
CarLux= |(0— =) (2a mm o
a= 15+ 04SGWLFL:) Groundwater storage
‘The base flow is calculated as the outflow from a linear reservoir:
BF = (GWLBF» — GWL). Sy(CKse)"! for GWL > GWLBFo
Um | mm Maximom-aterconen in| Oveand ow.
Evaporation small pea evapo
Usual value: 10-25 mm
</div><span class="text_page_counter">Trang 26</span><div class="page_container" data-page="26">Lax | Mm [Maximum water content in lower | Overiand fow,melon storage intttaton,
Tor Overiand flow threshold Soil moisture demand
that must be satisfied for
Delays overtand flow at the ‘overland flow to occur
beginningf wat seasonUsual value: 0.0.07
Tr Intertow threhold Soil moisture demand
that must besaisled forineriow ta ossar
Te Groundwater recharge threshold | Soil moisture demandthat must be sated forDelays groundwater recharge at_| etfs mooge tothebeginming ofa wer season | 20
Usual value: 00-07
ce Hm | Timing constant for overiand flow | Routing overiand flowalong catchment slopes
Usual value: 348 hous
Cus | irs | Timing constant orinerlow | Routing itertow alongcatchneat slopes
Deterines shape of peaksUsual value: 3 48 hours
Ces | Hrs | Timing constant fortase flow | Routing recharge throughDetermines shape of baseflow
Usual value: $00 - $000 hours,16
linear groundwaterrecharge
</div><span class="text_page_counter">Trang 27</span><div class="page_container" data-page="27">3.4 HD Model
‘The MIKE 11 hydrodynamic module, an implicit, finite difference model for thecomputation of unsteady flows in rivers and estuaries. The model can deseribe subcritical as well as supercritical flow conditions through a numerical scheme, which‘adapts according to the local flow conditions (in time and space). MIKE 11 HD applied
with the dynamic wave description solves the vertically integrated equations of
conservation of continuity and momentum (the Saint Venant's equations).
3.5 HEC-RAS
HEC-RAS has been developed by Hydrologic Engineering Center for the U.S ArmyCrop of Engineers. Iris made available to the public for use without restriction, HECRAS is designed to perform a one-dimensional steady flow, unsteady flow, sedimenttranspor/mobile bed computations, and water temperature modeling for a fll network
Of natural and constructed channel (HEC, 2010).
The major capabilities of the HEC-RAS compr
Analysis Component, Data Storage and Management, Graphics and Reporting, and RAS.se the User Interface, Hydraulics
‘Mapper. In the Hydraulics Analysis Components, the system contains four dimensional river analysis components for: 1) steady flow water surface profilecomputations; 2) unsteady flow simulation; 3) movable boundary sediment transportcomputations; 4) water quality analysis. All components use a common geometric datarepresentation and hydraulics computations routine.
one-3.6 Flood Routing by MIKE 11 Model
Mike 11 hydrodynamic module (HD) is an implicit, finite difference mathematical‘model for simulating unsteady flow in rivers and floodplains. MIKE 11 can describesub-critical or supercritical flow conditions through numerical scheme which adaptfollowing the condition of local flow (in space and time). The model solves the Saint‘Venant equations based on these assumptions
> The water is incompressible and homogeneous,
</div><span class="text_page_counter">Trang 28</span><div class="page_container" data-page="28">> The average slope of the channel bed is so small that the cosine of the
le it
‘makes with the horizontal can be replaced by unity
> The curvature of the steamlines is small and vertical acceleration is negligible sothat the pressure distribution along a vertical is hydrostatic.
> The effect of boundary friction and turbulence can be accounted for with the
introduction of empirical such as Chezy’s and Manning’s friction factors.3.6.1 Governing equations
MIKE 11 HD module devides a channel cross section in a series of rectangular channelsand solves them by Saint Venant equations:
18
</div><span class="text_page_counter">Trang 29</span><div class="page_container" data-page="29">‘The selection of boundary depends on the availability of data and the physical situation
being simulated.
37 MIKE 11 GIS
+ MIKE 11 application, essential information comprising a MIKE 11 rivernetwork, a MIKE 11 simulation and a Digital Elevation Model (DEM) is
required. For futher analysis, information such as mapRhemes of river,
infrastructure, land use, statellite/radar images and other spatial data can beincluded.
<small>«The river network of a MIKE 11 model is geo-referenced in MIKE 11 GIS</small>
through the Branch Route System (BRS). Linking a MIKE 11 Result file to theBRS, MIKE 11 GIS produces three types of flood maps. These are depth/area‘inundation, duration and comparison/impact flood maps.
+ The MIKE 11 GIS topographical module facilitates accurate and automaticextraction of flood plain topography (flood plain cross-sections and areaelevation relations) from the DEM. The extracted flood plain topography can
readily be imported into a MIKE 11 cross section database.
+The strengths of MIKE 11 GIS are
= automatic generation and editing of DEM.
highly visual outputs (flood maps, video animations, time series, profiles andflood statistics)
easy overlap with other geographical data
extraction of flood plain topography3.8 Inundation mapping
‘Three approaches are conceivable for the estimation of the flood hazard areas in thebasin under consideration: Estimation based on geomorphological survey; Estimationbased on experienced floods, and Estimation based on hydrologic/hydraulic models‘To reduce flood damage, a flood risk map must contain accurate information on themagnitude of flood and distinct flood hazard area. The size of flood is usually expressedin terms of discharge rate, flood height or rainfall intensity. The flood hazard area is
</div><span class="text_page_counter">Trang 30</span><div class="page_container" data-page="30">usually distinguished on a map by a colored area display or contour line of equal waterdepth, In some cases, point depth of water is more useful for local residents, From thetechnical aspects, these three estimation methods are characterized as follows
‘stimation based on geomorphological survey
In this method, attempts are made to grasp qualitative flood prone areas by theclassification of the topography, using the fact that topographical classification such asalluvial fans, deltas, nature levees and back marshes are closely related to the frequencyOf floods and the inundated duration. The characteristics of this method are as follows:
+ Results are obtained by reflecting the floods which had occurred in the past.Therefore, the inundation regimes when a flood of relatively large scale oceurscould be grasped to some extent
+ Though it may be necessary to obiain the help of experts in the fields oftopography and geology in the geomorphological classification, this method isless costly than other methods.
<small>+ Although it is possible to make a preliminary estimate with regards to the</small>
inundated areas and the inundation regimes (duration, velocity of flow. etc),{judgment cannot be made on inundation level and the differences of the regimes
among the floods of different scales,
Estimation based on experienced flood
Thi is a method for finding out flood prone areas and the flood level based on the pastflood conditions. The results of this investigation form the most important part in the
public announcement of flood prone areas. The characteristic of this method are as
* Inundated areas and the flood level could easily be known,
"Since it is experienced flood, reliability of estimation is high. Therefore, this‘method is advantageous in the public announcement with sufficient persuasivepower, Moreover, very valuable lessons could be drawn with regards lo theresponse of residents against floods.
20
</div><span class="text_page_counter">Trang 31</span><div class="page_container" data-page="31">=_Sinee the scale of floods is various, corrections should be made by usinghydrologic/hydraulic models.
3. Estimation based on hydrologie/hydraulic models
In this method, the scale of flood is determined by calculations on probability of therainfall or discharge, and the water levels corresponding to the flood scale is estimatedby method are as follows:Jing hydrologic/hydraulie models, The characteristics of
=— The flood water le cl can be estimated for given flood scale, Therefore, it ispossible to use it in designing the height of foundation embankment required forbuilding ete, or in estimating the inundation depth of house.
+ The accuracy of this method is largely affected by the accuracy of topographicaldata. Therefore, compared with other methods, relatively large expenditure andtime are necessary for accurate estimation
+ Arbitrary probability can be selected as the scale of flood for study.
* Change of flood level due to river improvement and land subsidence can be taken
<small>into account</small>
= Various constants are included in the runoff model, and as a result, considerableerrors would be included in the runoff calculations if the constants areinappropriate, However, when the models are calibrated using the records of pastfloods, the reliability becomes high. Therefor tigation of past floods is
required without fail in adopting this method,
As mentioned above, each method has its advantages and disadvanta, <small>timating</small>
the inundation areas. Among them, the most reliable and persuasive method is theestimation based on past flood records. However, the data and information obtainablethrough the past flood survey are, in general, limited. Studies by hydrologic/hydraulicsimulation models and geomorphologic surveys need to be conducted to complementthe information required for the flood risk mapping.
‘The following procedures are, thus considered most practical for flood risk mapping.‘The past flood data and geomorphologic information are collected and examined
</div><span class="text_page_counter">Trang 32</span><div class="page_container" data-page="32">* Flood conditions are estimated by use of the model taking account the frequencyof flood, effects of river improvement, influence of urbanization and otherchanges in land use of the basin, influence of land subsidence, etc
However, the method of flood risk mapping should be selected and modified forrespective basins according to the expected function of the risk map, availability of data,and situation of the flood prone area
3.9 Flood hazard assessment
‘The hazard as defined by the American Planning Association is an event or physicalcondition that has the potential fo cause the people health, property and infrastructuredamage, agriculture loss, damage to the environment, and business interruption whichlead to the national socio-economic development delay. A flood hazard i a potential forinundation which involves risk to life, health, property, and natural resources and itsfunction.
</div><span class="text_page_counter">Trang 33</span><div class="page_container" data-page="33">CHAPTER4 DESCRIPTION OF THE STUDY AREA AND DATA.
In this province, there are 9 district such as Thakhek, Mabaxay, Nongbok, Hinboun,‘Nhommalath, Boulapha and Nakai districts. And many steam flow through the provinceto join the Mekong River. Some of the major river which originates in the mountains ofthis province are the Xebangfai River, Hinboun River, Namtheun River.
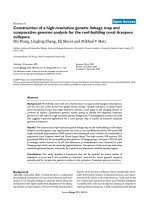
</div><span class="text_page_counter">Trang 34</span><div class="page_container" data-page="34">Figure3: Location of Xebangfai River Basin
26
</div><span class="text_page_counter">Trang 35</span><div class="page_container" data-page="35">‘The XBF River has main tributaries flow into the XBF River including Nam Gnom,
‘Nam Oula, Nam XeNoy as the detail below:
No | Name of river Area(kmẺ) Lengthím)
1 | Nam Gnom 224 15,263,2 | Nam Oula 320 34,5193. | Nam Xe Noy mạ 64,0414 | Nam Phit 98 9.1785 | Nam Plat 120 28,009
4.1.2 Topography
‘The topography of XBF basin in the headwater is mountains and high steep slope, thealtitude varies between 400-1,600m above MSL, and 150-400m above MSL at themiddle of the basin, at the lower part of the basin is plain area which is lower than 150mabove MSL. The area withthe altitude greater 400m above MSL, between 150-400m‘MSL and lower than 150m above MSL cover 25%, 70%, and 5% of the total basin arearespectively,
443
rict location and geography
Nongbok district is located in the southern part of Khammouan province. It shares thenorthern border with Thakhek district, the southern with Xayboury district and‘Savannakhet province separated by Xebangfai River, the east with Xebangfai districtand the west with Thatphanom district of Nakorn Phanom province, Thailand, There is‘Mekong River as national border between the two countri
</div><span class="text_page_counter">Trang 36</span><div class="page_container" data-page="36">Nongbok district covers 313 square kilometers including agricultural area of 14,521.40
hectares (paddy field 12,807.40 ha and crop field 1,714 ha), forests 9,400 ha and wetland
52,726 ha. The temperature ranges from warm to nearly hot. There are two seasons; dryand rainy seasons, In high flood rainfall was about 1,857.3 mm, whereas the middle
flood rainfall was 1,544.1 mm, and low flood rainfall was about 1,382.5 mm per year.
‘The flooded area is mostly agricultural area (plantation and livestock), Cultivation area
is mainly in- season rice and off-season rice, other are economic crops. For land use
planning, the land was mostly registered to inform for taxation (58.33%).
4.1.4 Water Resources Status
XBF is one of the main tributaries of the Mekong River, the annual flow 11.72. Millioncubic meters contributes, which cover 2.43 % of the Mekong River flow. The annual
‘water flow per capita or per unit of land in the basin gives the impression of abundant
‘water resources. However, the seasonal natural of rainfall and existing water use means28
</div><span class="text_page_counter">Trang 37</span><div class="page_container" data-page="37">that there are seasonal and localized water shortages in some years especially fromNamíTheun2 hydropower project approximately 2203.
4.1.5 Bathymetric data
All total cross section data in the case study along the Xebangfai River has 37 sectionand the point start from upsteam of Mahaxay station to confluence of Mekong River:Thecross section data are collected from Flood Management and Mitigation Programme(FMMP, LNMC) and Natural Resources and Environment Institute
4.1.6 Maps and information
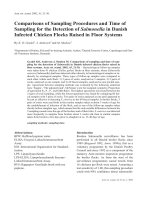
Digital Elevation map (DEM) 90x90 meter for Xebangfai basin, digital land use mapfor Khammouan province and administrative map with scale 1:500000 are collectedfrom Geography Department, MONRE.
</div><span class="text_page_counter">Trang 38</span><div class="page_container" data-page="38">DIGITAL ELEVATION MAP OF XEBANGFAI BAS!
30
</div><span class="text_page_counter">Trang 39</span><div class="page_container" data-page="39">4.2. Meteo-Hydrological condition4.2.1. Climate
‘The climatic condition of the Xebangfai basin is influenced primary by the seasonalsouthwest and the northeast monsoons, The southwest monsoon normally affects thebasin from May to October; this is the period of frequent and heavy rainfall. The dry
season with the transition period is started from end of October to the end of April, The
spatial distribution of mean annual rainfall is from 1500 to 1900 mm,
‘The seasonal range of mean temperature in the low and river valleys mountain if the
Lower Mekong Basin is modest, reflecting the topical and sub-topical nature of theclimate. This signi int changes both seasonally and diurnally at increasing attitude andthe more temperature climate in the North,
4.2.2 Data collection
1) Hydrological and meteorological data
In Laos, meteorological and hydrological data collection has been considered in early1970s, Most of them major provinces have been built for instance at Vientiane capital,XiengKhouang, Parksan, Thakhek. In the 2000s, meteorological stations have beeninvested by companies in order to collect observe data for their project such as[NamTheun2 Hydroelectric project. In fact, the quality of data is quite low because ofold technologi in collecting. Most of rainfall data are not continuous, rainfall data of
some periods were lost because of machine’s problems. Moreover, in Laos,
‘meteorological data are not provided for individual
All of data were collected from Flood Management and Mitigation Programme (FMMP)
under the Lao National Mekong committee; Department of Hydrology and‘Meteorology; Natural Resources and Environment Institute in The Ministry of NaturalResources and Environment, All available hydro-meteorological data collected in thestudy area are described in table as below:
</div><span class="text_page_counter">Trang 40</span><div class="page_container" data-page="40">‘Table I: Hydro-Meteorological data
No | Station Location __| Type of Measured Data Period of DataHydrological
1 | Mahasay XBEriver | Daily Waterlevel 1998-2010Daily discharge 1994-20102 |XBEEddgeNol3, XBErve |DalyWaerleel (1992010Daily discharge 1992-20103 | Tobe XBF river | Daily Waterlevel 1992-2010
1 | Banttay XBF river | Daily Rainfall 1998-20112 | Mahaxay XBF river | Daily Rainfall 1998-20113 | Xaibouathong XBR river | Daily Rainfall 1999.20114 | Xebangtat XBE river | Daily Rainfall 2001-20115 | Boualapha XBF river | Daily Rainfall 2001-20116 |Tháhgk XBF river | Evaporation 1998-2011
2) Rainfall data
In the study area, there are five rainfall stations which measurement daily rainfall,Including Mahaxay, Banhay, Boualapha, Xaibouathong, Xebangfai district; howeverthe measurement at these station were interrupted and/or when the heavy rainfalloccurred.
Base on the collected data, the average annual rainfall of Xebangfai basin is 1964.8 mm.17% of dry season with the transition period is started from end of October to the end
32
</div>