Factors that affecting consumer decision to choose Papa’s Food in RomeA shopping mall
Bạn đang xem bản rút gọn của tài liệu. Xem và tải ngay bản đầy đủ của tài liệu tại đây (1.77 MB, 112 trang )
<span class="text_page_counter">Trang 1</span><div class="page_container" data-page="1">
Factors that affecting consumer decision to choose Papa’s Food in RomeA shopping mall
A dissertation submitted in partial fulfillment of the requirements for the degree of
BSc Business Management
OFF CAMPUS DIVISION
Student’s Name: Tran Hoang Long Student ID: 2124773
Class: BAM058
Supervisor: Mr. Ron Smith
Module Title: BAM6001 - Dissertation
Module Tutor: Dr. David Ratcliff
</div><span class="text_page_counter">Trang 2</span><div class="page_container" data-page="2">DECLARATION
I hereby declare that I am the sole author of the work contained in this dissertation. It has never before, in whole or in part, been submitted for another academic degree. All sources have been accurately cited in text and in the references list provided.
</div><span class="text_page_counter">Trang 4</span><div class="page_container" data-page="4">ABSTRACT
The primary research objective of the thesis is to identify the variables that influence consumers' decisions to select Papa's Food from the food court of the Romea shopping mall in Ho Chi Minh City's District 3. The author's research model includes the following 7 elements: (1) Product quality; (2) Service quality; (3) Promotion; (4) Price perceived to be appropriate; (5) Additional services; (6) Place, (7) Reference group. According to the research, other diners' decisions to choose a restaurant are influenced by seven factors, including Accordingly, (1) Product quality (FQ), Reference group (RG), (3) Complementary products (PS), Promotion (PRO), (5) Quality Service Quality (SQ), (6) Perceived Appropriateness of Price (PR), and (7) Location (LO) are the factors that have the greatest influence, the author proposes 7 corresponding management implications for the Papa's Food restaurant at RomeA shopping mall food court, District 3, Ho Chi Minh City
</div><span class="text_page_counter">Trang 5</span><div class="page_container" data-page="5">1.1: About Papa’s Food ... 1
1.2: Justification for the chosen topic: ... 1
1.3: Object of the topic: ... 2
CHAPTER 2: LITERATURE REVIEW ... 5
2.1: The basic concept ... 5
2.1.1: Shopping mall and food court ... 5
</div><span class="text_page_counter">Trang 6</span><div class="page_container" data-page="6">2.1.2: Restaurants and restaurants in the food court of the shopping mall ... 5
2.1.3: Consumer behaviour ... 6
2.2: Related studies ... 6
2.2.1: Foreign study cases ... 6
2.2.2: Related research by domestic author ... 9
2.3: Proposed research model ... 12
3.3.2: Research ethics checklist ... 27
3.4: Data analysis method ... 28
3.4.1: Descriptive statistics method ... 28
3.4.2: Evaluating the reliability of scales using Cronbach’s Alpha coefficients ... 28
3.4.3: Exploratory Factors Analysis (EFA) ... 28
</div><span class="text_page_counter">Trang 7</span><div class="page_container" data-page="7">4.2.1: Cronbach’s Alpha test of scales ... 35
4.2.2: Exploratory Factor Analysis (EFA) ... 43
5.2.1: “Product quality” factor ... 60
5.2.2: “Reference group” factor ... 60
5.2.3: “Additional service” factor ... 62
</div><span class="text_page_counter">Trang 8</span><div class="page_container" data-page="8">Total Variance Explained ... 90
Total Variance Explained ... 94
</div><span class="text_page_counter">Trang 9</span><div class="page_container" data-page="9">LIST OF TABLES
Table 1: Summary of factors in a review of some studies ... 11
Table 2:Product quality scale ... 20
Table 3:Service quality scale ... 21
Table 4: Price scale ... 22
Table 5: Additional service scale ... Error! Bookmark not defined. Table 6: Location scale ... Error! Bookmark not defined. Table 7: Reference group scale ... 24
Table 8: Promotion scale ... 24
Table 9: Consumer decision scale ... 25
Table 10: Sample characteristics ... 34
Table 11: Cronbach’s Alpha of Product quality scale ... 39
Table 12: Cronbach’s Alpha of Product quality scale ... 40
Table 13: Cronbach’s Alpha of Service quality scale 37 Table 14: Cronbach’s Alpha of promotion scale ... 37
Table 15: Cronbach’s Alpha of Price scale ... 38
Table 16: Cronbach’s Alpha of Additional service scale ... 39
Table 17: Cronbach’s Alpha of Location scale ... 40
Table 18: Cronbach’s Alpha of Reference group scale ... 40
Table 19: Cronbach’s Alpha of Consumer decision scale ... Error! Bookmark not defined. Table 20: KMO and Bartlett's Test and Total Variance Explained ... 43
</div><span class="text_page_counter">Trang 10</span><div class="page_container" data-page="10">Table 21: KMO and Bartlett's Test and Total Variance Explained ... 43
Table 22: Rotated Component Matrix<sup>a</sup> ... 45
Table 23: KMO and Bartlett's Test of Consumer decision ... 47
Table 24: Total variance explained ... 52
Table 25: Component matrix of consumer decision ... 53
Table 26: Pearson correlation analysis results ... 49
Table 27: Model Summary b ... 51
Table 28: ANOVA<sup>a</sup> ... 52
Table 29: Regression Coefficients ... 61
Table 30: Conclusion of hypotheses ... 63
Table 31: Mean values of “Product quality” factor ... 58
Table 32: Mean values of “Reference group” factor ... 60
Table 33: Mean values of “Additional service” factor ... 61
Table 34: Mean values of “Promotion” factor ... 62
Table 35: Mean values of “Service quality” factor ... 63
Table 36: Mean values of “Price” factor ... 65
Table 37: Mean values of “Location” factor ... 66
</div><span class="text_page_counter">Trang 11</span><div class="page_container" data-page="11">LIST OF FIGURES
Figure 1: Factors affecting the choice of high-class restaurants of Dhaka people ... 8
Figure 2: Research model of Trương Thị Xuân Đào (2016) ... 9
Figure 3: Research model of Tran Tien Lam (2014) ... 11
Figure 4: Figure 2.4: Author’s research model ... 12
Figure 5: Research process (Source: Author’s construct) ... 18
</div><span class="text_page_counter">Trang 12</span><div class="page_container" data-page="12">LIST OF ABBREVIATIONS
ANOVA Analysis of Variance
EFA Exploratory Factor Analysis
KMO Kaiser – Meyer – Olkin
Sig. Observed significance level
SPSS Statistical Package for the Social Sciences
</div><span class="text_page_counter">Trang 13</span><div class="page_container" data-page="13">CHAPTER 1: INTRODUCTION
1.1: About Papa’s Food
Papa’s Food is a small private restaurant founded in 2019 with the goal to deliver a delicious and nutritious lunch, which is beneficial to health, for busy people, particularly office workers. Because the target customers are office workers and students with little time to rest, the operating time is 8am - 2pm, especially 12pm (Papa’s Food, 2019).
1.2: Justification for the chosen topic:
RomeA Shopping Mall is one of Ho Chi Minh City’s largest shopping centers, with a large number of rich and diverse facilities. Especially eye-catching is the first-class food court with more than 10 top-class restaurants, each with its own personality to suit guests’ tastes. Usually, Papa’s Food restaurant is his one of the most famous brands here, but it’s fairly new and faces stiff competition from big name brands in the same space, such as SanFuLou, My Tho Noodle Soup, etc
According Duong (2021), there are over 540,000 dining options in Vietnam. The number of stores is approximately 278,424 for the micro model, 34,128 for the medium model, 153,576 for the small model, and 73,872 for the large model. Of course, these numbers will continue to grow as the mining potential is still huge.
Due to the feasibility and urgency of the above issues, the author chose the topic “ Factors affecting the decision to choose Papa’s Food restaurant for diners at RomeA shopping mall food court, District 3, Ho Chi Minh City”
</div><span class="text_page_counter">Trang 14</span><div class="page_container" data-page="14">1.3: Object of the topic: 1.3.1: General Object
An investigation of the factors that can influence patrons’ choice to choose the Papa’s Food restaurant in the RomeA Shopping Center Food Hall, District 3, Ho Chi Minh City, Vietnam.
</div><span class="text_page_counter">Trang 15</span><div class="page_container" data-page="15">1.5: The study’s objective and scope
Research object: Factors affecting the decision to choose Papa’s Food restaurant of diners at RomeA shopping mall food court, District 3, Ho Chi Minh City.
Survey object: Customers who have used the food service at Papa’s Food restaurant of diners at RomeA shopping center food court, District 3, Ho Chi Minh City.
Scope of research space: Food court of RomeA Shopping Center, District 3, City. Research time range:
Primary data collection period: from November 2021 to January 2022 Secondary data collection period: from July 2021 to March 2022
</div><span class="text_page_counter">Trang 16</span><div class="page_container" data-page="16">1.6.2: Quantitative research:
After building the draft scale and complete questionnaire, the author uses the draft scale to conduct a preliminary quantitative survey of 40-50 votes. From the obtained results, complete the draft scale and give the official scale.
Utilizing data obtained from a survey distributed to customers who used food services at RomeA Shopping Center in District 3, Ho Chi Minh City. Surveys can be conducted via live stream or through the Internet. Data will be processed with the support of SPSS software version 20.0. The scale will be applied following the EFA preliminary factor analysis, correlation analysis, and Cronbach’s Alpha reliable numerical system method evaluation to test the model and research hypotheses.
Requirements in quantitative research: (1) Preliminary quantitative survey 40-50 votes; (2) Analysis of sample characteristics; (3) Reliability testing; (4) EFA analysis; (5) Pearson correlation analysis; (5) Regression analysis; (6) Testing the research hypothesis; (7) Test the differences in individual characteristics of respondents; (8) Analysis of mean (means)
1.7: Summary
In Chapter 1, the author presents the selected organization for the research, justifies the research topic, and concurrently proposes all three aspects of the study, including the area of investigation, research subjects, and research questions. The impact of organization on job satisfaction will be discussed in detail in the chapter that follows, along with a review of the relevant literature and studies.
</div><span class="text_page_counter">Trang 17</span><div class="page_container" data-page="17">CHAPTER 2: LITERATURE REVIEW 2.1: The basic concept
2.1.1: Shopping mall and food court
A shopping mall is a contemporary, multifaceted commercial business structure that includes a range of commercial and service facilities, including halls, meeting spaces, and rental offices (Lawnet, 2019). Concentrated in one or more nearby building factories, while adhering to industry standards for business divisions, technical equipment, and management levels, as well as organizational structure. Shopping malls are typically constructed on large lots in city centers to guarantee customer convenience and profitability. Additionally, compared to supermarkets, shopping centers are much bigger.
A food court is a large dining area that sells various kinds of food and is typically found in a mall, supermarket, or small restaurant. Food courts have been around for years in the worldwide market. However, since it has only been available in Vietnam for five years, it has become a popular new venture for many consumers.
2.1.2: Restaurants and restaurants in the food court of the shopping mall
A restaurant may engage in the business of providing dietary advantages and other complimentary services in order to turn a profit. According to the trade justification and the target showcase area that the trade uses to develop business goals and serve the target gathering of people, the restaurant serves many different types of customers, and the target audience is very diverse and affluent.
Particularly for restaurants within the shopping mall’s nourishment court, it can be customers who come to shop at the shopping mall, customers who are office workers working in the building, or residents
</div><span class="text_page_counter">Trang 18</span><div class="page_container" data-page="18">living in the building. The restaurant that is a part of the shopping center’s culinary collection can be a part of the shopping center or it can also be an independent business unit because the target audience is quite diverse.
2.1.3: Consumer behaviour
Consumer behavior is used as a dynamic interplay of factors influencing perception, behavior, and environment through which individuals navigate their lives (Bennet, 1988; Kardes et al, 2014). Cbehavior the actions consumers undertake while seeking, using, evaluating, and disposing of products or services they believe will fulfill their needs (Schiffman 1994 cited in Szmigin and Piacentini, 2019).
Businesses can gain a better understanding of what customers buy, why they buy it, and when they should buy it by analyzing and forecasting consumer purchasing behavior. Investigating the variables that influence consumer behavior helps you learn how to use, where to buy, how frequently to buy, how to buy, and how to dispose of products. (Miller, 1975; Stávková et al, 2008).
Kotler & Keller (2006) argues that the complexity of consumer behavior studies is due to the large number of variables that are frequently interacted with. The buyer learns about marketing and outside influences.
Specific purchasing decisions are influenced by the buyer’s characteristics and decision-making processes. Although there is no single model that can account for all aspects of consumer behavior, the majority of studies on the subject indicate that both external and internal factors have an impact on it. (Islamoglu, 1999).
</div><span class="text_page_counter">Trang 19</span><div class="page_container" data-page="19">2.2: Related studies
2.2.1: Foreign study cases
<b>a) Research model of Yong Azrina Ali Akbar and Muharratul Sharifah Shaik Alaudeen (2012) </b>
According to the 2012 research “Determining factors affecting consumers in choosing a full-service restaurant: A case at Seri Iskandar, Perak” by Yong Azrina Ali Akbar and Muharratul Sharifah Shaik Alaudeen. According to the author’s study, six factors impact consumer decision-making: reliability factor, food quality, service quality, location, price, and surroundings. Which lists reliability, service quality, expense, the environment, and location as the consumer’s top concerns, with meal quality coming in second. Customers from different countries have varying requirements due to four factors. Indians, for example, are very concerned with product quality, Chinese, on the other hand, are very concerned with location and the climate, and Malaysians are very concerned with dependability (Akbar and Alaudeen, 2012).
<b>b) Research model of Mohammad Badruzzaman Bhuiyan, Shahin Kadir Bhuiyan and Jannatul Mawa </b>
(2019).
According to the research “Factors affecting customer choice and restaurant preferences: A study in Dhaka city, Bangladesh.” The authors identify six variables that influence customers’ purchasing decisions: brand image, price-quality relationship, environment, service, entertainment facilities, behavior and service attitude. The findings indicate that consumers are always interested in high-quality goods and services (Bhuiyan et al., 2019). But in reality, the majority of eatery managers only pay attention to the standard of the food and drink they serve, ignoring the proper price point. Additionally,
</div><span class="text_page_counter">Trang 20</span><div class="page_container" data-page="20">customers are very interested in the staff’s attitude and customer-oriented mindset, which affects how they feel when they dine here (Bhuiyan et al., 2019).
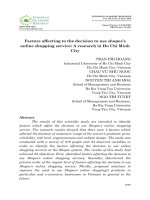
<b>c) Research by Wahida Shahan Tinne (2012) </b>
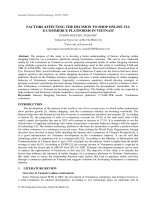
According to Wahida Shahan Tinne, there are six groups of factors that influence the decision to dine at a high-end restaurant, including the “promotional” factors, which include opulent interior and exterior architecture, additional services, and media advertising. Cleanliness, savory cuisine, and qualified staff fall under the group of “internal restaurant” components. The “situational” factors include things like food quality, parking, and protection in the dining area. The expense and accessibility of local cuisine are included in the “price” component group. Among the set of “image” variables are the restaurant’s name and its address in the center of the city. The final group of factors is “luxury,” which includes the specialties of the dishes and serving items in an upscale restaurant (Tinne, 2012).
According to Wahida Shahan Tinne’s study, the following factors influence the people of Dhaka’s choice of high-class restaurant:
<b>“Internal restaurant” Factor: </b>
<b>Clean </b>
<b>Food presentation Professional staff </b>
<b>“Situational” Factor: </b>
-Food quality -Parking lot -Restaurant’s
</div><span class="text_page_counter">Trang 21</span><div class="page_container" data-page="21"><b>“Price” Factor: </b>
-Price
-Local’s specialties availability
<b>“Luxury” Factor: </b>
-The speciality of the dish
-Luxury restaurant utensils
<b>“Image” Factor: </b>
-Brand -Restaurant’s
location from the center
Figure 1: Factors affecting the choice of high-class restaurants of Dhaka people (Tinne, 2012) 2.2.2: Related research by domestic author
<b>a) Research was done by Truong Thi Xuan Dao on “Factors influencing the decision to choose a </b>
restaurant for a wedding reception in Ho Chi Minh City.” (2016)
Figure 2. Research model of Trương Thị Xuân Đào (2016)
The author of the study asserts that the following seven elements have an impact on consumers’ decisions when selecting a wedding venue in Ho Chi Minh City: (1) food quality, (2) service quality, (3) restaurant atmosphere, (4) location, (5) price, (6) the reference group, and (7) positive emotions.
The decision to choose is positively impacted by the quality of the food, the quality of the service, the atmosphere of the restaurant, the location, the price, the reference group, and
</div><span class="text_page_counter">Trang 22</span><div class="page_container" data-page="22">positive feelings. Select a venue for your bridal celebration. Furthermore, the quality of the cuisine, the quality of the service, the ambiance of the restaurant, as well as positive emotions, all have a direct influence on the decision to choose a bridal restaurant. Choosing a restaurant for a wedding is influenced both directly and indirectly by the three factors of cuisine quality, service quality, and restaurant atmosphere (Dao, 2016).
<b>b) According to Tran Thi Thai’s “Research on Factors Affecting Consumers’ Decision to </b>
Choose Fast Food Restaurants in Da Nang City,” (2016)
According to research, consumers in Da Nang city must consider the following five criteria when choosing a fast food establishment: price, brand, attitude and service style, and product quality. Which identifies four elements—convenience, brand, service attitude and style, and product quality—as having a positive impact on the decision to choose a fast food establishment. Furthermore, choosing a restaurant is negatively impacted by the price element (Thai, 2016).
<b>c) “Factors Affecting Consumers’ Decision to Choose Fast Food Restaurants in Ho Chi Minh </b>
City,” by Tran Tien Lam (2014)
The importance of the following factors influencing the desire to select a fast-food restaurant is listed in descending order: restaurant space, quality of service, cost, quality of the product, and marketing. The price issue in particular has a detrimental impact on customers’ intents to choose a fast-food business.
</div><span class="text_page_counter">Trang 23</span><div class="page_container" data-page="23">Figure 3. Research model of Tran Tien Lam (2014)
Researchers
Product Quality
Service Quality
Price Promotion
Additional product
Location
Reference group
Other Factors
Yong Azrina Ali Akbar và Muharratul Sharifa Shaik Alaudeen (2012)
</div><span class="text_page_counter">Trang 24</span><div class="page_container" data-page="24">Trần Tiến Lâm (2014) X X X X X
Table 1: Summary of factors in a review of some studies
2.3: Proposed research model
Each research is distinct, as are the variables used, and no two studies yield the same results. The residential market at RomeA Shopping Center, District 3, Ho Chi Minh City varies from the markets in Bangkok and Dhaka, as does the intended audience, according to the studies of Dao (2016) and Thai (2016). Therefore, when performing this study, the author does not prototype any pre-existing research findings but rather modifies and chooses inherited variables for the best fit.
Decisions to choose the restaurant
</div><span class="text_page_counter">Trang 25</span><div class="page_container" data-page="25">Figure 4: Author’s conceptual framework
<b>a. “Product quality” factor </b>
Customers’ decisions to choose a restaurant are influenced by elements that are associated with product quality. In general, patrons will value a restaurant with high-quality meals. This makes customers a “regular” Lewis (1981). According to Sulek & Hensley (2004), the most important factor influencing customer dining experiences is food quality. Taste, freshness, temperature, presentation, and variety are all aspects of food quality (Liu & Jang, 2009). Furthermore, food must be safe, appealing, and diet-friendly. Richness and variety in dishes are required. Dishes that are regularly updated improve the customer experience. Providing customers with the opportunity to try new dishes and diversify their menu options (Sulek & Hensley, 2004).
<i>H1: “Product quality” has a positive (+) influence on customers’ restaurant choice. </i>
<b>b. “Service quality” factor </b>
Customers’ decisions to choose a restaurant are influenced by the service quality factor. Currently, the culinary market is becoming increasingly competitive; in addition to quality and price, customers are interested in service quality (Alonso et al, 2013). The clothes and appearance of the staff, their friendliness and ability to handle customer requests, their knowledge of the products, and the speed with which they respond to customer requests all reflect the quality of customer service. The service quality factor also influences customer loyalty, as well as the frequency with which customers visit the restaurant (Pugazhenthi, 2011).
<i>H2: “Service quality” has a positive (+) influence on customers’ decision to choose a restaurant </i>
</div><span class="text_page_counter">Trang 26</span><div class="page_container" data-page="26"><b>c. “Suitable price” factor </b>
Each restaurant must target its target customer in order to be successful; depending on the customer, there will be an appropriate price, and the price requirements will also vary. In addition, the pricing strategy also requires the restaurant to have many different prices, to diversify the number of customers and to match the price of ingredients and produce a different dish. Customers are more likely to rate the dining experience negatively if they believe the value they receive is less than the price paid (Mill, 2007).
<i>H3: “Suitable price” has a positive (+) influence on customers’ decision to choose a restaurant. </i>
<b>d. “Promotion” factor </b>
Marketing influences customers’ restaurant selection decisions. When customers need to find a restaurant that sells food, they will look for information such as “can they see if the restaurant has promotions or discounts?” (Lam, 2014). Restaurants that have attractive promotions or sales on a regular basis will attract more customers than other restaurants. Customers are “affected by advertising information in the media,” according to Lam (2014), in addition to information from relatives, which helps the restaurant “stimulate purchasing ability.”.
<i>H4: Marketing factors have a positive (+) influence on customers’ decision to choose a restaurant </i>
<b>e. “Additional service” factor </b>
A customer’s restaurant selection decision is influenced by complementary services. Two restaurants serve similar food and service, but one may be chosen because of a lower price or other secondary
</div><span class="text_page_counter">Trang 27</span><div class="page_container" data-page="27">Customers prefer restaurants that offer home delivery services. Because, in addition to going directly to the restaurant, customers may want to buy at the restaurant but have it delivered to a location that is convenient for them. Because it emphasizes convenience and flexibility, the additional service will make a difference in the restaurant’s offerings. Furthermore, flexible payment methods such as cash, wire transfer, credit card, QR code, or payment support applications will enable customers to form their payments in advance. Reservations and pre-ordering activities must also be prioritized so that the restaurant can attract customers and arrange seats proactively, especially during peak service hours. Customers can take the initiative and feel secure because they have reserved a table ahead of time. Furthermore, forms of ordering food through online applications, delivery apps, or on the restaurant’s website, official Facebook page help customers be satisfied when making their decisions.
<i>H5: “Additional service” factors have a positive (+) influence on restaurant selection. </i>
<b>a. “Location” factor </b>
Customers’ decisions to choose a restaurant are influenced by the location aspect. The location of a restaurant is critical to the retail business and drawing customers. A good location is critical to the success of the hotel and restaurant industry (Tzeng et al., 2002). Customers in some sorts of restaurant businesses like eateries close to where they live and work since it is convenient and convenient. Restaurants near the city center, easy to find, or with convenient traffic and large traffic typically have a significant competitive edge. Furthermore, a good location raises the value of the product when it is sold to clients (Bull, 1994).
<i>H6: “Location” factor has a positive (+) influence on customers’ decision to choose a restaurant </i>
<b>b. “Reference group” factor </b>
</div><span class="text_page_counter">Trang 28</span><div class="page_container" data-page="28">The reference group includes relatives, friends, personal experience, restaurant preference or popularity, and other factors that influence the customer’s selection (Dao, 2016). More than half of the respondents in research conducted by Callan and Hoyes (2000) stated that their initial knowledge of the location came from excellent recommendations from others who had used the product. Furthermore, the mass media is powerful nowadays, and it plays a key role in customers’ decisions. According to Phuong’s (2021) research, “needing to search for a specific product, customers will access it online, providing an opportunity for businesses to introduce and sell products.” Restaurant information is also quite diversified, as seen by reviews from customers who have used the restaurant’s services and products, it will have a significant impact on customers’ decisions.
<i>H7: Reference group factors have a positive (+) influence on customers’ decision to choose a restaurant </i>
2.4: Summary
In this chapter, the author has discussed ideas relating to the food industry, consumption decisions, theories of customer choice behavior, a review of some documents, and previous research models. Related to the topic. Since then, the author has proposed a study model that outlines the significance of 7 factors that diners may consider when selecting Papa’s Food restaurant in District 3 of Ho Chi Minh City’s RomeA Shopping Mall. Using the parameters of the proposed model, develop research hypotheses.
</div><span class="text_page_counter">Trang 29</span><div class="page_container" data-page="29">CHAPTER 3: METHODOLOGY 3.1: Research process and methodology
3.1.1: Research philosophy
The author relied on existing theories to develop hypotheses, which guided the research strategy for data collection. These hypotheses will be examined and either validated entirely or partially, or refuted, leading to the development of new theories that will be further tested in subsequent research. This study emphasizes quantitative observations that can be statistically analyzed to assess hypotheses (Saunders et al., 2012).
3.1.2: Research approach
This research began with the formulation of hypotheses based on a review of academic literature, followed by the creation of a research strategy to test the theoretical framework. Consequently, the author employed a deductive approach. Blaikie (2010) states that a deductive approach advances the study by utilizing existing literature or specifying the conditions under which the theories are anticipated to hold, deriving testable propositions, and examining the premises and logic of the argument that produced them. This argument is then compared to existing theories to evaluate its contribution to understanding. Subsequently, the researcher collects and analyzes relevant data to measure the concepts or variables. If the analysis results are consistent with the premises, the theory is corroborated (Saunders et al, 2012; Blaikie, 2010).
3.1.3: Research process
</div><span class="text_page_counter">Trang 30</span><div class="page_container" data-page="30"> Descriptive statistics method Testing the reliability of scales
through Cronbach’s Alpha Exploratory Factor Analysis (EFA) Pearson correlation analysis Regression analysis
Hypotheses testing Literature review
Applying qualitative method
Applying quantitative method
objectives Defining research topic
With this research topic, the author constructed a proper research process as illustrated in Figure 5 below.
</div><span class="text_page_counter">Trang 31</span><div class="page_container" data-page="31">Following that, there will be a conversation with ten shopping mall and restaurant executives, as well as several industry specialists.
The following information will be gathered from the survey:
Are there any more elements that should be included in the factors influencing customers’ decisions to choose a restaurant?
Understand the contents of each statement on the scale.
Should any observed variables be added (or subtracted) from each research concept?
The scales were chosen to help with the creation of the survey questionnaire and subsequent quantitative research after the qualitative research phase.
Results of qualitative research
Figure 5: Research process (Source: Author’s construct)
</div><span class="text_page_counter">Trang 32</span><div class="page_container" data-page="32">The following factors were accepted by everyone involved after discussion: Product quality, Service quality, Perceived Relevance of Price, Promotion, Additional Services, Reference group, Location. Continuance, normative commitment, and involvement on job satisfaction.
<b>d. Quantitative method: </b>
The scales in the research model were retested through quantitative research. This is a detailed analysis of the data collected through questionnaires from customers and from there giving specific results on the research topic.
The author conducted the questionnaire surveys in the food court of RomeA Shopping Mall. The SPSS software, Excel, and other tools will be used to process all of the supplied data. These tools include descriptive statistics tools, frequency tables, graphs, reliability testing of scales, EFA factor analysis, regression analysis, and other tests (t-test,...).
<b>3.2 : Constructing scales </b>
<b>a) The scale of product quality: </b>
Customers’ decisions to choose a restaurant are influenced by factors related to product quality. Customers ”frequent” restaurants with good meal (Lewis, 1981; Suk and HenSley, 2004; Liu and Jang, 2009). Richness and freshness should be present in the ingredients used in dishes (Ryu et al., 2012).
PQ1 The restaurant provides savoury and nutritious dishes Lewis (1981); Sulek &
</div><span class="text_page_counter">Trang 33</span><div class="page_container" data-page="33">Table 2: Product qualty scale
<b>b) The scale of service quality: </b>
The employees’ demeanor, appearance, friendliness, and ability to manage customer needs, as well as their product knowledge and reaction times, all speak to the caliber of the business’s customer service. Customer loyalty is also affected by the level of service quality. The number of regular restaurant customers (Pugazhenthi, 2010; Kuo et al, 2011).
SQ1 The employees serve the right dishes as ordered
Ryu et. Al (2012); Kuo et al (2011)
SQ2 The food is served within proper timing
SQ3 <sup> The employees are enthusiastic and willing to help </sup>customers when needed
SQ4 <sup> I feel comfortable when communicating with the </sup>employees
Table 3: Service quality scale
PQ3 The menu consists various kind of food <sup>Jang (2009); Ryu et al </sup>(2012)
PQ4 The quality of the ingredients
PQ5 The sanitary within the cooking process
PQ6 The menu is often updated and has seasonal dishes
</div><span class="text_page_counter">Trang 34</span><div class="page_container" data-page="34"><b>c) The scale of price: </b>
Customers are likely to have a negative opinion of their dining experience if they think they got less for their money (Mill, 2007). Diners use “price paid” as a “metric for the quality of restaurants,” according to Muller and Woods (1994). Another advantage for attracting customers is competitive selling prices. The impact of price is always discernible and always prevails over other considerations. Additionally, the transparent selling price fosters customer confidence. Additionally, when utilizing the product at the restaurant, people can determine their own financial capacity (Hyun and Kang, 2014).
PR1 The food price in general is reasonable
Hyun and Kang (2014); Mill (2007); Muller and Woods
(1994) PR2
The price is competitive compare to other restaurants in the mall
PR3 All the prices are listed in the menu
PR4 <sup>Various price point for different level of income </sup>Table 4: Price scale
<b>d) The scale of additional service: </b>
Two restaurants that offer similar cuisine and service might be selected based on a lower price or other secondary factors (Brookes, 2004). Customers are huge fans of restaurants that offer home delivery. Customers can be satisfied by using flexible payment options, table reservation services, pre-ordering, meal ordering forms via online applications, delivery applications, or on the restaurant’s website or
</div><span class="text_page_counter">Trang 35</span><div class="page_container" data-page="35">Codes Statements Sources
Table 5: Additional service scale
<b>e) The scale of location: </b>
An advantageous position is crucial (Tzeng et al., 2002). Customers frequently prefer restaurants that are close to their homes, places of employment, and frequented destinations since it is handy. There is close by parking (Bowdin et al, 2006). Restaurants that are easily accessible, in the heart of the city, or in areas with heavy foot traffic can have a significant competitive edge. When a product is sold to clients, a good location also raises its worth (Bull, 1994).
LO1 The restaurant is located in the city centre. <sup>Hyun and Kang (2014); </sup>Tzeng et al,(2002); Bowdin
et al (2006); Bull (1994). LO2 The restaurant is near where I live or work
AS1 <sup> The restaurant supports reservations and organizes special </sup>occasions such as anniversaries or birthdays
Brookes (2004) AS2 <sup> The restaurant offers online ordering through delivery apps </sup>
AS3 <sup> The restaurant offers app payment service and QR code to </sup>help diversify payment methods
AS4 <sup> The restaurant’s door-to-door delivery service is very </sup>convenient
</div><span class="text_page_counter">Trang 36</span><div class="page_container" data-page="36">LO3 The restaurant is located near where I often hang out Table 6: Location scale
<b>f) The scale of reference group: </b>
A customer's decision to dine at a certain restaurant could be impacted by their friends, family, past experiences, or the reputation of the business (Dao, 2016). In a survey conducted by Callan and Hoyes (2000), more than 50% of participants stated that the reason they visited a place for the first time was because of the favorable recommendations of earlier users of the product or service. They usually choose trustworthy companies (Chen et al., 2008). Phuong (2021) asserts that when consumers are looking for a specific product, they will search online for information. Many restaurants' revenue increase can be attributed in large part to positive media coverage.
RG1 The restaurant has good reputation
Dao (2016); Callan and Hoyes (2000); Chen et al
(2008); Phuong (2021) RG2 The restaurant is recommended by friends or relatives
RG3
The restaurant is well-reviewed by many people on social networks and food review sites
Table 7: Reference group scale
<b>g) The scale of promotion: </b>
Restaurants will stand out from the competition and attract more customers if they regularly conduct appealing specials or promotions. According to Tran Tien Lam (2014), customers are also "affected by
</div><span class="text_page_counter">Trang 37</span><div class="page_container" data-page="37">power." By employing promotions to advertise new products and services, restaurants may reach a larger audience. The opportunity to develop the restaurant's brand, inform more people about it, and create a positive impression in their minds is provided by media marketing and advertising campaigns.
PRO1 <sup>The restaurant often offers good deals and discounts </sup>
Brookes (2004); Lam(2014) PRO2 <sup>The restaurant's promotion is more alluring than that of other </sup>
restaurants
PRO3 <sup>I became familiar with the restaurant through media </sup>advertisements
Table 8: Promotion scale
<b>h) The scale of consumer decision: </b>
Intention to buy is influenced by unforeseen customer factors such as comments from family or advertising on social networking sites. As a result, there is still a certain distance between the intention to buy and the actual purchase at which clients can change their minds. If the purchased product satisfies the customer's expectations, the consumer is satisfied; otherwise, the customer is disappointed. In the event of dissatisfaction, customers might complain to their friends or refuse to buy that product or brand again. As a result, managers must be truthful in their advertising, present accurate information, and have adequate post-buy customer care practices in place to resolve customer concerns and satisfy customers after purchase.
</div><span class="text_page_counter">Trang 38</span><div class="page_container" data-page="38">Codes <sup>Statements </sup> <sup>Sources </sup>
CD1 <sup> I will choose the restaurant because it meets the needs of mine </sup>
Thai (2014) CD2
I will choose the restaurant because it suits my ability
CD3 <sup> I will choose the restaurant because it brings me high benefits best </sup>
CD4
I will recommend the restaurant to my friends and relatives
Table 9: Consumer decision scale 3.3: Data collecting
In quantitative research, surveys are the most commonly used data collection approach. The author employs the two survey methodologies listed below:
Direct survey: In person, distribute surveys to clients and ask them to fill them out, then collect the distributed questionnaires.
Online survey: Customers should be sent online survey surveys in the form of Google Docs via email and social media
3.3.1: Sampling method a) Collecting data:
</div><span class="text_page_counter">Trang 39</span><div class="page_container" data-page="39">The samples were chosen at random. The author distributed the questionnaires and conducted customer interviews with the assistance of the restaurant personnel at the RomeA shopping mall food court.
b) Sample size:
For the exploratory factor analysis (EFA), according to Hair et al. (2006), the sample size is determined based on:
(1) minimum level ((min) = 50)
(2) the number of variables included in the model's analysis
The number of observations necessary for each analyte variable (k) is 5/1 or 10/1, implying that at least 5 observed variables (5/1) or 10 observed variables (10) are required for each analyte variable.
The research model has 7 scales, with a total of 31 observed variables. If k = 5/1, the observed sample will be: 5*31 = 155 questionnaires. If k = 10/1, the observed sample will be: 10*31 = 310 survey votes. As a result, we require a minimum sample size of 155 or 310 questionnaires to perform exploratory factor analysis, depending on the selection rate based on survey ability.
Thus, the required sample size is 155 - 310. The sampling period will run from November 2021 to January 2022.
3.3.2: Research ethics checklist
Participants’ personal information will be kept completely confidential throughout the data colleting process. Please refer to the Appendix for the research ethics checklist form.
</div><span class="text_page_counter">Trang 40</span><div class="page_container" data-page="40">3.4: Data analysis method
3.4.1: Descriptive statistics method
The frequency descriptive statistical method calculates the distribution of data, such as gender, age, education level, position, and seniority of responses, thus illustrating the sample's characteristics. The frequency of occurrence of these attributes is based on personal information used to review and comment on the collected sample with the responses.
3.4.2: Evaluating the reliability of scales using Cronbach’s Alpha coefficients
Evaluate the scale's reliability using Cronbach's Alpha and remove variables with total variable correlation 0.3; the scale will accept when Cronbach's Alpha >=0.60 (Tho, 2011) is removed from the model because these observed variables are not suitable or meaningful for the scale. However, the variables do not match the requirements, thus the decision to exclude or not is based not only on statistics but also on the concept's content value (Tho, 2011)
3.4.3: Exploratory Factors Analysis (EFA)
The Exploratory Factor Analysis (EFA) approach analyzes the correlation between the measured variables by the Barllet test with the level of significance after deleting factors that do not provide reliability using Cronbach's Alpha analysis. To determine the suitability of factor analysis, use a 5% mean (Hair et al., 2006) and a KMO test using a coefficient of 0.5 = KMO = 1 (Tho, 2011)
Factor selection criteria: Based on Eigenvalues index >=1 (Tho, 2011)
Kaiser - Meyer - Olkin (KMO): This is the indicator used to assess the suitability of factor analysis. If 0.5 KMO 1, the data used for factor analysis is suitable. The data utilized for factor
</div>