unit 14 business intelligence
Bạn đang xem bản rút gọn của tài liệu. Xem và tải ngay bản đầy đủ của tài liệu tại đây (3.83 MB, 82 trang )
<span class="text_page_counter">Trang 1</span><div class="page_container" data-page="1">
<b>ASSIGNMENT 2 FRONT SHEET</b>
<b>Unit number and title</b> Unit 14: Business Intelligence
<b>Student declaration</b>
I certify that the assignment submission is entirely my own work and I fully understand the consequences of plagiarism. I understand thatmaking a false declaration is a form of malpractice.
<b>Student’s signatureGrading grid</b>
</div><span class="text_page_counter">Trang 3</span><div class="page_container" data-page="3">P3 P4 P5 P6 M3 M4 D3 D4
<b>IV Signature:</b>
</div><span class="text_page_counter">Trang 5</span><div class="page_container" data-page="5"><b>Table of Contents </b>
<b>Chapter 1: Business Intelligence (P3)...7</b>
1.1
General about BI...7
1.1.1
What is BI?...7
1.1.2
Real examples of how to apply BI on business...9
1.2
BI techniques...10
1.3
BI tools...13
<b>Chapter 2. Demonstration about BI (P4)...18</b>
2.1
Introduce and Explain chosen dataset(s)...18
2.2
Pro-process steps on dataset(s) with Python...20
2.3
Design dashboard with PowerBI...29
2.3.1
Stacked bar chart...30
2.3.2
Donut chart...30
2.3.3
Area chart...31
2.3.4
Map and Country selection board...32
</div><span class="text_page_counter">Trang 6</span><div class="page_container" data-page="6"><b>Chapter 3. Point of View (P5 & P6)...34</b>
3.1
Showing specific examples on your organizations/companies...34Discuss the legal issues involved in exploiting user data for business intelligence....37
</div><span class="text_page_counter">Trang 7</span><div class="page_container" data-page="7"><b>References...41</b>
</div><span class="text_page_counter">Trang 9</span><div class="page_container" data-page="9">Figure 13 Import & show dataset...21
Figure 14 Cleansing dataset...21
Figure 15 Explore info()...22
Figure 16 Explore tail ()...22
</div><span class="text_page_counter">Trang 10</span><div class="page_container" data-page="10">Figure 17 Explore describe ()...23Figure 18 Average stats...23Figure 19 Max stats...24
</div><span class="text_page_counter">Trang 11</span><div class="page_container" data-page="11">Figure 23 Top 10 countries with highest total cases...28
Figure 24 Top 10 countries with highest total deaths...28
Figure 25 Power BI...29
Figure 26 Stacked bar chart...30
Figure 27 Donut chart...31
Figure 28 Area chart...32
Figure 29 Map and Country selection board...33
Figure 30 Dashboard...34
Figure 31 Dashboard interactivity...35
Figure 32 Visualize data using line graph...36
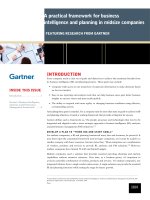
</div><span class="text_page_counter">Trang 13</span><div class="page_container" data-page="13">Business intelligence (BI) is a technology-centric approach aimed at examining data and furnishing valuable insights to executives, supervisors, and staff to support them in enhancing their business choices. Within the BI framework, organizations gather information from both internal and external information technology systems, readyit for examination, execute inquiries on it, and craft data representations, BI dashboards, and reports to present the analytical findings to business users for both operational and strategic decision-making.
The primary objective of business intelligence (BI) initiatives is to support businesses in making more informed decisions that can lead to increased revenue, enhanced operational efficiency, and a competitive edge over their peers. BI achieves this by integrating analytics, data management, and reporting technologies with a range of data handling and analysis methods. The overarching aim of BI is to leverage pertinent data for the betterment of a company's operations. Organizations that effectively implement BI tools and strategies have the potential to converttheir accumulated data into valuable insights regarding their operations and strategies. These insights can then be used to make superior business choices that enhance productivity and revenue, resulting in accelerated growth and greater profitability.
<b>Chapter 1: Business Intelligence (P3)</b>
<b>1.1 General about BI</b>
<b>1.1.1 What is BI?</b>
In simpler terms, business intelligence (BI) is a technology that helps organizations learn from the past to make better decisions, improve actions, and even predict the future. BI encompasses skills, methods, technology, or applications that assist in decision-making. It's a set of tools and processes that blend business analytics, data mining, data visualization, data tools, infrastructure, and methods to enable organizations to make decisions based on data.
</div><span class="text_page_counter">Trang 15</span><div class="page_container" data-page="15"><b>Step Business Intelligence systems are implemented</b>
Step 1: Initial data is extracted from the company's database, which may be spread across various diverse systems.Step 2: The data undergoes a cleaning process and is then moved into the data warehouse. Tables are linked, and data segments are constructed.
Step 3: Users have the ability to employ the BI system for various purposes, including asking questions, requesting customized reports, or conducting different forms of analysis.
</div><span class="text_page_counter">Trang 17</span><div class="page_container" data-page="17"><b>1.1.2 Real examples of how to apply BI on business</b>
<b>Example 1: Starbucks</b>Thanks to its highly effective loyalty card program and mobile application, Starbucks has access todetailed transaction data from millions of customers. Utilizing this data alongside business intelligencetools, the company predicts customer purchases and sends tailored offers through their app and email. Thisstrategy encourages repeat visits from existing customers, ultimately leading to a boost in revenue.
<b>Example 2: Coca-Cola</b>
Coca-Cola leverages its vast social media presence, boasting 35 million Twitter followers and 105 million Facebook fans. Employing AI-driven image recognition technology, the company can identify instances where images of its beverages are shared on the internet. By harnessing the potential of business intelligence (BI), Coca-Cola gains insights into their customer demographics, geographical distribution, and the reasons behind online brand mentions. This valuable information is then utilized to deliver highly personalized advertising to customers, resulting in a fourfold increase in the likelihood of click-through compared to generic advertisements.
<b>Example 3: Netflix</b>
The internet entertainment giant, Netflix, possesses a substantial BI edge thanks to its 148 million user base. What is the business intelligence approach of Netflix? The company harnesses data in diverse ways. Take, for example, how it develops and evaluates fresh programming ideas, drawing inspiration from previously aired shows. Netflix also utilizes business intelligence to actively engage users with its content. The platform excels at promoting tailored content to such an extent that its recommendation algorithm is responsible for more than 80% of all streamed content.
</div><span class="text_page_counter">Trang 19</span><div class="page_container" data-page="19"><b><small>Figure 2 OLAP</small></b>
</div><span class="text_page_counter">Trang 20</span><div class="page_container" data-page="20">The complete sequence of activities encompassing planning, scheduling, performance tracking, sales analysis, reconciliation, and data storage is collectively termed as reporting in the realm of business intelligence. This processserves as a valuable tool for organizations to systematically collect and present data, aiding in managerial activities, planning, and decision-making. Depending on their needs, business leaders may access reports on a daily, weekly, or monthly basis.
</div><span class="text_page_counter">Trang 21</span><div class="page_container" data-page="21">In the realm of Business Intelligence, the term "analytics" refers to the practice of examining data to make informeddecisions and uncover patterns. Business analysts and executives rely on analytics as it enables them to gain deeper insights from their data and extract valuable insights. Analytics find application in various facets of business, ranging from marketing to call centers, and they take on diverse forms. For instance, in call centers, voice analytics is employed to monitor customer sentiment and enhance the quality of responses provided.
</div><span class="text_page_counter">Trang 23</span><div class="page_container" data-page="23">Extraction-Transformation-Loading (ETL) is a unique business intelligence technique that manages theentire data processing workflow. It retrieves data from various sources, performs necessarytransformations, and then feeds it into the business intelligence system. ETL tools are primarily employedas transactional tools for converting data from diverse sources into data warehouses. ETL also plays a role
</div><span class="text_page_counter">Trang 24</span><div class="page_container" data-page="24">in modifying the data to align with the specific requirements of the company. In this way, it enhances thedata's quality before placing it into its final destinations, such as databases or data warehouses.
</div><span class="text_page_counter">Trang 25</span><div class="page_container" data-page="25"><b>1.3 BI tools</b>
Tableau is a data visualization tool that empowers data analysts, scientists, statisticians, and various professionals tovisually represent data and draw meaningful insights from it. Tableau is renowned for its rapid data processing capabilities, delivering desired visualizations efficiently. Importantly, it maintains a high level of security, assuring users that any security concerns identified will be promptly addressed. Users can utilize Tableau to prepare, cleanse,and format their data before creating data visualizations that can be shared with other Tableau users. This versatile data visualization software can serve the needs of individual data analysts as well as entire business teams and organizations.
</div><span class="text_page_counter">Trang 27</span><div class="page_container" data-page="27">Sisense is a data visualization solution rooted in business intelligence, offering an array of tools to assistdata analysts in simplifying intricate data and extracting insights for their organizations and externalstakeholders. Sisense envisions a future where every business is data-centric, and every product has someconnection to data. Consequently, it endeavors to furnish business teams and data analysts with a diverse
</div><span class="text_page_counter">Trang 28</span><div class="page_container" data-page="28">set of data analytics tools to aid in the transformation of their organizations into data-driven entities,aligning with this data-centric future.
Sisense offers a remarkably straightforward installation and user experience. Setting it up takes less than a minute,allowing data analysts to swiftly dive into their work and observe results. Users have the flexibility to export theirfiles into a range of formats, including PowerPoint, Excel, MS Word, PDF, and more, through Sisense. Moreover,
</div><span class="text_page_counter">Trang 29</span><div class="page_container" data-page="29"><b>SAP Analytics Cloud</b>
SAP Analytics Cloud is a powerful platform that integrates business intelligence and data analytics to aid in the evaluation and visualization of data, enabling you to predict business outcomes effectively. It provides access to cutting-edge modeling tools that can identify potential data errors and categorize various data metrics and dimensions.
Additionally, SAP Analytics Cloud offers Data Smart Transformations, enhancing the quality of visualizations.
</div><span class="text_page_counter">Trang 30</span><div class="page_container" data-page="30">What sets it apart is its ability to address your questions and concerns regarding data visualization using conversational artificial intelligence and natural language technologies, ensuring that you are completely satisfied with the platform's capabilities.
</div><span class="text_page_counter">Trang 31</span><div class="page_container" data-page="31">QlikView and Qlik Sense are two widely acclaimed business intelligence tools. QlikView is recognized as a guided tool, while Qlik Sense is known as a self-service business intelligence system. These sophisticated applications offer users the flexibility to analyze data at various stages, from input to processing to output.
Notably, QlikView boasts a system memory feature that logs all actions performed during the analysis. It is known for its high level of sophistication and exceptional overall performance. Furthermore, mobile users have access to the same interactive analytical tools, intuitive associative search capabilities, and impressive visualizations that PC
</div><span class="text_page_counter">Trang 32</span><div class="page_container" data-page="32">users enjoy, making it a versatile and accessible BI system.
</div><span class="text_page_counter">Trang 33</span><div class="page_container" data-page="33">MicroStrategy Analytics
MicroStrategy Analytics is a United States-based data analytics company that offers a versatile platform for those seeking a customized interface. This platform is particularly well-suited for organizations and individuals who are new to BI systems, as MicroStrategy is renowned for its exceptional customized customer support.
On this platform, users can craft personalized dashboards and leverage advanced analytics tools to derive valuable insights from data, making it a powerful resource for data-driven decision-making.
</div><span class="text_page_counter">Trang 35</span><div class="page_container" data-page="35"><b>Chapter 2. Demonstration about BI (P4)</b>
</div><span class="text_page_counter">Trang 36</span><div class="page_container" data-page="36"><b>2.1 Introduce and Explain chosen dataset(s)</b>
The COVID-19 pandemic, which occurred during 2019-20, is a global health crisis caused by the coronavirus 2, leading to severe acute respiratory illness (SARS-CoV-2). The virus was initially identified in Wuhan, Hubei, China, in December of that year. On March 11, 2020, the World Health Organization officially declared the outbreak as a pandemic. By that date, more than 126,000 cases had been confirmed in over 110 countries and territories, with significant outbreaks occurring in mainland China, Italy, South Korea, and Iran. The disease had resulted in the unfortunate loss of over 4,600 lives, while around 67,000 individuals had survived. Please note that
</div><span class="text_page_counter">Trang 37</span><div class="page_container" data-page="37">COVID-19 remains a prominent and urgent global issue, with the entire world grappling with theprofound and multifaceted impacts of the disease. Governments are continually formulating strategies tomitigate the various effects it has brought about. Furthermore, numerous vaccines have been developedand made available to combat the virus.
As time has passed, new variants of the virus have emerged, leading to a surge in COVID-19 cases and,unfortunately, an increase in COVID-19-related deaths. The dataset in question provides regularly updatedCOVID-19 data for every country worldwide, offering critical information for monitoring and respondingto the ongoing pandemic.
No: ordinal number
Total Tests: Number of people who have tested for COVID-19
Serious: Number of cases with severe disease progression
</div><span class="text_page_counter">Trang 39</span><div class="page_container" data-page="39">On a global scale, this dataset depicts the cases of Coronavirus (COVID-19). The information in the dataset will be updated in accordance with World Health Organization announcements.The cumulative information is represented in each column of the dataset:
<b>Total Cases: The total number of infections has been updatedNew Cases: The number of new COVID-19 cases has been updated</b>
<b>Total Deaths: The total number of deaths caused by COVID-19 infection has been updatedNew Deaths: The number of people who have died as a result of COVID-19 infection.Total Recovered: The total number of patients who have been rehabilitated.Active Cases: The total number of infected cases that are currently active.Serious, Critical: The number of cases in which the disease is progressing rapidly.Total Cases/1M Pop: The total number of cases per million people.</b>
<b>Deaths per million people: the total number of people who have died in a million people.Total Tests: The total number of people who have tested positive for COVID-19.Tests/1M Pop: The total number of people who have tested positive for COVID-19 on a </b>
million people.
<b>2.2 Pro-process steps on dataset(s) with Python</b>
The pre-process steps on the dataset are implemented using Python and Jupyter Notebook. Initialize and
<b>import Libraries to Jupyter Notebook:</b>
</div><span class="text_page_counter">Trang 41</span><div class="page_container" data-page="41"><b>Import and show dataset:</b>
<b><small>Figure 13 Import & show dataset</small></b>
<b>Cleansing dataset:</b>
</div><span class="text_page_counter">Trang 43</span><div class="page_container" data-page="43"><b>Explore dataset:</b>
</div><span class="text_page_counter">Trang 45</span><div class="page_container" data-page="45"><b>Calculate statistics of dataset:</b>
</div><span class="text_page_counter">Trang 57</span><div class="page_container" data-page="57"><b>2.3 Design dashboard with PowerBI</b>
I will be using Power BI to process data about COVID-19
<b>Purpose of dashboard:</b>
The dashboard above was created to visualize the global Covid-19 dataset. This dashboard was createdwith the goal of displaying all of the dataset's key performance indicators in a comprehensive manner. Itmakes the dataset more visually appealing and easier to comprehend or browse through. The dashboarddisplays data in real time, with statistics that are focused and standardized. The dashboard is also designedto be interactive and accessible so that data analysts can work with it easily.
<b><small>Figure 25 Power BI</small></b>
<b>The dashboard contains 4 charts:</b>
</div><span class="text_page_counter">Trang 58</span><div class="page_container" data-page="58">Stacked bar chart: provide total and active cases of all countries, sorted descending.
Area chart: shows the comparison of the 4 values: total number of deaths, number of recoveredand current number of COVID-19 cases in all countries.
Donut chart: shows the total number of cases by specific country around the world.
Map and country selection box: shows all countries of the world (available in the list in dataset)
</div>