southern rubber industry joint stock company
Bạn đang xem bản rút gọn của tài liệu. Xem và tải ngay bản đầy đủ của tài liệu tại đây (1.37 MB, 22 trang )
<span class="text_page_counter">Trang 1</span><div class="page_container" data-page="1">
<b>FIN320 GROUP PROJECT REPORT</b>
<b>Southern Rubber Industry Joint Stock Company </b>
</div><span class="text_page_counter">Trang 2</span><div class="page_container" data-page="2">Table of Contents
<b><small>INTRODUCTION... 4</small></b>
<b><small>Meaning of each group...5</small></b>
<b><small>BALANCE SHEET AND INCOME STATEMENT ANALYSIS...6</small></b>
<b><small>Ratios analysis... 10</small></b>
<b><small>Group 1: Liquidity...10</small></b>
<b><small>Current Ratio =Current asset/ Current liability...10</small></b>
<b><small>Quick Ratio = (Current asset - Inventory)/ Current liability...10</small></b>
<b><small>Group 2: Asset Management...11</small></b>
<b><small>Inventory turnover ratio = Sales/Inventory...11</small></b>
<b><small>Days sales outstanding (DSO) = Receivables/ Average sales per day...12</small></b>
<b><small>Fixed Assets turnover = Sales/ Net fixed asset...13</small></b>
<b><small>Asset turnover ratio= Sales/Asset...14</small></b>
<b><small>Group 3: Debt... 14</small></b>
<b><small>Debt to Capital ratio = Total debt/ Total capital...14</small></b>
<b><small>Times interest earned ratio = EBIT/Interest Expense...15</small></b>
<b><small>Group 4: Profitability...16</small></b>
<b><small>Operating margin = EBIT/Sales...16</small></b>
<b><small>Net profit margin = Profit margin = Net income/ sales...17</small></b>
<b><small>Return on assets (ROA) = Net income / Total Assets...17</small></b>
<b><small>Return on investment capital (ROIC) = NOPAT/Invested capital...19</small></b>
<b><small>Group 5 : The market...20</small></b>
<b><small>Price/Earnings ratio= Price per share/Earning per share...20</small></b>
<b><small>Market/Book ratio = Market price per share/Book value per share...20</small></b>
<b><small>SUMMARY... 21</small></b>
<b><small>References:... 24</small></b>
</div><span class="text_page_counter">Trang 3</span><div class="page_container" data-page="3">In this FIN project, we have agreed to choose Southern Rubber Industry JSC as the major company:
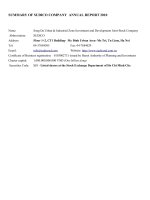
Southern Rubber Industry Joint Stock Company - CASUMINA - was established in the early years after the country's liberation (April 19, 1976), is currently the leading manufacturer of tires and tubes in Vietnam and is the leading manufacturer of tires and tubes in Vietnam. Leading the rubber industry with a dedicated and increasingly youthful board of directors, along with a team of creative and highly qualified staff, CASUMINA has set a clear new vision: "Becoming the leading tire and tube manufacturer in Southeast Asia." This corporation produces and trades industrial rubber products and consumer rubber. Buying and selling raw materials, chemicals (except highly toxic chemicals), rubber industry equipment, real estate business.
- Name: The Southern Rubber Industry Joint Stock Company - Trademark: CASUMINA
- Head Office: 180 Nguyen Thi Minh Khai street, ward 6, district 3, Ho Chi Minh city - Office: 146 Nguyen Bieu street, ward 2, district 5, Ho Chi Minh city
</div><span class="text_page_counter">Trang 4</span><div class="page_container" data-page="4"><b>Meaning of each group</b>
<b>Current Ratio</b> <sup>Measure the ability of a business to pay </sup>
short-term debt or those. Due within one year.
<b>Quick Ratio</b>
Measure the ability of a business to raise current assets to pay its. Short-term liabilities
Measure of how many times the inventory is sold and replaced over a given period.
<b>Days salesoutstanding (DSO)</b>
To estimate their average collection time. This is a financial ratio that illustrates how a company's
receivables are being managed.
<b>Fixed AssetTurnover</b>
The financial ratios that generally evaluate the efficiency of using assets, here is fixed assets, of
the enterprise.
<b>Asset TurnoverRatio</b>
It is an indicator of the efficiency with which a company is deploying its assets to produce the
<b>Debt to Capitalratio</b>
Measures the proportion of debt a company uses to finance its operations as compared with
its capital.
<b>Times interestearned ratio</b>
Measures the ability of the company to use the profits earned. From the business to pay
interest on the loans it has borrowed.
<b>Operating margin</b> <sup>It reflects the relationship between net profit</sup>
for shareholders. And revenue of the company.
Measures the profitability of a corporation in relation to stockholders’ equity. The higher the
ROE, the more efficient a company's management.
</div><span class="text_page_counter">Trang 5</span><div class="page_container" data-page="5"><b>Return oninvestment capital</b>
relation to investment capital. The higher the ROIC, the more efficient a company's
Assess the relationship between a stock's current market price and its earnings-per-share
ratio, or how much investors are willing to pay for a stock in the stock market.
<b>Market/Book ratio</b>
Evaluate a company’s current market value relative to its book value. The market value is the current stock price of all outstanding shares
(i.e. the price that the market believes the
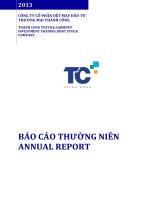
</div><span class="text_page_counter">Trang 6</span><div class="page_container" data-page="6">Net Revenue: The company's net revenue increased from 2018 to 2021. This growth could be attributed to a number of factors, such as increase in customer base, introduction of new services/products, improvement in efficiency/effectiveness of operations, etc. However, the net revenue declined in 2020, which could be due to the covid outbreak and lockdowns.
COGS: Despite the increase in net revenue each year, the company's COGS have also increased, leading to a decrease in gross profit. This highlights the need for the company to focus on cost reduction measures to maintain profitability.
Gross Profit: The company's gross profit has fluctuated over the years, reaching a high of 7,343,832.18 in 2019 but decreasing to 5,500,867.89 in 2020
Operating Expense: The company's operating expenses have grown steadily each year, representing a significant portion of its total expenses. This may indicate that the company needs to streamline its operations and find ways to reduce its costs.
The company's earnings before interest and taxes (EBIT) have shown remarkable growth over the years, reaching a high of 2,498,231.12 in 2021. This may suggest that the company is becoming more efficient in its operations and is moving in the right direction.
Interest expenses have been inconsistent over the years, showing a decrease in 2020 but increasing in 2021. This may indicate that the company is managing its debt effectively. The company's net income has increased significantly from 2018 to 2019, with a sharp drop in 2020 followed by a rebound in 2021. This may suggest that the company has faced some challenges in recent years, but has been able to remain profitable.
<b>Balance Sheet</b>
<b>Current </b> 3012424.4 <b>107.45</b> 2803430.3 <b>124.28</b> 2255657.2 <b>103.84</b> 2172178.4 <b>100.00</b>
</div><span class="text_page_counter">Trang 7</span><div class="page_container" data-page="7">The company's current assets have grown steadily over the years, reaching a high of 30,124,244.47 in 2021. This may indicate that the company has been successful in managing its cash flow and has a healthy balance sheet.
The company's non-current assets have shown a decrease in recent years, reaching a low of 11,918,125.54 in 2021. This may suggest that the company has been focusing more on its current assets and is taking a conservative approach to its long-term investment.
The company's total assets have grown steadily over the years, reaching a high of 42,042,370.11 in 2021. This may indicate that the company has been successful in building its resources and has a strong financial position.
The company's liabilities have grown steadily over the years, reaching a high of 29,028,028.81 in 2021. This may indicate that the company has been able to manage its debts effectively.
The company's equity has fluctuated over the years, reaching a low of 12,573,022.38 in 2020. This may indicate that the company has faced some financial challenges in recent years, but has been able to recover and maintain a healthy equity position.
The company's total liabilities and equity have grown steadily over the years, reaching a high of 42,042,370.11 in 2021. This may indicate that the company has been able to maintain a strong financial position and has been able to pay off its debt effectively. The company's financial performance over the years has been strong, with steady
</div><span class="text_page_counter">Trang 8</span><div class="page_container" data-page="8">able to successfully execute its business plan and has also been able to maintain a good cash flow balance.
One of the key strengths of the company has been its ability to generate strong sales revenue from its products and services, which has been a major contributor to its financial success. The company has also been able to effectively manage its expenses, while also increasing its profit margin over the years.
However, there are also some areas where the company can improve. One area to focus on is in improving its operational efficiency. The company has been able to successfully increase its revenue over the years, but it has also seen an increase in its cost of goods sold. This indicates that there may be opportunities to reduce costs and increase profitability. One option could be to evaluate different suppliers to see if they can offer lower prices on materials and components or to look into automation to reduce labor costs. Another option could be to look for ways to reduce waste and shrink, which can reduce the cost of goods sold.
Another area to focus on is in expanding its product line. The company has been able to successfully generate strong revenue from its existing products, but it can also look for ways to expand its product line to tap into new market segments. This can not only increase revenue but also diversify its revenue stream, making it less dependent on any one product.
<b>Vertical Analysis</b>
A vertical analysis consists of transforming the numbers in percentages of the total or initial amount of each of the different statements, this way we will see the weight of each statement over the total amount. Essentially, a benchmark will be set, that in the case of the income statement will be sales, and in the case of the balance sheet it will be the total amount of assets or liabilities and equity. The rest of the financial statements will be compared to their benchmark, being the result, the statement divided by the benchmark. In the vertical analysis the objective is to compare the statements within the same year to see how much of the total percentage of sales, assets and liabilities and equity they account for. (Merchante 2011) (Jerry Weygandt s.f.) (C. William Thomas s.f.) (kenton 2019)
Southern Rubber industry Join Stock company business results report shows that the company's revenue in the period 2018-2021 is on a upward trend, the company's cost of goods sold is stable, accounting for about ½ of the company's revenue. The
</div><span class="text_page_counter">Trang 9</span><div class="page_container" data-page="9">company's net profit to decrease sharply compared to 2021. But in general, the company's net profit in the period 2018-2021 has an increasing trend. The company's funding policy is quite reasonable, helping CASUMINA increase its ability to finance itself with equity and save operating costs.
Southern Rubber industry Join Stock’s balance sheet shows that current assets have shown signs of fluctuate over the years, while the proportion of long-term assets has increased. Equity increased slightly over the years while the proportion of long-term and short-term debt changed somewhat, long-term debt increased to account for more than 40% of capital and short-term debt. term is reduced.
With 1mil VND current liabilities, the company has 1.05mil VND current assets to pay the debt
With 1mil VND current liabilities, the company has 1.09mil VND current
assets to pay the debt .
Current ratio of 2020 and 2021 of CSM are <b>higher </b>than industry average. The ratio is greater than 1 which means it’s more liquidity, and can pay off its
Company should <b>maintain</b> current assets to attain 0.86X that’s equal to industry average. It proves that the company have the capable of paying
debt easily.
CSM have capability of paying off debt and it is higher than industry average. They could improve this indicator steadily to be more liquidity. Higher the ratio, more stable the company is. Now, liquidity position just assumes a position similar to a scale with a
</div><span class="text_page_counter">Trang 10</span><div class="page_container" data-page="10">contrary, if we keep abundant funds, the cost of funds (in the form of interest cost) would reduce the profits. So, a balanced situation is very much desirable as far as
With 1mil VND current liabilities, the company has 0.43mil VND current asset to quickly pay the
With 1mil VND current liabilities, the company has 0.41mil VND current asset
to quickly pay the debt.
Comment <sup>CSM has indicator lower than industry average. The quick ratio of 2021 less</sup> than 1 which means it is illiquid and can’t pay its liabilities immediately.
2020 has current assets and inventories indicators that are smaller than 2021, and 2020 has current liabilities that is smaller than Pepsi => The year
2020 can be able to pay stable debt quickly.
Recommend <sup>CSM needs to increase Sales and Inventory Turnover, improve Invoice</sup> Collection Period to be equal to industry average.
Quick ratio needs to be looked at on an industry-by-industry basis, as the quick ratio for a company in one industry may not be comparable to the ratio for a company in a separate industry. Hence, CSM can improve this ratio to be equal or more than industry average.
<b>Group 2: Asset ManagementInventory turnover ratio = Sales/Inventory</b>
Industry average=
</div><span class="text_page_counter">Trang 11</span><div class="page_container" data-page="11">Calculate 5320632.08/1879212.83= 2.83X
Meaning <sup>Inventory is sold and stocked at</sup> 2.83 times per year
Inventory is sold and stocked at 2.93 times per year
The 2020 target and 2021 target are bigger than the industry average. It means that the company has been managing its inventory quite well and is
more likely to be up to date.
Comparison CSM manages inventory better than the industry average.
More information about the company and its circumstances are needed to determine what this means for its sales or financial health. In different
industries, desirable turnover ratios may differ. Recommend Maintain this level Maintain this level
Higher inventory turnover ratios are preferred by businesses. When a stock turnover ratio falls below industry standards, there is a need to improve the ratio. A lower ratio indicates that the company stocks more than is necessary. In general, inventory operation is more efficient when product sales are faster. This is because inventory turnover would be faster, resulting in a higher inventory turnover ratio. This means that the business requires less funding/investment in inventory for ongoing operations. As a result, it is preferable to have a proper plan in place for improving inventory turnover ratio, either by focusing on better sales or by lowering the blockage of funds on a stock.
<b>Days sales outstanding (DSO)</b> = Receivables/ Average sales per day
Meaning <sup>Company lost about 44 days to collect</sup> its account receivables.
Company lost about 53 days to collect its account receivables.
</div><span class="text_page_counter">Trang 12</span><div class="page_container" data-page="12">Comment average. It means the business takes days to collect its receivables.
average. It means the business takes days to collect its receivables. Comparison CSM takes longer to collect receivable than the industry average.
Reason Relative to their payment term
Recommend <sup>Before prescribing solutions for high DSO, it's critical to understand why</sup> payments are being delayed by getting to the bottom of the issue.
Days sales outstanding should be used to get a better picture of the overall financial health of the company. CSM company products can take more time to sale, that’s why the company has DSO rate higher than the industry average.
<b>Fixed Assets turnover = Sales/ Net fixed asset</b> Meaning <sup>Generates about 5.15 times more sales</sup>
than the net book value of its assets.
Generates about 4.03 times more sales than the net book value of its
assets. Comment
This indicator of company is higher than industry average. It means assets are being utilized efficiently and large amount of sales are generated using a small
amount of assets.
Comparison CSM fixed asset turnover rates is a lot higher than the industry average.
Reason <sup>A higher fixed asset turnover ratio indicates that a company has effectively</sup>
used investments in fixed assets to generate sales.
Fixed asset turnover is the key to determining how effectively your company manages its assets to generate sales. Their operating capital will be too high if they have too much invested in their company's assets. They will lose sales if they do not have
</div>