strategic port analysis insights into hamburg and gemalinks port operations and analysis can gio project using pestel model
Bạn đang xem bản rút gọn của tài liệu. Xem và tải ngay bản đầy đủ của tài liệu tại đây (8.61 MB, 59 trang )
<span class="text_page_counter">Trang 1</span><div class="page_container" data-page="1">
VIETNAM NATIONAL UNIVERSITY <b>– HO</b> CHI MINH CITY INTERNATIONAL UNIVERSITY
SCHOOL OF INDUSTRIAL ENGINEERING & MANAGEMENT
STRATEGIC PORT ANALYSIS:
INSIGHTS INTO HAMBURG AND GEMALINK’S PORT OPERATIONS AND ANALYSIS CAN GIO PROJECT USING PESTEL MODEL
GROUP 03
No. Student Name Student ID % Contribution 1 Bui Bich Hue (Leader) IELSIU20239 100%
4 Espineira Amarelo Maria BA23EX013 100%
Course Name: Port Planning and Operations (IS072IU) Advisor: Assoc. Prof. Dr. Ho Thi Thu Hoa
Teaching Assistant: Ms. Doan Thuy Nha Class: G01_Wed_456
Ho Chi Minh City, Vietnam January/2024
</div><span class="text_page_counter">Trang 2</span><div class="page_container" data-page="2">INDIVIDUAL CONTRIBUTION IN GROUP
Voting: How many members in the group agree with your evaluation?
No. Full name of students
Contribution to group work/ Detail tasks
Scale Voting Signature
1 Bui Bich Hue (Leader)
</div><span class="text_page_counter">Trang 3</span><div class="page_container" data-page="3"><small>Industrial and Systems Engineering Department </small>
ABSTRACT
This report delves into an extensive examination of port operations, spotlighting the Port of Hamburg and Gemalink Port, followed by a meticulous evaluation of the Can Gio Port Project using the PESTEL model, with a specific focus on social dynamics. The objective is to offer profound insights into the geographical nuances, performance metrics, and regional ramifications of these ports, elucidating their developmental phases from planning through construction to operation. The report critically assesses the social implications of the Can Gio Port Project, considering aspects such as employment opportunities, displacement and relocation intricacies, and cultural impacts, employing the PESTEL model as an analytical framework. To address potential challenges identified in the social analysis, the report provides actionable recommendations. It concludes by summarizing key findings and implications for the future trajectory of the Can Gio Port Project.
Keywords: Hamburg Port, Gemalink Port, Can Gio Port Project, PESTEL model.
</div><span class="text_page_counter">Trang 4</span><div class="page_container" data-page="4"><small>Industrial and Systems Engineering Department </small>
ACKNOWLEDGMENT
In the realm of Port Planning and Operations, our Group 6 project served as a culmination of the diverse and intricate knowledge acquired throughout the course. The project provided a practical application of the theoretical concepts learned, allowing us to navigate the complexities of strategic planning, coordination, and operational management within the context of ports.
I would like to extend my heartfelt gratitude to our esteemed lecturer, Assoc. Prof. Ho Thi Thu Hoa, whose guidance, and expertise played a pivotal role in shaping our understanding of the subject matter. Your unwavering commitment to fostering a dynamic and intellectually stimulating learning environment has been a source of inspiration throughout the course and, particularly, in the execution of our group project. A special thanks is also due to Teaching Assistant Ms. Doan Thuy Nha for your invaluable support and assistance. Your prompt and insightful feedback contributed significantly to the refinement of our project, making it a more robust and well-rounded endeavor.
As a team, we have discovered the value of strong collaboration, teamwork, and flexibility that are not only essential for completing a project successfully but also greatly beneficial in professional settings. The project has demonstrated obvious how important it is to consider a variety of aspects during port planning, from risk management to social and environmental sustainability, and it has given us a holistic perspective that reaches beyond the classroom.
Lastly, we are eager to put these skills into practice in our next undertakings, whether they be professional or academic. In addition to broadening our understanding of seaport developing in Vietnam as well as globally, this activity has given us useful expertise that are bound to surely influence our later achievements to the industry.
</div><span class="text_page_counter">Trang 5</span><div class="page_container" data-page="5"><small>Industrial and Systems Engineering Department </small>
LIST OF FIGURES ... vii
CHAPTER 1: ANALYZING GEOGRAPHICAL LOCATION AND PERFORMANCE OF PORT OF HAMBURG... 1
1. Overview of Port of Hamburg ... 1
2. Geographical Location Analysis ... 3
3. Port Performance in Review of Maritime Transport 2023 ... 6
3.1. Port calls and traffic recover from the pandemic crisis ... 6
3.2. Liner shipping connectivity back to a growth trend ... 8
3.3. Asian countries continue to lead in cargo handling performance ... 13
3.4. Time in port and congestion recovering from pandemic disruptions ... 19
CHAPTER 2: ANALYZING GEMALINK PORT THROUGHPUT AND REGIONAL HINTERLAND AND FORELAND ... 25
1. Overview of Gemalink Port ... 25
2. Throughput Evaluation in the Period 2019 Current ... 27 –
2.1. Planning and Construction Stage (Period 2018 2020) ... 27 –
</div><span class="text_page_counter">Trang 6</span><div class="page_container" data-page="6"><small>Industrial and Systems Engineering Department </small>
2.2. Operational Stage (Period 2021 Current) ... 28 –
3. Hinterland and Foreland Analysis ... 29
3.1. Hinterland ... 29
3.2. Foreland ... 32
CHAPTER 3: ASSESSING CAN GIO PORT PROJECT USING PESTEL MODEL: A SOCIAL PERSPECTIVE ... 35
1. Overview of Can Gio Port Project ... 35
2. The Concept of PESTEL Model ... 38
3. Social Factors’ Impacts on Can Gio Port Project ... 40
3.1. Employment Impact ... 40
3.2. Displacement and Relocation ... 41
3.3. Cultural Impact ... 41
4. Recommendations ... 42
4.1. Employment and Local Workforce ... 42
4.2. Resettlement and Compensation ... 43
4.3. Cultural Heritage Preservation ... 44
CHAPTER 4: CONCLUSIONS ... 45
REFERENCES ... 46
APPENDIX ... 48
</div><span class="text_page_counter">Trang 7</span><div class="page_container" data-page="7"><small>Industrial and Systems Engineering Department </small>
LIST OF TABLES
Table 1-1: Minutes per container move, by range of call size, top 25 countries by port calls... 17 Table 1-2: Cargo and vessel handling performance for dry bulk carriers, top 30 economies by vessel arrivals, average values for the first four months of 2023 and changes from 2022 ... 18 Table 1-3: Cargo and vessel handling performance for tankers, top 30 economies by vessel arrivals, average values for the first four months of 2023 and changes from 2022 ... 19
</div><span class="text_page_counter">Trang 8</span><div class="page_container" data-page="8"><small>Industrial and Systems Engineering Department </small>
LIST OF FIGURES
Figure 1-1: Top of largest seaports in Germany from 2019 to 2022 by goods shipment ... 1
Figure 1-2: Chinese shipping firm Cosco acquires a major stake in a container terminal ... 3 –
Figure 1-3: Main routes from Hamburg port ... 4
Figure 1-4: The vessel map of Hamburg Port ... 5
Figure 1-5: Dry and liquid bulk carriers port calls per half year, world total, 2018-2022 ... 7
Figure 1-6: Container throughput, million 20-foot equivalents, 2016-2024... 8
Figure 1-7: Liner shipping connectivity index over the world from Q1 2006 to Q2 2023 ... 9
Figure 1-8 Liner shipping connectivity index for selected nations and groupings averages ... 10 :
Figure 1-9: Average number of operators and largest ships per country ... 11
Figure 1-10: Average number of operators in 5 different regions ... 12
Figure 1-11: Number of active container ports in the world between Q1 2006 and Q2 2023 ... 13
Figure 1-12: Number of active container ports, regional totals, 2006 Q1-2023 Q2 ... 14
Figure 1-13: Top 25 ports under the Container Port Performance Index 2022 ... 15
Figure 1-14: Container Port Performance Index values 2022, ports’ regional distributions ... 16
Figure 1-15: Time in port for different types of vessel from S1 2018 to S2 2022 (days) ... 20
Figure 1-16: Average waiting times of container ships at port (hours) ... 21
Figure 1-17: Fleet capacity at anchorage or in the port by different vessel types (%) ... 22
Figure 2-1: Main view from Gemalink Port, Vietnam ... 25
Figure 2-2: The infrastructure in Gemalink Port ... 26
Figure 2-3: Details of Gemalink Port project ... 27
Figure 2-4: Forecasting throughput between 2021 and 2025 ... 28
Figure 2-5: The design of Cai Mep Ha Logistics Centre ... 32
</div><span class="text_page_counter">Trang 9</span><div class="page_container" data-page="9"><small>Industrial and Systems Engineering Department </small>
Figure 2-6: Map connection of Gemalink port ... 33
Figure 3-1: The geographical location of Can Gio Port Project ... 35
Figure 3-2: The potential transhipment route for Can Gio Port Project ... 36
Figure 3-3: The forecast of the invested capital and throughput of Can Gio port ... 37
Figure 3-4: The transportation infrastruction project related to Can Gio port ... 38
Figure 3-5: PESTEL Analysis ... 38
</div><span class="text_page_counter">Trang 10</span><div class="page_container" data-page="10"><small>Industrial and Systems Engineering Department </small>
CHAPTER 1: ANALYZING GEOGRAPHICAL LOCATION AND PERFORMANCE OF PORT OF HAMBURG
1. Overview of Port of HamburgThe Port of Hamburg, known as “Hamburger Hafen ”, in German, is a prominent seaport located on the banks of the river Elbe in the vibrant city of Hamburg, Germany. Situated at 110 kilometers (68 miles) from its entry point into the North Sea, this port holds the esteemed title of being Germany's "Gateway to the World" or "Tor Zur Welt." It stands as the largest seaport in Germany by volume, playing a crucial role in the nation's trade and commerce. When measured by twenty-foot standard container equivalents (TEUs), the Port of Hamburg ranks as the third busiest in Europe, following Rotterdam and Antwerp, and is also the 15th largest globally. In 2014, an impressive 9.73 million TEUs were processed within its facilities.
</div><span class="text_page_counter">Trang 20</span><div class="page_container" data-page="20"><small>Industrial and Systems Engineering Department </small>
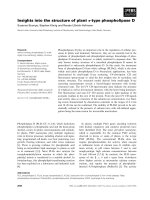
two of these are depicted in the figure below which are the size of the largest vessel (compared to all countries) and the number of service providers per country (on average per country). Notably, as vessel size increases, the number of service providers tends to decrease but this trend appears to have been disrupted, even reversed, in the last three years. Since late 2019, vessel sizes have only shown slight and near-saturation growth. Starting in mid-2022, maritime shipping companies expanded into various new markets, leading to a gradual increase in the average number of service providers per country, reaching 13,000 operators per country, along with vessel sizes approaching 25,000 TEUs. Currently, further increases in vessel volume seem unlikely soon, as this would require significant investments in the maritime infrastructure of countries.
Figure 1-9: Average number of operators and largest ships per country
Regarding the recent rise in the number of service providers for the average countries, this is mainly linked to network expansions, particularly in Asia. Furthermore, the widespread innovation in transport tariffs has encouraged smaller companies to enter or expand into new markets, including trade with North America and Europe. However, while the number of shipping companies providing services to and from these two continents has just experienced a marginal
</div><span class="text_page_counter">Trang 21</span><div class="page_container" data-page="21"><small>Industrial and Systems Engineering Department </small>
rise and continued to trend downward. The Asian market saw a significant upsurge from Quarter 3, 2022 after remaining stable two years prior, reaching a count of nearly 30 operators, particularly prominent in China, India, Qatar, and Vietnam.
3.2.3. Possible return to global liner shipping network growth
Following several decades of remarkable growth that led to the presence of nearly 980 active container ports in the second quarter of 2019, the number of operational container ports within the global maritime transportation network has been decreasing since. A significant decline was noted in the second quarter of the subsequent year due to countries grappling with pandemic-related constraints. Simultaneously, the 2022 second quarter encountered a decrease attributed to disruptions in transportation and trade for the reason of the conflict between Ukraine and Russia. However, more recently, there has been a slight increase in the total number of operational container ports globally, rising from 912 to 920 in the second quarter of two latest years. Moreover, Asia has experienced the most robust increase in the number of active container ports across
</div><span class="text_page_counter">Trang 22</span><div class="page_container" data-page="22"><small>Industrial and Systems Engineering Department </small>
different regions, demonstrating vigorous growth during recent years, while Europe and North America, in contrast, have undergone downturns.
3.3. Asian countries continue to lead in cargo handling performance 3.3.1. Asian container ports excel
Jointly engineered by the World Bank and S&P Global Market Intelligence, the Container Port Performance Index (or CPPI) leverages key performance indicators like the time a vessel remains in port and the efficiency of container management to provide an indicative assessment of waterside activities in container ports.
</div><span class="text_page_counter">Trang 23</span><div class="page_container" data-page="23"><small>Industrial and Systems Engineering Department </small>
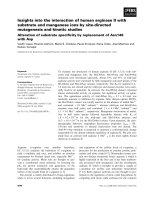
These organizations' collaboration has revealed a significant concentration of high-performing ports in Asia, with 18 ports in the region securing spots in the top 25 global rankings. Delving further into the geographical data, 11 of these top-performing ports are in Eastern Asia, and four are situated in Western Asia.
</div><span class="text_page_counter">Trang 24</span><div class="page_container" data-page="24"><small>Industrial and Systems Engineering Department </small>
According to the Container Port Performance Index and it is shown in the figure -14], Asian [1 ports significantly lead in global rankings with a median index value standing at +53.6. They are trailed by ports in Latin America and the Caribbean, which have a median index of +12.0. Further down the ranking are African ports with a -27.3 median, Oceania at -33.1, and North America with a median index of -42.6. The index itself serves as an evaluative tool, scrutinizing a port's ability to manage container operations including imports, exports, and trans-shipments. Topping this index are the Yangshan port in China and the Salalah port in Oman. Their exemplary performance can be attributed to significant investments in enhancing trans-shipment functionalities, incorporating automation technologies, and fostering system interoperability among various stakeholders like border agencies and logistics operators. These targeted investments create a
</div><span class="text_page_counter">Trang 25</span><div class="page_container" data-page="25"><small>Industrial and Systems Engineering Department </small>
virtuous cycle, bolstering the business environment and facility capabilities, which in turn elevates overall port performance and leads to greater operational efficiency and reduced time for port calls.
Table [1-1] outlines how long it takes to move a container in various countries, expressed in minutes per individual container move. In an analysis of the top 25 nations based on the frequency of port calls, a clear correlation emerges: larger call sizes, specifically those exceeding 4001 moves, result in faster loading and unloading times averaging under one minute per container. — The acceleration in performance is primarily due to the engagement of additional port cranes for each ship, enabling simultaneous operations. Moreover, bigger call sizes often correspond with a higher level of automation throughout the port cranes and yards. In terms of speed across different call size categories, Hong Kong, China, led the pack, followed by Japan, the United Arab Emirates, and Viet Nam, each of which posted top container handling speeds in three separate categories. Malaysia and Viet Nam excelled in two categories, while China, India, the Republic of Korea, Turkey, and Taiwan Province of China each stood out in one specific call size category.
</div><span class="text_page_counter">Trang 26</span><div class="page_container" data-page="26"><small>Industrial and Systems Engineering Department </small>
Table 1-1: Minutes per container move, 2022, by range of call size, top 25 countries by port calls
3.3.2. Improvements in the performance of bulk shipping
By merging the Automatic Identification System (AIS) tracking data for ships with information related to cargo movements, Table -2] offers a comprehensive performance analysis of bulk [1 carriers across the top 30 countries in terms of vessel arrivals. The data reveals that Australia excels in the average speed of loading, clocking an impressive 48 tons per minute. In contrast, Oman takes the lead for the swiftest unloading of dry bulk cargo, with a rate of 34 tons per minute. Remarkably, all four primary performance indicators outlined in the table have shown an upward trajectory over the past year. This positive trend can be understood as the result of ongoing technological evolution coupled with a resurgence from pandemic-related operational setbacks.
</div><span class="text_page_counter">Trang 27</span><div class="page_container" data-page="27"><small>Industrial and Systems Engineering Department </small>
arrivals, average values for the first four months of 2023 and changes from 2022
In Table [1-3], the efficiency of tanker cargo and vessel operations is spotlighted for the top 30 nations, measured by ship arrivals. Cargo management showed marked improvements in both loading and discharging phases, paralleling the trends observed in dry bulk carriers. Yet, there's a deviation when assessing the waiting periods for tanker unloading. The year 2022 marked a significant spike in waiting times, chiefly attributable to pronounced port congestions in Qatar and Angola. These setbacks with Qatar's wait times increasing six-fold and Angola's doubling— — contrasted the overall progress. Speed-wise, Angola stands out in loading, achieving 98 tons per minute, whereas Kuwait sets the benchmark in unloading with a rate of 169 tons per minute.
</div><span class="text_page_counter">Trang 28</span><div class="page_container" data-page="28"><small>Industrial and Systems Engineering Department </small>
average values for the first four months of 2023 and changes from 2022
3.4. Time in port and congestion recovering from pandemic disruptions 3.4.1. Improved time in port since Mid-2022
Over the past few years, the port turnaround time for vessels with a gross tonnage (GT) of 1,000 or more, though notably slow, especially for dry bulk carriers at the lengthiest ports (approximately 2-2.1 days), has exhibited consistent improvement. Moreover, a typical dry bulk carrier spends about three times longer in port compared to container vessels. This disparity can be attributed to
</div><span class="text_page_counter">Trang 29</span><div class="page_container" data-page="29"><small>Industrial and Systems Engineering Department </small>
the lower value of dry bulk cargo and the lesser importance of loading/unloading speed. Moreover, full-load cargo is usually stowed or discharged, while container ships call a sequence of ports, at with only a part of the cargo handled at each port, resulting in a time in port of less than one day. However, during the COVID-19 pandemic, schedules were disrupted, and the port turnaround time was noticeably prolonged for all vessel types (with an average increase of around 0.1 days). As the pandemic and related disruptions gradually receded, vessel turnaround times improved in the second quarter of 2022, although they remained above pre-pandemic levels, as illustrated in the chart below.
3.4.2. Congestion reduced for containerships
The average waiting time of ships at a berth before being able to dock fast or slow is an indicator of potential congestion and delay in port throughput. As observed in the chart below, it shows that container ships tend to spend more time in ports in developing countries (an average of 8-9 hours) than in developed countries (approximately 3-4 hours). Besides, this higher average waiting times
</div>