Different impacts of industrialization on thecarbon emissions across seven asean countries
Bạn đang xem bản rút gọn của tài liệu. Xem và tải ngay bản đầy đủ của tài liệu tại đây (3.4 MB, 23 trang )
<span class="text_page_counter">Trang 1</span><div class="page_container" data-page="1">
VIETNAM NATIONAL UNIVERSITY HO CHI MINH CITY
<b>UNIVERSITY OF ECONOMICS AND LAW</b>
<b>SCIENTIFIC RESEARCH OF STUDENTS</b>
<b>DIFFERENT IMPACTS OF INDUSTRIALIZATION ON THECARBON EMISSIONS ACROSS SEVEN ASEAN COUNTRIES</b>
<b>Class: Economic Mathematics (222MA9308)Lecturer: Dr. Pham Hoang Uyen, Ms. Vo Thi Le UyenGroup:</b>
1 Nguyen Ngoc Thao Nguyen K214020180 <sup>International </sup>
Economics Relation <sup>Leader</sup> 2 Le Phuong Thao K214020183 <sub>Economics Relation</sub><sup>International </sup> Member
Economics Relation <sup>Member</sup>
</div><span class="text_page_counter">Trang 2</span><div class="page_container" data-page="2">2.1.1. GDP per capita and carbon emissions... 5
2.1.2. Export and carbon emissions... 6
2.1.3. Import and carbon emissions... 6
2.1.4. Technology innovation and carbon emissions... 6
2.2. Research data... 6
2.3. Implementation and results... 7
2.3.1. Method 1: Using the logarithms form... 7
2.3.2. Method 2: Using min, max formula... 10
2.3.3. Method 3: Detecting outliers... 12
2.3.3.1. Keeping outliers... 13
2.3.3.2. Removing outliers... 16
CHAPTER III: RESULTS AND DISCUSSION... 20
CHAPTER IV: CONCLUSION... 20
REFERENCES... 21
</div><span class="text_page_counter">Trang 3</span><div class="page_container" data-page="3">The research explores the complex interactions between industrialization and its impact on carbon emissions in seven ASEAN countries: Brunei, Indonesia, Malaysia, the Philippines, Singapore, Thailand, and Vietnam, from 1990 to 2017. was investigated. The results show a nuanced understanding of industrialization. It explores the impact of GDP per capita on CO2 emissions, highlighting the different results observed depending on the level of economic development and industrial structure. Furthermore, the study reveals a complex relationship between trade openness and carbon emissions, with countries exhibiting different emission patterns depending on their export and import profiles. Furthermore, the study highlights the important role of technological innovation in reducing CO2 emissions and highlights the importance of R&D efforts and the introduction of cleaner technologies. These results will deliver valuable insights to policymakers in the ASEAN region and provide guidance in developing effective strategies to promote sustainable development, reduce carbon emissions, and drive technological progress towards a greener future.
Keywords: Carbon emissions, GDP per capita, export, import, technology innovation, ASEAN.
<b>CHAPTER 1: INTRODUCTION1.1. Background</b>
In recent years, the dangers of environmental pollution and climate change have increasingly posed a significant risk to both human health and the ecosystem. The economic development and industrialization have been associated with the excessive consumption of fossil fuels and other resources. This growth has raised concerns among some scholars about the ecological deterioration (Chen et al., 2020a), particularly the substantial release of carbon dioxide (CO2) that is likely to take place mostly in seven ASEAN countries (Brunei, Indonesia, Malaysia, Philippines, Singapore, Thailand, and Vietnam).
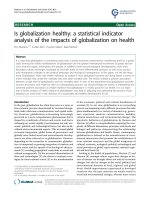
</div><span class="text_page_counter">Trang 4</span><div class="page_container" data-page="4">Exhibit 1: CO2 emissions in seven ASEAN's countries during 1990–2017 (unit: kiloton) Between 1990 and 2017, the ASEAN region's carbon emissions showed significant fluctuations, influenced by various socio-economic and environmental conditions. Certain countries have recorded relatively stable carbon emissions, mainly in industries such as oil and gas. Rapid industrialization and urbanization have led to significant increases in emissions in some areas. The presence of strong manufacturing and export sectors has contributed to significant increases in emissions in some countries. Emissions are also increasing in other countries due to population growth and industrial expansion. On the other hand, countries with smaller, service-oriented economies showed relatively stable emission patterns. While the manufacturing and energy sectors have played important roles in driving emissions growth in certain countries, rapid industrialization and urbanization have contributed to large increases in emissions in others. These diverse developments highlight the importance of implementing sustainable strategies to address environmental challenges across the ASEAN region.
<b>1.2. Research questions</b>
This paper aims to address the following research inquiries:
(1) Does industrialization have a negative influence on the environment in many ASEAN nations? (2) What are the disparities in the composition of the industrial sector among the seven ASEAN countries, and how do these disparities contribute to variations in carbon emissions?
(3) What are the primary factors that account for discrepancies in carbon emissions during industrialization across the chosen ASEAN countries?
<b>1.3. Research subjects and scope of the study1.3.1 Research subjects</b>
The differential impact of industrialization on carbon emissions in seven ASEAN countries via variation data evidence over the period from 1990 to 2017.
Table 1: Definition of the data.
<b>1.3.2 Research scope</b>
</div><span class="text_page_counter">Trang 5</span><div class="page_container" data-page="5">Due to the availability of the data, this study examines the scope of 7 ASEAN countries from 1990-2017. Specifically,
Geography: 7 ASEAN countries, including Brunei, Indonesia, Malaysia, Philippines, Singapore, Thailand, and Vietnam.
Period of time: The data used in the study is the secondary data collected from 1990 to 2017.
<b>1.4. Previous research</b>
Despite the significant growth of industrialization across the Association of Southeast Asian Nations (ASEAN) countries, there remains a notable research gap regarding the varying impacts of industrialization on carbon emissions within this region. While industrialization has been recognized as a major driver of carbon emissions globally, the specific effects and nuances of industrialization on carbon emissions in ASEAN countries have not been extensively studied. Previous research has explored the relationship between industrialization and carbon emissions in individual ASEAN countries, such as Indonesia (Setyawan et al., 2018), Thailand (Santikarn et al., 2020), and Vietnam (Le et al., 2021). However, comparative studies that examine the differences and similarities in the impacts of industrialization on carbon emissions across multiple ASEAN countries are lacking. Such studies are essential because the factors that drive carbon emissions in one country may not be the same in another country due to differences in industrial structures, economic conditions, and environmental policies. For instance, Vietnam has experienced rapid industrialization and urbanization in recent years, leading to a surge in energy consumption and carbon emissions. However, the country's policy focus on renewable energy and energy efficiency has the potential to mitigate the negative impacts of industrialization on the environment and support sustainable development goals. These variations may lead to different levels and patterns of carbon emissions across ASEAN countries, making it necessary to explore the specific factors and mechanisms that influence the relationship between industrialization and carbon emissions within each country. In a related study, Salman et al. (2019) investigated the effects of exports and imports on carbon emissions in ASEAN countries, but their findings do not directly address the research gap on the impacts of industrialization. Therefore, further comparative research is warranted to explore and analyze the different patterns, factors, and outcomes of industrialization on carbon emissions within the ASEAN context, offering valuable insights to inform sustainable development practices and environmental policies in the region.
<b>CHAPTER II: METHODOLOGY2.1. Research model</b>
<b>2.1.1. GDP per capita and carbon emissions.</b>
Researchers and environmentalists have paid a lot of attention to studying the relationship between GDP per capita and carbon emissions. . The link between per capita GDP and carbon emissions is like inverted-U shape curve, which is termed as the Environmental Kuznets Curve (EKC) (Kuznets, 1955;
</div><span class="text_page_counter">Trang 6</span><div class="page_container" data-page="6">Grossman and Krueger, 1991, 1995). Nevertheless, in this study, we mainly focused on 7 ASEAN countries (Brunei, Indonesia, Malaysia, Philippines, Singapore, Thailand, and Vietnam).
Hypothesis a: GDP per capita might have a negative relationship with polution levels.
<b>2.1.2. Export and carbon emissions.</b>
In 1998, Schmalensee and his partners argued that a rise in export levels may lead to the depletion of natural resources, which would increase the carbon emissions from the combustion of fossil fuel and hence, consequent deterioration in environmental quality. According to Sadorsky (2012), import and export activities affect the consumption of energy in local areas.
Hypothesis b: Export might have a negative relationship with polution levels.
<b>2.1.3. Import and carbon emissions.</b>
Imported goods require a substantial network of transportation. This network requires fuel to transport the goods to various destinations. Therefore, an increase in imported goods would require transportation machinery to consume more fuel and thus, raise carbon emissions. Liddle (2018) stated that imports have a considerable impact on consumption-based emissions in a panel of 102 countries over a time period from 1990 to 2013.
Hypothesis c: Import might have a positive relationship with polution levels.
<b>2.1.4. Technology innovation and carbon emissions.</b>
Sohag et al. (2015) stated that technology innovation helps to reduce energy consumption by augmenting the energy efficiency of production operations. Moreover, the study by Samargandi (2017) found that technology innovation plays an insignificant role in reducing carbon emissions in Saudi Arabia. The research conducted by Samargandi (2017) indicated that technological innovation has little impact on reducing carbon emissions in Saudi Arabia.
Hypothesis d: Technology innovation might have a positive relationship with polution levels.
Figure 1: The relationship between industrialization factors and carbon emissions.
</div><span class="text_page_counter">Trang 7</span><div class="page_container" data-page="7">We derived the data from the World Development Indicators (WDI) covering the time period from 1990 to 2017. The dependent variable is carbon dioxide emissions (CO2) whereas, the independent variables include GDP per capita (GDPpc), export (Ex), import (Im) and technology innovation (TI).
Table 2: Summary of the data from 1990 to 2017.
<b>2.3. Implementation and results</b>
Before running the model, we chose 3 following distinguished methods to check the availability of the following data:
<b>2.3.1. Method 1: Using the logarithms form</b>
As the data has “time series” issue, we use “d.variable” to create missing values before develop the econometric model of carbon emissions following the logarithm form for seven ASEAN countries:
ln(d.CO2) = + ln(d.GDPpc) + ln(d.Ex) + ln(d.Im) + ln(d.TI)
To analyze the variances, we built the ANOVA table for logarithms, then infer the equation:
</div><span class="text_page_counter">Trang 8</span><div class="page_container" data-page="8">Table 3: The ANOVA table.
ln(d.CO2) = 57,48 - 10,03ln(d.GDPpc) – 0,0003ln(d.Ex) + 0,0004ln(d.Im) + 0,48ln(d.TI) (*) It can be seen from the equation (*) that GDP per capita and export both have negative impacts on the carbon emissions, while import and technology innovation show positive influences on the pollution levels, when other variable keeps constant respectively. However, whether the data is reliable or not would be checked through the assumptions about the error term :ԑ
Constant variance: In the “Breausch–Pagan / Cook–Weisberg test for heteroskedasticity”, although the p-value is relatively small, notwithstanding the null hypothesis is still rejected that the variance is not constant (the probability is smaller than 0,05). This is also proved by the plot that the pattern of the data points is slightly narrow despite some outliers (Figure 2) VIOLATED
Figure 2: The plot of residuals.
Normality: The p-value in the Shapiro-Wilk W test, which is 0.95, indicates that the error term is aԑ normally distributed random variable. Similarly, the Kernel density plot shows that the error term isԑ quite close to a normal distribution despite a trivial deviation from normality (Figure 3). The normal Q-Q plot also proves the same result (Figure 4) NOT VIOLATED
</div><span class="text_page_counter">Trang 9</span><div class="page_container" data-page="9">Figure 3: The Kernel density plot. Figure 4: The normal Q-Q plot of the residuals. Independence: The value of for a particular set of values for the independent variables is related toԑ the value of for any other set of valuesԑ (Figure 5) VIOLATED
Figure 5: The scatter plot of standardized residuals.
Mean of ԑ: The error term is a random variable with mean or expected value of zero, that is E( ) = 0ԑ ԑ NOT VIOLATED
</div><span class="text_page_counter">Trang 10</span><div class="page_container" data-page="10">As two out of four assumptions are violated, then the results are unreliable or even misleading.
<b>2.3.2. Method 2: Using min, max formula</b>
We apply the following formula to create new data:
x’ =
Unlike the first method, we develop the econometric model of carbon emissions for seven ASEAN countries without using the logarithms:
CO2 = + GDPpc + Ex + Im + TI
To analyze the variances, we built the ANOVA table for logarithms, then infer the equation:
Table 4: The ANOVA table.
CO2 = 0,22 - 0,58GDPpc – 1,64Ex + 1,81Im + 0,28TI (**)
It can be seen from the equation (**) that GDP per capita and export both have negative impacts on the carbon emissions, while import and technology innovation show positive influences on the pollution levels when other variable keeps constant respectively. However, whether the data is reliable or not would be checked through the assumptions about the error term :ԑ
Constant variance: In the “Breausch–Pagan / Cook–Weisberg test for heteroskedasticity”, the p-value is very small, which is equal to 0. Hence, the null hypothesis is rejected that the variance of the error
</div><span class="text_page_counter">Trang 11</span><div class="page_container" data-page="11">term is not constant. This can also be seen in the plot that the pattern of the data points is not goingԑ the same way (Figure 6) VIOLATED
Figure 6: The plot of residuals.
Normality: In the Shapiro-Wilk W test, the error term is not normally distributed as the p-value isԑ very small (0.00). Correspondingly, the Kernel density plot shows that the error term is not close to aԑ normal distribution but slightly follow a right skewness (Figure 7). The normal Q-Q plot also proves the points on the plot clearly depart from a straight line (Figure 8) VIOLATED
</div><span class="text_page_counter">Trang 12</span><div class="page_container" data-page="12">Figure 7: The Kernel density plot. Figure 8: The normal Q-Q plot of the residuals.
Independence: The value of for a particular set of values for the independent variables is related toԑ the value of for any other set of valuesԑ (Figure 9) VIOLATED
Figure 9: The scatter plot of standardized residuals.
Mean of ԑ: The error term is not a random variable with mean or expected value of approximatelyԑ zero, that is E( ) = 0.004 ԑ VIOLATED
</div>